


The negative impact of hypoglycemia on patients with type 1 diabetes mellitus (T1DM) may lead to development of fear of hypoglycemia. In this study, the original Hypoglycemia Fear Survey (HFS) questionnaire was translated into Spanish, adapted and validated, and variables associated to fear of hypoglycemia in T1DM were analyzed.
Materials and methodsThe HFS was translated and adapted to Spanish using the forward-backward translation method. The resulting questionnaire, EsHFS, was administrated to a population with T1DM. The following parameters of the questionnaire were analyzed: feasibility, reliability (Cronbach's alpha), content validity (correlating EsHFS and EsDQOL [Diabetes Quality of Life] questionnaire), and stability (by means of test–retest correlation).
ResultsThe EsHFS questionnaire consists of 24 items and three subscales including: subscale 1 on worry; subscale 2 on hypoglycemia-avoidant behavior, and subscale 3 on hyperglycemia-influenced behavior. Study population: 163 subjects, with a mean aged (SD) of 36 (10.5) years, 24% on continuous subcutaneous insulin infusion. Of these, 99.8% completed the EsHFS questionnaire in less than 10min. Cronbach's alpha for global EsHFS was 0.92. EsHFS and its subscales correlated with EsDQOL. Test–retest correlation (Pearson) was r=0.92. Age, female sex, lower educational level, living alone, frequency of daily self-monitoring and non-severe hypoglycemia, and history of severe and/or asymptomatic hypoglycemia were independently associated to the result of EsHFS.
ConclusionsThe Spanish version of the HFS, EsHFS, has good psychometric properties and may be a useful tool to assess fear of hypoglycemia in Spanish-speaking patients with T1DM.
Las consecuencias negativas de la hipoglucemia en las personas con diabetes mellitus tipo 1 (DM1) pueden resultar en el desarrollo de miedo a la hipoglucemia. Este estudio traduce al español, adapta y valida, el cuestionario original Hypoglycemia Fear Survey (HFS) y analiza qué variables se asocian con el miedo a la hipoglucemia en DM1.
Material y métodosEl HFS fue traducido y adaptado mediante el proceso de traducción-retrotraducción y el nuevo cuestionario obtenido, EsHFS, fue administrado a una población con DM1. Se analizó: factibilidad, confiabilidad (α de Cronbach), validez de contenido (mediante correlación del EsHFS y el cuestionario de calidad de vida, EsDQOL) y estabilidad (correlación test-retest) del cuestionario.
ResultadosEl EsHFS consta de 24 ítems, identificándose 3 subescalas: subescala 1, de preocupación; subescala 2, de comportamiento asociado a evitación y la subescala 3, de comportamiento que produce hiperglucemia. Población incluida: 163 sujetos, M (DE) 36(10,5) años, 24% tratados mediante infusión subcutánea continua de insulina. El 99,8% autocumplimentó el EsHFS en<10min. El α de Cronbach para el EsHFS global fue de 0,92. El EsHFs y las subescalas se correlacionaron con el EsDQOL. La correlación test-retest (Pearson) obtuvo una r=0,92. Edad, sexo femenino, menor nivel formativo/estudios, convivencia sin pareja, frecuencia de autoanálisis y de hipoglucemia no grave, antecedentes de hipoglucemia grave y/o asintomática, se asociaron independientemente al resultado del EsHFS.
ConclusionesLa versión española, EsHFS, posee unas buenas propiedades psicométricas y podría ser útil para evaluar el miedo a la hipoglucemia en población con DM1 que hable español en nuestro entorno.
Hypoglycemia is one of the main limiting factors for achieving adequate glycemic control in patients with type 1 diabetes mellitus (DM1).1 In diabetic patients, the unpleasant symptoms of hypoglycemic episodes, as well as their negative consequences, are often associated with the development of the fear of hypoglycemia (FH), which has a negative impact on the quality of life of both diabetic subjects and family members.2,3 This fear is of clinical relevance in diabetes management, metabolic control, psychological well-being and quality of life.4
Individuals who develop FH take counterproductive actions to prevent potential hypoglycemic episodes, such as reducing the insulin dose or consuming large amounts of carbohydrates, which leads to worsened blood glucose control and an increased risk of long-term complications.2 On the other hand, people with DM1 and FH experience severe hypoglycemia (SH) and asymptomatic hypoglycemia (AH) more often, thereby further increasing FH and complicating disease control.5
Fear of hypoglycemia can be assessed using the Hypoglycemia Fear Survey (HFS), published in 1987 by Cox et al., which quantifies FH-related worries or concerns and the behavior in people with DM1.6 The HFS has been widely used in clinical trials, and has been translated into more than 50 languages, demonstrating its reliability and validity.5 Following the first version, the same authors have recently developed two more versions.5,7 The FH questionnaire, and specifically the original version (HFS), has been translated and adapted in many countries, though not in Spain. Being able to use this questionnaire in Spain is important, since it remains the gold standard diagnostic tool in this field.
The present study was designed to translate into Spanish and adapt and validate the HFS in its initial version, and to analyze the variables associated with FH in a population with DM1.
Materials and methodsThis was a cultural adaptation and evaluation observational study of the psychometric properties (feasibility, reliability, validity and stability) of an FH questionnaire–the HFS–in a population with DM1 representative of the corresponding healthcare area, together with an assessment of the clinical variables associated with the outcomes of the HFS.
Adaptation and evaluation of the psychometric properties of the questionnaireThe cultural adaptation process of the questionnaire was conducted based on the forward/backward translation strategy.8 In our study, this process involved the translation into Spanish of the original version of the HF by two independent bilingual Spanish translators. This first translation was reviewed by an expert committee of three endocrinologists and three diabetes education nurses in order to maintain the conceptual and semantic equivalence of both versions, while adapting the instrument to our setting.
The resulting version in turn was backtranslated by two bilingual translators from the United Kingdom, and was subsequently reviewed by the expert committee. A pilot test involving 15 patients with DM1 was performed on this version in order to analyze the suitability, relevance and understanding of each item. The expert group (translators, endocrinologists and diabetes educators) actively participated in the consensus-based translation by examining the reliability or content validity of the new version. This served to define the final version translated into Spanish (EsHFS), which in turn was evaluated in a larger sample of subjects, along with an analysis of its psychometric properties.
Included participants with type 1 diabetes mellitusThe participants were consecutively recruited on attending their scheduled visits to the Department of Endocrinology of Hospital Universitario Príncipe de Asturias and the Centro de Especialidades Francisco Díaz–both located in Alcalá de Henares (Madrid, Spain). These two centers serve the population of Alcalá de Henares and other nearby municipalities. The following inclusion criteria were established: (1) age over 18 years; (2) a previous diagnosis of DM1 (at least one year before); and (3) sufficient knowledge of the Spanish language to allow for adequate understanding and for an interview to be conducted without the help of third parties. Individuals with disabling complications (blindness, major amputations and/or end-stage renal failure), major psychiatric disorders, and pregnant women were excluded.
Sociodemographic and clinical variables (age, gender, educational level, living with a partner, time from diabetes onset, insulin therapy, complications) were prospectively collected from the structured interviews and the clinical histories. Emphasis was placed on the frequency and severity of hypoglycemia, hypoglycemia perception, and the self-monitoring of capillary blood glucose (SMBG). The frequency of SMBG and the frequency of non-severe hypoglycemia (NSH) was calculated based on glucometer data covering the previous month or from the patient-reported records. The following factors were taken into consideration: NSH, in the presence of symptoms and/or capillary blood glucose <70mg/dl; SH, when intervention by a third person was required; and AH, when symptoms were usually absent, with capillary blood glucose <70mg/dl. We recorded the glycosylated hemoglobin (HbA1c) value closest to the time of the medical visit (<4 weeks), or alternatively HbA1c measurement was performed at that time.
The participants completed the following questionnaires: the final version of the FH questionnaire (EsHFS) and the Spanish version of the Diabetes Quality of Life Questionnaire (EsDQOL).9 Both questionnaires were completed in the waiting room. One in 5 patients was given a sealed envelope containing the EsHFS questionnaire, and it was explained that he/she would be contacted to receive instructions two weeks after inclusion in the study. After these two weeks, instructions were given by telephone to open the envelope, complete the EsHFS again and return it to us in order to allow test–retest correlation analysis.
The sample size was calculated on the basis of the population census of 201010 (195,044 inhabitants>18 years of age), the number of patients with DM1 seen in our healthcare area being estimated at 542 individuals.11,12 The calculated sample size was 135 subjects, assuming a precision of 1% in estimation of the proportion (two-tailed 95% confidence level) and an expected loss to follow-up of 15%.
The study was approved by the Clinical Research Ethics Committee of Hospital Universitario Príncipe de Asturias (Code OE 15/2011), and written informed consent was requested from the participants. Patient data were anonymized to maintain confidentiality.
Analysis of the psychometric properties of the questionnaireOnce the final EsHFS questionnaire was obtained, we checked its feasibility, reliability, validity and stability.
Before assessing these properties and in order to improve the validity of the model, successive item/total correlations were calculated and successive factor analyses were performed until all the remaining items met the standard criteria: correlation and factorial weight >0.3, those items that failed to meet the established criterion being discarded. Exploratory factor analysis was subsequently performed to analyze construct structure and validity. The Kaiser–Meyer–Olkin coefficient and Bartlett's sphericity test were used to check the sample suitability measure. After their suitability had been confirmed, the main components were extracted and rotation was performed using the direct Oblimin method.
The feasibility of the questionnaire was assessed with regard to the response time and the percentage of questions answered. The reliability of the questionnaire was assessed using Cronbach's α statistic. Validation of the questionnaire was carried out by correlating the EsHFS scores and each of the subscales of the EsDQOL. The stability of the questionnaire was assessed by a correlation of the initial EsHFS scores versus the retest scores obtained from the subjects after two weeks.
Data processing and statistical analysisNumerical variables were presented as the mean (M) and standard deviation (SD) or confidence interval (95%CI), as appropriate, while qualitative variables were reported as absolute frequency (n) and percentage (%).
In order to determine whether the EsFHS results corresponding to each of the subscales were associated with the analyzed variables, we grouped the quantitative variables into quartiles. We then analyzed whether there were differences in the EsHFS scores between groups, using the Student t-test and analysis of variance (ANOVA), or applying the Kruskal–Wallis test and Mann–Whitney U-test in the absence of a normal distribution and/or in the presence of differences in homogeneity of variances. Correlations between numerical variables were explored using Spearman's rho (non-continuous variables) and Pearson's r statistic (continuous variables). Analysis of the interaction and independence between variables and their association with the results of the EsHFS was performed using multiple linear regression models with backward selection of the variables.
The SPSS version 15.0 statistical package for MS Windows and the Ene 3.0 application (GlaxoSmithKline, S.A., Tres Cantos, Madrid, Spain) were used for the calculation of sample size. Statistical significance was considered for p<0.05.
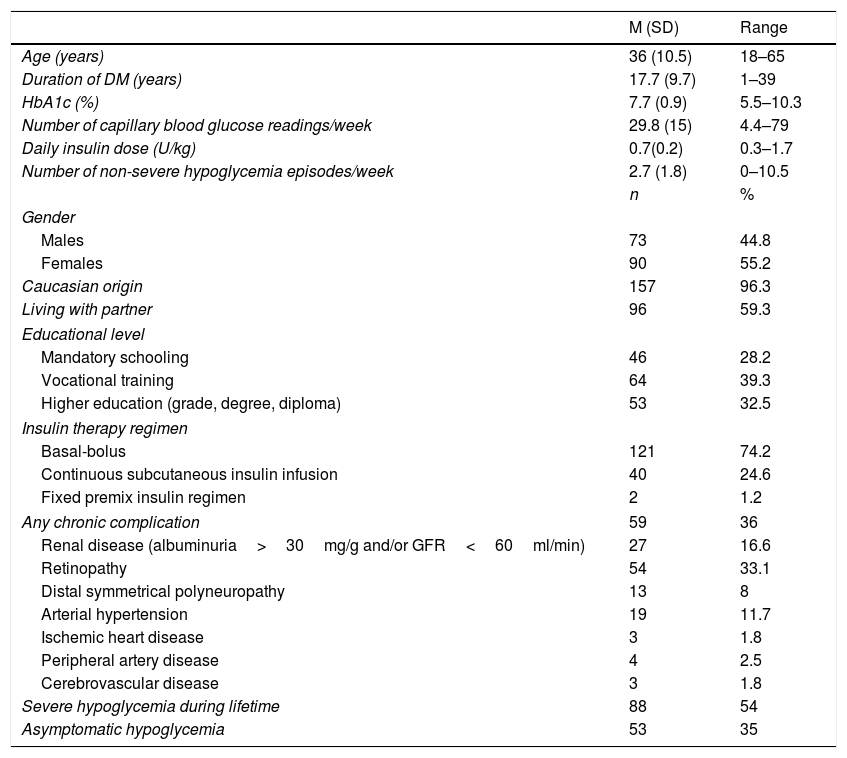
ResultsA total of 167 subjects with DM1 agreed to participate in the study, though four patients failed to complete the questionnaires. A total of 163 subjects were thus finally included. Table 1 shows the sociodemographic and clinical characteristics of the study sample. The mean age (SD) was 36 (10) years; 24.6% used continuous subcutaneous insulin infusion (CSII); 54% had suffered some SH episode in their lifetime; and 35% had AH.
Sociodemographic and clinical characteristics of the study sample (n=163).
| M (SD) | Range | |
|---|---|---|
| Age (years) | 36 (10.5) | 18–65 |
| Duration of DM (years) | 17.7 (9.7) | 1–39 |
| HbA1c (%) | 7.7 (0.9) | 5.5–10.3 |
| Number of capillary blood glucose readings/week | 29.8 (15) | 4.4–79 |
| Daily insulin dose (U/kg) | 0.7(0.2) | 0.3–1.7 |
| Number of non-severe hypoglycemia episodes/week | 2.7 (1.8) | 0–10.5 |
| n | % | |
| Gender | ||
| Males | 73 | 44.8 |
| Females | 90 | 55.2 |
| Caucasian origin | 157 | 96.3 |
| Living with partner | 96 | 59.3 |
| Educational level | ||
| Mandatory schooling | 46 | 28.2 |
| Vocational training | 64 | 39.3 |
| Higher education (grade, degree, diploma) | 53 | 32.5 |
| Insulin therapy regimen | ||
| Basal-bolus | 121 | 74.2 |
| Continuous subcutaneous insulin infusion | 40 | 24.6 |
| Fixed premix insulin regimen | 2 | 1.2 |
| Any chronic complication | 59 | 36 |
| Renal disease (albuminuria>30mg/g and/or GFR<60ml/min) | 27 | 16.6 |
| Retinopathy | 54 | 33.1 |
| Distal symmetrical polyneuropathy | 13 | 8 |
| Arterial hypertension | 19 | 11.7 |
| Ischemic heart disease | 3 | 1.8 |
| Peripheral artery disease | 4 | 2.5 |
| Cerebrovascular disease | 3 | 1.8 |
| Severe hypoglycemia during lifetime | 88 | 54 |
| Asymptomatic hypoglycemia | 53 | 35 |
GFR, glomerular filtration rate (MDRD-4 formula).
Following the exploratory factor analysis and confirmation of the sample suitability of the 27 items of the translated original questionnaire (HFS), the number of items was reduced to 24 in the final questionnaire (EsHFS). The items not included from the original HFS were items 1, 2 and 5 corresponding to the behavioral subscale. The final 24-item version of the EsHFS increased the reliability of the translated original questionnaire, Cronbach's α 0.927, and for all items we confirmed that the item-total correlation was >0.3 (Appendix A, Table e-1). The Kaiser–Meyer–Olkin sample suitability measure for the selected items was 0.904 (p<0.001).
Factorial analysis (Appendix A, Table e-2) identified three components or subscales: subscale 1 or the worry scale (items 1–17); subscale 2 or behavior associated with the avoidance scale (items 18–21); and subscale 3 or behavior causing hyperglycemia (items 22–24). Of these three components, subscale 1 accounted for 42% of the global questionnaire variance, subscale 2 accounted for 6.5%, and subscale 3 accounted for 6.1% of the global variance.
The reliability of each subscale measured by means of Cronbach's α was 0.939, 0.6 and 0.728, respectively, for subscales 1–3 (Appendix A, Table e-1).
The feasibility of the EsHFS as assessed by the percentage of responses was 98.8%. Only two subjects did not answer item 10, referring to vehicle driving. The mean response time (SD) was 8min (1.3), and the questionnaire was completed in under 10min by 162 subjects (99.8%).
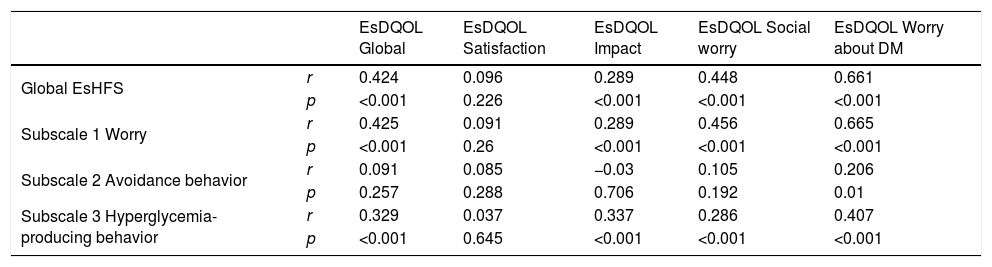
Table 2 shows the validation of the questionnaire based on the correlation between the results of the EsHFS and the EsDQOL. The subscales with the highest correlations corresponded to subscale 1 (worry) of the EsHFS, and with the social worry and worry about DM subscales of the EsDQOL.
Correlation between the results of the EsHFS and each of the subscales with the EsDQOL and its subscales.
| EsDQOL Global | EsDQOL Satisfaction | EsDQOL Impact | EsDQOL Social worry | EsDQOL Worry about DM | ||
|---|---|---|---|---|---|---|
| Global EsHFS | r | 0.424 | 0.096 | 0.289 | 0.448 | 0.661 |
| p | <0.001 | 0.226 | <0.001 | <0.001 | <0.001 | |
| Subscale 1 Worry | r | 0.425 | 0.091 | 0.289 | 0.456 | 0.665 |
| p | <0.001 | 0.26 | <0.001 | <0.001 | <0.001 | |
| Subscale 2 Avoidance behavior | r | 0.091 | 0.085 | −0.03 | 0.105 | 0.206 |
| p | 0.257 | 0.288 | 0.706 | 0.192 | 0.01 | |
| Subscale 3 Hyperglycemia-producing behavior | r | 0.329 | 0.037 | 0.337 | 0.286 | 0.407 |
| p | <0.001 | 0.645 | <0.001 | <0.001 | <0.001 |
r, Pearson correlation coefficient.
The stability of the questionnaire assessed by test–retest correlation was: global EsHFS, r=0.92 (95%CI 0.84–0.96), p<0.001; subscale 1, r=0.91 (95%CI 0.82–0.96), p<0.001; subscale 2, r=0.46 (95%CI 0.13–0.70), p=0.009; and subscale 3, r=0.91 (95%CI 0.82–0.96), p<0.001.
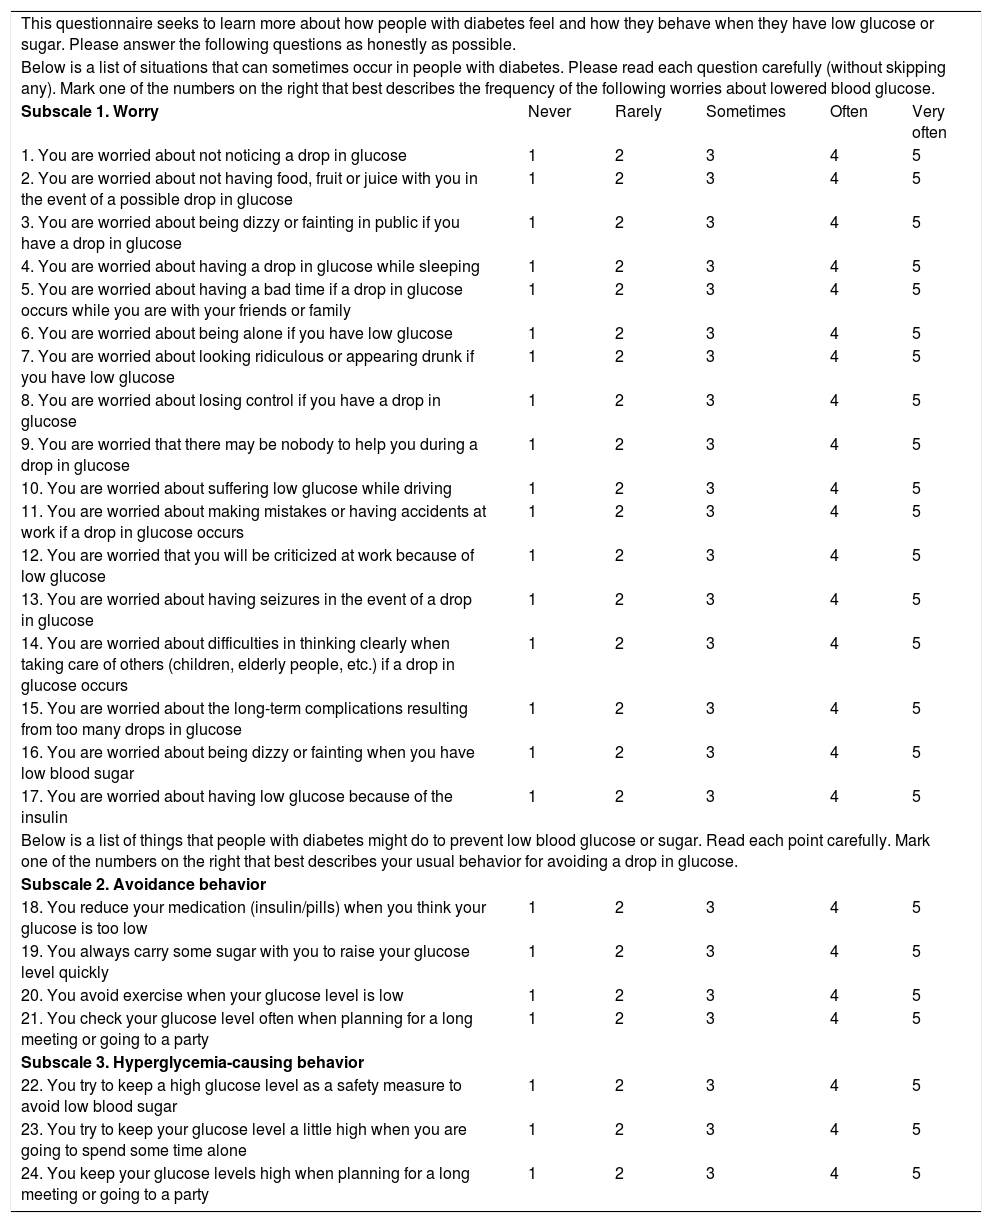
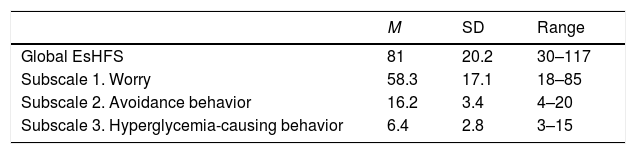
The EsHFS questionnaire in its final form is shown in Table 3. A score of 1–5 is assigned to each item, making 24 points the minimum score for the global EsHFS and 120 points the maximum. Table 4 shows the distribution of the questionnaire and each of the subscales in our sample.
Definitive hypoglycemia fear questionnaire model. EsHFS.
| This questionnaire seeks to learn more about how people with diabetes feel and how they behave when they have low glucose or sugar. Please answer the following questions as honestly as possible. | |||||
| Below is a list of situations that can sometimes occur in people with diabetes. Please read each question carefully (without skipping any). Mark one of the numbers on the right that best describes the frequency of the following worries about lowered blood glucose. | |||||
| Subscale 1. Worry | Never | Rarely | Sometimes | Often | Very often |
| 1. You are worried about not noticing a drop in glucose | 1 | 2 | 3 | 4 | 5 |
| 2. You are worried about not having food, fruit or juice with you in the event of a possible drop in glucose | 1 | 2 | 3 | 4 | 5 |
| 3. You are worried about being dizzy or fainting in public if you have a drop in glucose | 1 | 2 | 3 | 4 | 5 |
| 4. You are worried about having a drop in glucose while sleeping | 1 | 2 | 3 | 4 | 5 |
| 5. You are worried about having a bad time if a drop in glucose occurs while you are with your friends or family | 1 | 2 | 3 | 4 | 5 |
| 6. You are worried about being alone if you have low glucose | 1 | 2 | 3 | 4 | 5 |
| 7. You are worried about looking ridiculous or appearing drunk if you have low glucose | 1 | 2 | 3 | 4 | 5 |
| 8. You are worried about losing control if you have a drop in glucose | 1 | 2 | 3 | 4 | 5 |
| 9. You are worried that there may be nobody to help you during a drop in glucose | 1 | 2 | 3 | 4 | 5 |
| 10. You are worried about suffering low glucose while driving | 1 | 2 | 3 | 4 | 5 |
| 11. You are worried about making mistakes or having accidents at work if a drop in glucose occurs | 1 | 2 | 3 | 4 | 5 |
| 12. You are worried that you will be criticized at work because of low glucose | 1 | 2 | 3 | 4 | 5 |
| 13. You are worried about having seizures in the event of a drop in glucose | 1 | 2 | 3 | 4 | 5 |
| 14. You are worried about difficulties in thinking clearly when taking care of others (children, elderly people, etc.) if a drop in glucose occurs | 1 | 2 | 3 | 4 | 5 |
| 15. You are worried about the long-term complications resulting from too many drops in glucose | 1 | 2 | 3 | 4 | 5 |
| 16. You are worried about being dizzy or fainting when you have low blood sugar | 1 | 2 | 3 | 4 | 5 |
| 17. You are worried about having low glucose because of the insulin | 1 | 2 | 3 | 4 | 5 |
| Below is a list of things that people with diabetes might do to prevent low blood glucose or sugar. Read each point carefully. Mark one of the numbers on the right that best describes your usual behavior for avoiding a drop in glucose. | |||||
| Subscale 2. Avoidance behavior | |||||
| 18. You reduce your medication (insulin/pills) when you think your glucose is too low | 1 | 2 | 3 | 4 | 5 |
| 19. You always carry some sugar with you to raise your glucose level quickly | 1 | 2 | 3 | 4 | 5 |
| 20. You avoid exercise when your glucose level is low | 1 | 2 | 3 | 4 | 5 |
| 21. You check your glucose level often when planning for a long meeting or going to a party | 1 | 2 | 3 | 4 | 5 |
| Subscale 3. Hyperglycemia-causing behavior | |||||
| 22. You try to keep a high glucose level as a safety measure to avoid low blood sugar | 1 | 2 | 3 | 4 | 5 |
| 23. You try to keep your glucose level a little high when you are going to spend some time alone | 1 | 2 | 3 | 4 | 5 |
| 24. You keep your glucose levels high when planning for a long meeting or going to a party | 1 | 2 | 3 | 4 | 5 |
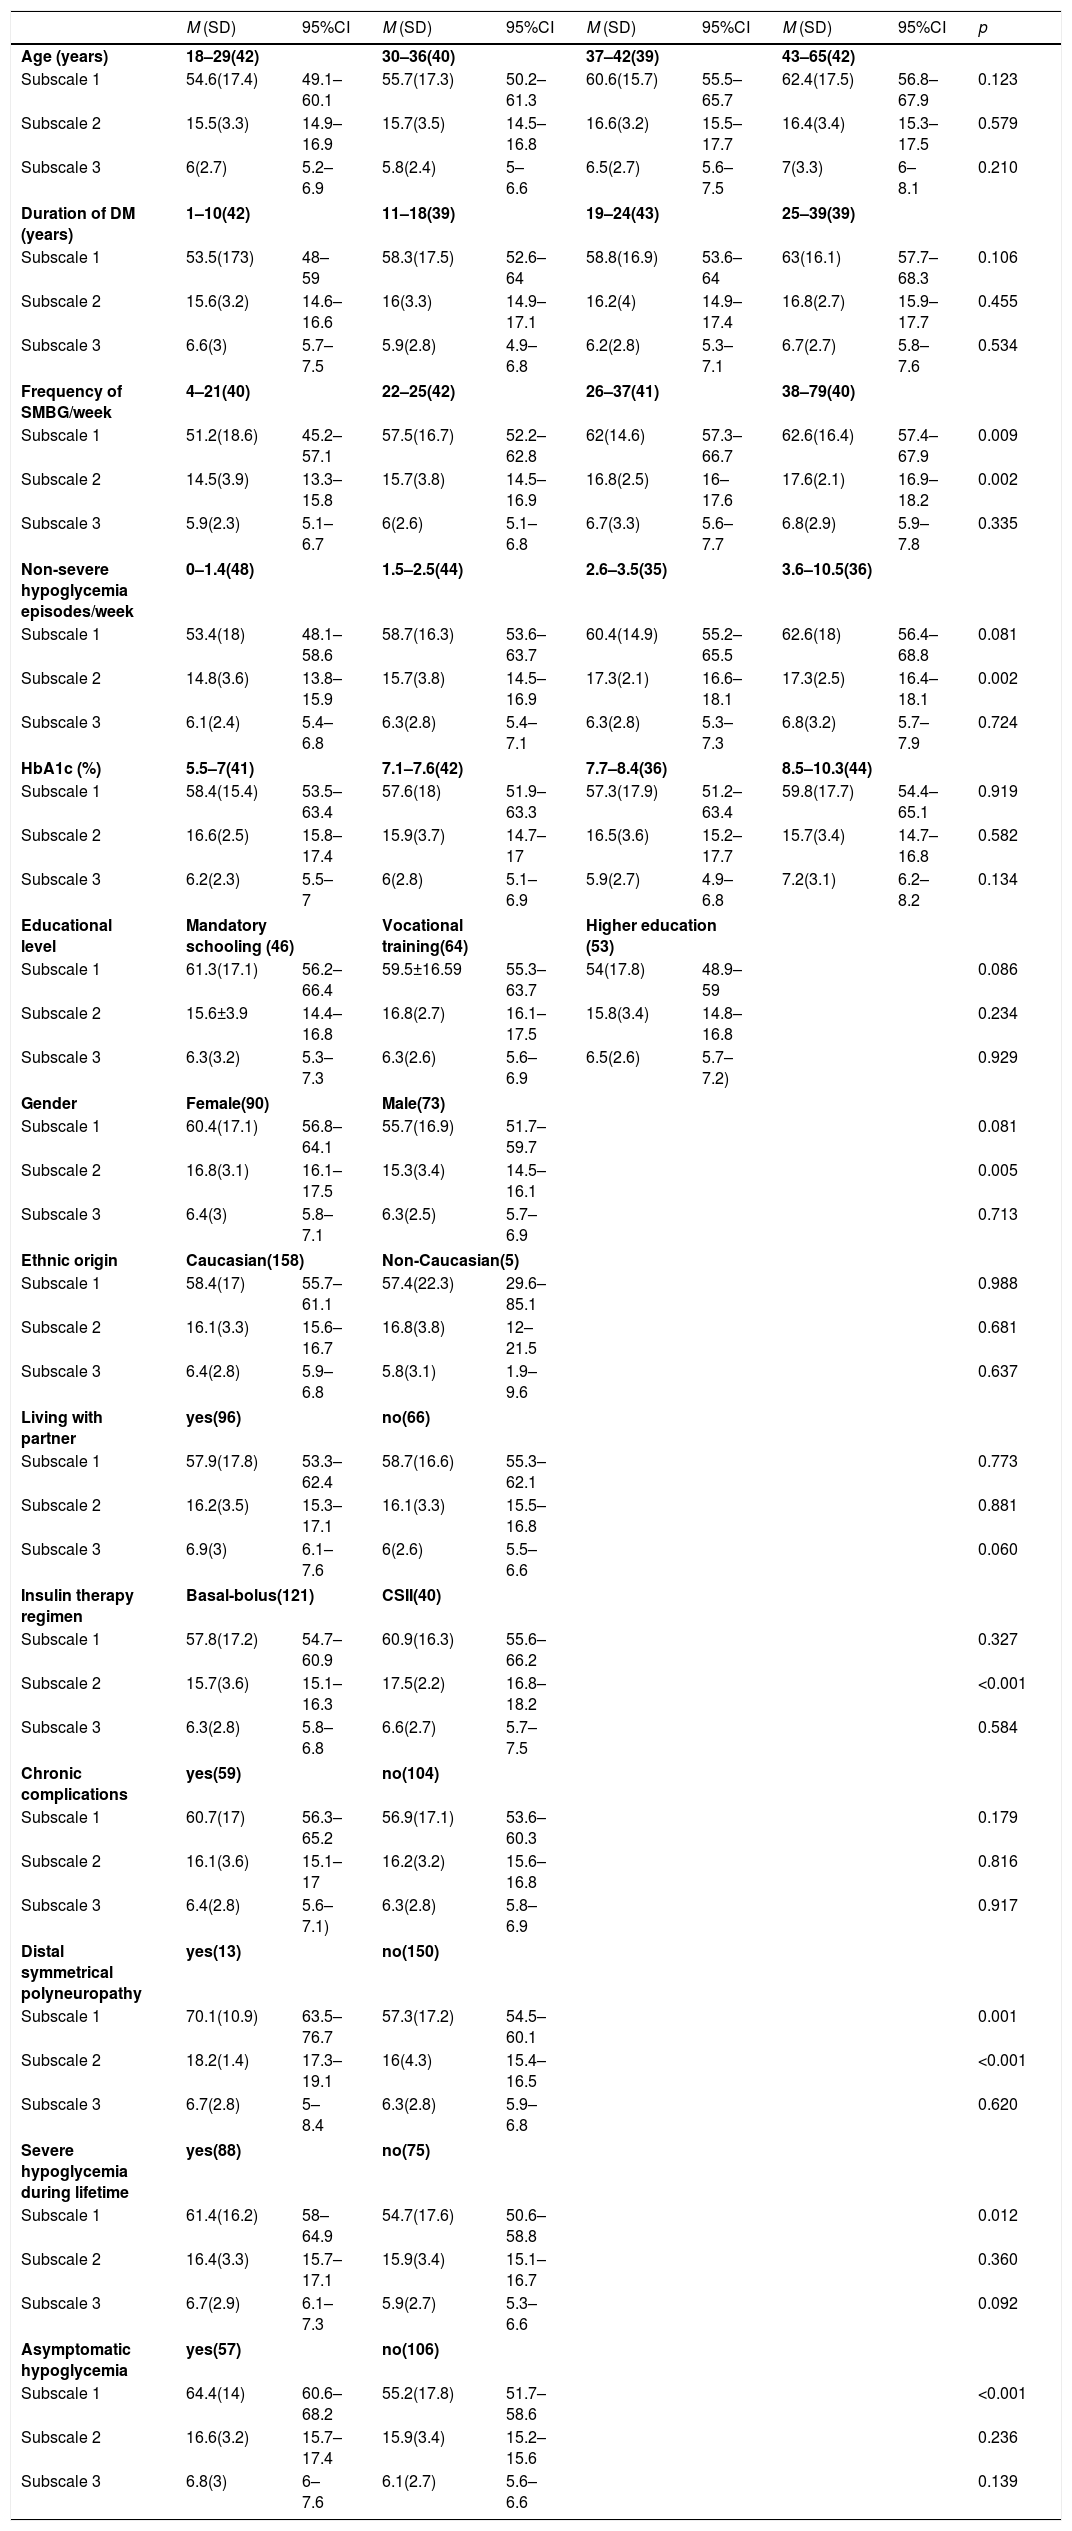
The association of the results of HFS with the variables analyzed was explored using univariate and multivariate models. In the univariate analysis (Table 5), higher scores were seen in subscale 1 in the group of subjects that performed more SMBG, the presence of polyneuropathy, SH and AH. In turn, higher scores were seen in subscale 2 in the group of subjects that performed more SMBG, in those who had more NSH, women, those who used CSII, and those with polyneuropathy.
Results of the subscales and their association with sociodemographic and clinical variables.
| M (SD) | 95%CI | M (SD) | 95%CI | M (SD) | 95%CI | M (SD) | 95%CI | p | |
|---|---|---|---|---|---|---|---|---|---|
| Age (years) | 18–29(42) | 30–36(40) | 37–42(39) | 43–65(42) | |||||
| Subscale 1 | 54.6(17.4) | 49.1–60.1 | 55.7(17.3) | 50.2–61.3 | 60.6(15.7) | 55.5–65.7 | 62.4(17.5) | 56.8–67.9 | 0.123 |
| Subscale 2 | 15.5(3.3) | 14.9–16.9 | 15.7(3.5) | 14.5–16.8 | 16.6(3.2) | 15.5–17.7 | 16.4(3.4) | 15.3–17.5 | 0.579 |
| Subscale 3 | 6(2.7) | 5.2–6.9 | 5.8(2.4) | 5–6.6 | 6.5(2.7) | 5.6–7.5 | 7(3.3) | 6–8.1 | 0.210 |
| Duration of DM (years) | 1–10(42) | 11–18(39) | 19–24(43) | 25–39(39) | |||||
| Subscale 1 | 53.5(173) | 48–59 | 58.3(17.5) | 52.6–64 | 58.8(16.9) | 53.6–64 | 63(16.1) | 57.7–68.3 | 0.106 |
| Subscale 2 | 15.6(3.2) | 14.6–16.6 | 16(3.3) | 14.9–17.1 | 16.2(4) | 14.9–17.4 | 16.8(2.7) | 15.9–17.7 | 0.455 |
| Subscale 3 | 6.6(3) | 5.7–7.5 | 5.9(2.8) | 4.9–6.8 | 6.2(2.8) | 5.3–7.1 | 6.7(2.7) | 5.8–7.6 | 0.534 |
| Frequency of SMBG/week | 4–21(40) | 22–25(42) | 26–37(41) | 38–79(40) | |||||
| Subscale 1 | 51.2(18.6) | 45.2–57.1 | 57.5(16.7) | 52.2–62.8 | 62(14.6) | 57.3–66.7 | 62.6(16.4) | 57.4–67.9 | 0.009 |
| Subscale 2 | 14.5(3.9) | 13.3–15.8 | 15.7(3.8) | 14.5–16.9 | 16.8(2.5) | 16–17.6 | 17.6(2.1) | 16.9–18.2 | 0.002 |
| Subscale 3 | 5.9(2.3) | 5.1–6.7 | 6(2.6) | 5.1–6.8 | 6.7(3.3) | 5.6–7.7 | 6.8(2.9) | 5.9–7.8 | 0.335 |
| Non-severe hypoglycemia episodes/week | 0–1.4(48) | 1.5–2.5(44) | 2.6–3.5(35) | 3.6–10.5(36) | |||||
| Subscale 1 | 53.4(18) | 48.1–58.6 | 58.7(16.3) | 53.6–63.7 | 60.4(14.9) | 55.2–65.5 | 62.6(18) | 56.4–68.8 | 0.081 |
| Subscale 2 | 14.8(3.6) | 13.8–15.9 | 15.7(3.8) | 14.5–16.9 | 17.3(2.1) | 16.6–18.1 | 17.3(2.5) | 16.4–18.1 | 0.002 |
| Subscale 3 | 6.1(2.4) | 5.4–6.8 | 6.3(2.8) | 5.4–7.1 | 6.3(2.8) | 5.3–7.3 | 6.8(3.2) | 5.7–7.9 | 0.724 |
| HbA1c (%) | 5.5–7(41) | 7.1–7.6(42) | 7.7–8.4(36) | 8.5–10.3(44) | |||||
| Subscale 1 | 58.4(15.4) | 53.5–63.4 | 57.6(18) | 51.9–63.3 | 57.3(17.9) | 51.2–63.4 | 59.8(17.7) | 54.4–65.1 | 0.919 |
| Subscale 2 | 16.6(2.5) | 15.8–17.4 | 15.9(3.7) | 14.7–17 | 16.5(3.6) | 15.2–17.7 | 15.7(3.4) | 14.7–16.8 | 0.582 |
| Subscale 3 | 6.2(2.3) | 5.5–7 | 6(2.8) | 5.1–6.9 | 5.9(2.7) | 4.9–6.8 | 7.2(3.1) | 6.2–8.2 | 0.134 |
| Educational level | Mandatory schooling (46) | Vocational training(64) | Higher education (53) | ||||||
| Subscale 1 | 61.3(17.1) | 56.2–66.4 | 59.5±16.59 | 55.3–63.7 | 54(17.8) | 48.9–59 | 0.086 | ||
| Subscale 2 | 15.6±3.9 | 14.4–16.8 | 16.8(2.7) | 16.1–17.5 | 15.8(3.4) | 14.8–16.8 | 0.234 | ||
| Subscale 3 | 6.3(3.2) | 5.3–7.3 | 6.3(2.6) | 5.6–6.9 | 6.5(2.6) | 5.7–7.2) | 0.929 | ||
| Gender | Female(90) | Male(73) | |||||||
| Subscale 1 | 60.4(17.1) | 56.8–64.1 | 55.7(16.9) | 51.7–59.7 | 0.081 | ||||
| Subscale 2 | 16.8(3.1) | 16.1–17.5 | 15.3(3.4) | 14.5–16.1 | 0.005 | ||||
| Subscale 3 | 6.4(3) | 5.8–7.1 | 6.3(2.5) | 5.7–6.9 | 0.713 | ||||
| Ethnic origin | Caucasian(158) | Non-Caucasian(5) | |||||||
| Subscale 1 | 58.4(17) | 55.7–61.1 | 57.4(22.3) | 29.6–85.1 | 0.988 | ||||
| Subscale 2 | 16.1(3.3) | 15.6–16.7 | 16.8(3.8) | 12–21.5 | 0.681 | ||||
| Subscale 3 | 6.4(2.8) | 5.9–6.8 | 5.8(3.1) | 1.9–9.6 | 0.637 | ||||
| Living with partner | yes(96) | no(66) | |||||||
| Subscale 1 | 57.9(17.8) | 53.3–62.4 | 58.7(16.6) | 55.3–62.1 | 0.773 | ||||
| Subscale 2 | 16.2(3.5) | 15.3–17.1 | 16.1(3.3) | 15.5–16.8 | 0.881 | ||||
| Subscale 3 | 6.9(3) | 6.1–7.6 | 6(2.6) | 5.5–6.6 | 0.060 | ||||
| Insulin therapy regimen | Basal-bolus(121) | CSII(40) | |||||||
| Subscale 1 | 57.8(17.2) | 54.7–60.9 | 60.9(16.3) | 55.6–66.2 | 0.327 | ||||
| Subscale 2 | 15.7(3.6) | 15.1–16.3 | 17.5(2.2) | 16.8–18.2 | <0.001 | ||||
| Subscale 3 | 6.3(2.8) | 5.8–6.8 | 6.6(2.7) | 5.7–7.5 | 0.584 | ||||
| Chronic complications | yes(59) | no(104) | |||||||
| Subscale 1 | 60.7(17) | 56.3–65.2 | 56.9(17.1) | 53.6–60.3 | 0.179 | ||||
| Subscale 2 | 16.1(3.6) | 15.1–17 | 16.2(3.2) | 15.6–16.8 | 0.816 | ||||
| Subscale 3 | 6.4(2.8) | 5.6–7.1) | 6.3(2.8) | 5.8–6.9 | 0.917 | ||||
| Distal symmetrical polyneuropathy | yes(13) | no(150) | |||||||
| Subscale 1 | 70.1(10.9) | 63.5–76.7 | 57.3(17.2) | 54.5–60.1 | 0.001 | ||||
| Subscale 2 | 18.2(1.4) | 17.3–19.1 | 16(4.3) | 15.4–16.5 | <0.001 | ||||
| Subscale 3 | 6.7(2.8) | 5–8.4 | 6.3(2.8) | 5.9–6.8 | 0.620 | ||||
| Severe hypoglycemia during lifetime | yes(88) | no(75) | |||||||
| Subscale 1 | 61.4(16.2) | 58–64.9 | 54.7(17.6) | 50.6–58.8 | 0.012 | ||||
| Subscale 2 | 16.4(3.3) | 15.7–17.1 | 15.9(3.4) | 15.1–16.7 | 0.360 | ||||
| Subscale 3 | 6.7(2.9) | 6.1–7.3 | 5.9(2.7) | 5.3–6.6 | 0.092 | ||||
| Asymptomatic hypoglycemia | yes(57) | no(106) | |||||||
| Subscale 1 | 64.4(14) | 60.6–68.2 | 55.2(17.8) | 51.7–58.6 | <0.001 | ||||
| Subscale 2 | 16.6(3.2) | 15.7–17.4 | 15.9(3.4) | 15.2–15.6 | 0.236 | ||||
| Subscale 3 | 6.8(3) | 6–7.6 | 6.1(2.7) | 5.6–6.6 | 0.139 | ||||
Association with quantitative (grouped into quartiles) and qualitative variables. The number (n) corresponding to each group is shown in parentheses.
A subanalysis was performed to check for differences in EsHFS between subjects with very poor glycemic control (4th quartile, HbA1c≥8.5%) versus better control (1–3rd quartile, HbA1c<8.5%). Higher scores on the hyperglycemia-causing behavior subscale were found in subjects showing poorer control, with 7.2 (3.1) versus 6 (2.6) (mean [SD]); p=0.022.
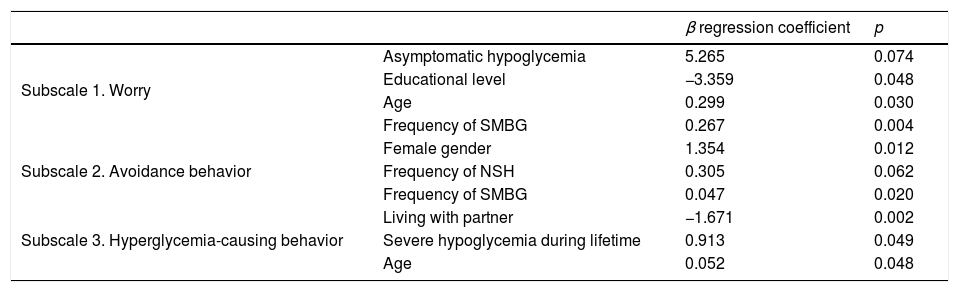
The multivariate analysis (Table 6) showed FH measured as worry to be associated with AH, a lower educational level, older age, and a greater frequency of SMBG. Avoidance behavior was more common in females, in subjects with NSH, and in patients with more frequent self-monitoring. Hyperglycemia-causing behavior was associated with not living with a partner, and increased in subjects with a history of SH and in older patients.
Multivariate analysis of the EsHFS subscales.
| β regression coefficient | p | ||
|---|---|---|---|
| Subscale 1. Worry | Asymptomatic hypoglycemia | 5.265 | 0.074 |
| Educational level | −3.359 | 0.048 | |
| Age | 0.299 | 0.030 | |
| Frequency of SMBG | 0.267 | 0.004 | |
| Subscale 2. Avoidance behavior | Female gender | 1.354 | 0.012 |
| Frequency of NSH | 0.305 | 0.062 | |
| Frequency of SMBG | 0.047 | 0.020 | |
| Subscale 3. Hyperglycemia-causing behavior | Living with partner | −1.671 | 0.002 |
| Severe hypoglycemia during lifetime | 0.913 | 0.049 | |
| Age | 0.052 | 0.048 |
Multiple linear regression analysis adjusted for the following variables: age, gender, living with partner, educational level, duration of DM, presence of chronic complications, frequency of non-severe hypoglycemia (NSH), frequency of self-monitoring of capillary blood glucose (SMBG), insulin therapy (CSII versus basal-bolus), history of severe hypoglycemia, presence of asymptomatic hypoglycemia, and HbA1c. Those significant (p<0.05) or borderline are shown.
The present study translated, adapted and validated the HFS, which is regarded as the gold standard for quantifying FH in diabetic populations. The version obtained (EsHFS) has adequate psychometric measures, such as feasibility, reliability and stability over time, and has been validated in a population with DM1 representative of the Spanish population. The association with certain sociodemographic and clinical variables, supported by studies using this questionnaire translated into other languages,2,13 warrants its use in the population with DM1 in our setting.
During the translation and backtranslation process, as well as in the final adaptation of the instrument, we attempted to be faithful to the original version in terms of content and intention of items, seeking always to use language comprehensible to any person regardless of educational level. The elimination of three items from the original questionnaire allowed for an improvement of Cronbach's α, reflecting excellent internal consistency, with a value of >0.9.14
Factorial analysis identified three subscales, one coinciding with the original questionnaire (the worry subscale), and two referring to FH-associated behavior such as avoidance or actions producing hyperglycemia. The original study identified a worry or concern subscale and a general behavior subscale. However, within behavior, the actions clearly differ and do not always coincide in subjects with FH. Recently, the analysis of a sample of 1460 adults with DM1 from 5 countries using the most recent version of the HFS,5 also known as HFS-II, translated into their respective languages, obtained the same subscales as in our study.13 However, the two behavior subscales showed less reliability, though they can be regarded as acceptable considering that the number of items in each subscale was less than 10.15 This aspect–the lower reliability of the behavior subscales–was already observed in the original questionnaire,6 and has been repeated in subsequent adaptations of the instrument.5,16 In parallel, both subscales explain a lower percentage of the variance of the global questionnaire (6.5% and 6.1%, respectively) than the worry subscale (42%). This aspect is what could have caused some investigators to prefer to only use the worry subscale in their studies.17
Feasibility has not been reported in the studies that have translated and validated this questionnaire. In the present study, it took subjects an average of 8min to complete the questionnaire, and it was administered in the clinical practice setting: these features support its use in routine practice. The stability of the questionnaire over time, with test–retest correlation coefficients higher than those reported in the original study,6 warrants its adequate psychometric properties.
The final questionnaire (EsHFS) was validated by analyzing its correlation with the EsDQOL, though this process was not necessary, since we were dealing with the translation and adaptation of an instrument that had already been validated. Most studies use questionnaires that measure the emotional impact associated with diabetes, such as the Problem Areas in Diabetes scale18 and/or questionnaires such as the Stait-Trait and Anxiety Inventory (STAI).19 However, such tools may be distorted by other factors not associated with diabetes. Quality of life and FH are interdependent variables,20,21 with adequate correlation being found in our study, particularly with the more specific spheres of diabetes such as impact, social worry, and worry about diabetes.
Analysis of the association between the included variables and the final version of the EsHFS allowed us to test the questionnaire for the first time.
Among the sociodemographic factors related to the development of FH, only female gender4,5,22,23 and age13 were studied and correlated to the HFS outcomes. Other factors such as educational level and marital status or type of family cohabitation were not evaluated. In our study, older people and women independently showed greater FH in some of the subscales, namely age in the worry subscale and the hyperglycemia-related behavior subscale, and female gender in the avoidance behavior subscale. These findings may be explained by taking two aspects into account: (i) over the years, as people gradually accumulate life experiences they tend to become more conservative; and (ii) women have greater FH in the same way as is seen in other depressive or anxiety disorders.24
Among the clinical factors, the frequency of SMBG was higher among the subjects with greater FH, and an independent association was found between these two parameters. This association has not been analyzed in the literature, and we interpret it as a consequence of having greater FH. With regard to the degree of control, we only detected an association between HbA1c and FH (the hyperglycemia-causing behavior subscale) in the subanalysis comparing those subjects with poorer control, 4th quartile versus 1st–3rd quartile, though not in the multivariate study. This aspect was reported in the original study and in an international study in 5 countries.6,13 The sample size of this study perhaps was not large enough to identify this association with greater statistical robustness.
The most commonly implicated clinical factor in FH is probably hypoglycemia, in terms of both frequency and severity, particularly SH.2 The presence of SH is the factor most commonly described in the literature as being associated with FH measured by means of the HFS4,17,22 and by another recently developed questionnaire (FH15).25,26 Asymptomatic hypoglycemia, a factor often preceding SH,27 was also associated with FH particularly in the worry subscale, though the p-value only reached the limit of significance in the multivariate analysis. These data suggest higher scores to be associated with greater worry, more avoidance behavior, and more hyperglycemia.
The present study has limitations:
- -
Although data collection was prospective, there were parameters such as the frequency of hypoglycemia as reported by the patient during the interview which could have been underestimated.
- -
Subject classification referring to AH is based on a question. At the time of this study, we did not have the Clarke questionnaire recently translated into Spanish.28
- -
The classification of marital status to establish the type of cohabitation (with or without a partner) did not correspond to the clinical variable proposed in the study design (i.e., the determination of whether stable living with a partner or family was associated with greater or lesser FH).
- -
The short version of the HFS-II was published at a later date7 and therefore could not be used.
The study has a number of strong points:
- -
It is the first study to translate and validate the HFS questionnaire, which is the reference for quantifying FH, and also the most widely used instrument in most studies that address this subject.
- -
We included any patient with DM1, without excluding individuals with SH as is often done in studies.
- -
The operating procedure, as well as the methodology used, are widely supported by similar studies.
- -
Study participation in terms of the completion of the questionnaire was high.
In conclusion, the Spanish version of the HFS questionnaire developed in this study (EsHFS) has good psychometric properties, and represents a useful tool for assessing FH in Spanish-speaking patients with DM1 in our setting.
Conflicts of interestThe authors declare that they have no conflicts of interest.
Thanks are due to all the members of the Department of Endocrinology and Nutrition of Hospital Universitario Príncipe de Asturias, and to all the participants in the study, for their kind collaboration and participation in the study. Thanks are also due to Prof. R. San Martín-Castellanos for his invaluable methodological support of this project.
The following are the supplementary data to this article:
Please cite this article as: Tasende C, Rubio JA, Álvarez J. Traducción al español, adaptación y validación del Cuestionario de miedo a la hipoglucemia en adultos con diabetes tipo 1 de la Comunidad de Madrid. Endocrinol Diabetes Nutr. 2018;65:287–296.
