


Several studies warn that overweight and obesity have become an epidemic with severe consequences in the population's health. The objective of the present study is to estimate the prevalence of overweight and obesity in Castile and Leon in a sample of children at 6, 11 and 14 years of age, to describe its evolution and its association with life habits and antecedents.
Material and methodsObservational study, retrospective cohort, performed by the pediatricians of the Health Sentinel Network. The study is part of a joint Project with the National Research Center on Human Evolution (CENIEH) in Burgos to know the pattern of growth and development of the child population of Castile and Leon. In 2012, a health examination and a retrospective collection were carried out based on the clinical history of a simple of 326 children, from the cohort was born in 1998.
ResultsFollowing the WHO references, at age 14 there was 25.3% of boys and 18.5% of girls with overweight. Obesity was estimated to affect the 8.2% and 4.8% of them respectively. At 11 years of age there was the maximum of overweight in girls and of obesity in boys. At the urban-non urban environment, quantity and quality of sleep and the parents’ BMI have been some of the associated factors to weight level of the children.
DiscussionIn Castile and Leon, as in other populations of our environment, there is a severe problem of overweight and obesity. For their control it is necessary to deepen understanding of lifestyles and antecedents related to the birth as well as to calculate the growth rate in the pediatric age.
Varios estudios advierten que el sobrepeso y la obesidad se han convertido en una epidemia con graves consecuencias sobre la salud de la población. El objetivo del presente estudio es estimar la prevalencia de sobrepeso y obesidad en Castilla y León en una muestra de niños a los 6, 11 y 14 años de edad, describir su evolución y su asociación con hábitos de vida y antecedentes.
MetodologíaEstudio observacional, de cohorte retrospectivo, realizado por los pediatras de la Red Centinela Sanitaria, que se enmarca en un proyecto conjunto con el Centro Nacional de Investigación sobre la Evolución Humana de Burgos para conocer el patrón de crecimiento y desarrollo de la población infantil de Castilla y León. En 2012 se realizó un examen de salud y una recogida retrospectiva a partir de la historia clínica en una muestra de 326 niños, de la cohorte de nacidos en 1998.
ResultadosSegún los criterios de la OMS, a los 14 años había un 25,3% de sobrepeso entre los niños y un 18,5% entre las niñas. En cuanto a la obesidad, esta afectaba al 8,2 y 4,8%, respectivamente. A los 11 años se produce un pico de sobrepeso en las niñas y de obesidad en los niños. El entorno urbano-no urbano, la calidad y duración del sueño, así como el índice de masa corporal (IMC) de los padres han sido algunos de los factores asociados con el peso de los niños.
DiscusiónEn Castilla y León, como en otras poblaciones de nuestro entorno, existe un grave problema de sobrepeso y obesidad infantil. Para su control, es necesario profundizar sobre los estilos de vida y los antecedentes relacionados con el nacimiento, así como el cálculo de la velocidad de crecimiento en la edad pediátrica.
Overweight and obesity are considered a true epidemic in developed countries and represent one of the greatest challenges facing public health today.1 In a study conducted in Cantabria (Spain), overweight and obesity were found to affect approximately 60% of the adult population.2 Obesity in childhood and adolescence has been shown to be predictive of obesity in adulthood and to increase the risk of morbidity and mortality in adults,3 since it is associated with various disorders such as cardiovascular disease, cancer and diabetes. The Spanish National Health Survey (Encuesta Nacional de Salud [ENS]) corresponding to 2011–2012 showed 18.3% of all children between 2 and 17 years of age to be overweight, while 9.6% were obese.4 The overweight and obesity rates among adolescents and adults in Spain have increased over the last decade and are currently higher than the European Union (EU) average. In adolescents aged 15 years the figure increased from 16% in 2001–2002 to 20% in 2013–2014, with higher rates in boys (24%) than in girls (15%).5 Even higher figures have been published in the Canary Islands, with 29.5% for girls and 22.8% for boys.6 According to the ALADINO study,7 19.4% of children 6 years of age are overweight and 10.4% are obese, and these figures moreover increase to 26.4% overweight and 11.4% obese at 9 years of age, both of these cases being based on the references of the International Obesity Task Force (IOTF).8 According to the ENS, in Castilla y León 20.3% of all children aged 2–17 years were overweight and 6.1% were obese. In a study conducted by the Directorate General of Public Health of the Department of Health of the Regional Government of Castilla y León between 2009 and 2013, the estimated prevalence of overweight and obesity in this Autonomous Community was 17.17% in boys and 12.39% in girls.9
This serious public health problem led the Spanish Government to adopt a new food safety and nutrition law in 2011, seeking to reduce childhood overweight and obesity.10 Among other things, this law bans meals with high levels of saturated fatty acids, salt and sugars in schools, and regulates children's menus.
One of the greatest problems in studying childhood obesity is the difficulty of establishing standardized indicators and classifications allowing reliable estimates and comparisons between populations. Although the body mass index (BMI) is accepted both clinically and epidemiologically for measuring obesity in childhood and adolescence,11 the criteria are not as standardized as in the case of adults, where overweight is defined as a BMI≥25kg/m2 and obesity as a BMI≥30kg/m2. Instead, there are a number of reference tables, such as those of the World Health Organization (WHO)12 or the International Obesity Task Force (IOTF),8 etc., as well as others that give rise to variations in prevalence.
Genetic factors such as family history, environmental factors such as a rural or urban habitat, and lifestyle all influence excess body weight and obesity in children.13 By contrast, breastfeeding for at least three months14 and normal birth weight act as protective factors.15
The present study was designed to estimate the prevalence of overweight and obesity in Castilla y León in a sample of boys and girls corresponding to the cohort born in 1998 at 6, 11 and 14 years of age, according to the WHO and IOTF references, and to describe its course and correlation to lifestyle and personal and family history. The study also forms part of a joint project with the Paleophysiology and Ecology Group of the National Center for Research on Human Evolution (Centro Nacional de Investigación sobre la Evolución Humana [CENIEH]) in Burgos. This new data compilation phase will allow for an adjustment of the growth curve once the participants have completed their development period.
MethodologyA retrospective, observational cohort study was conducted by pediatricians from the Health Sentinel Network (Red Centinela Sanitaria) of Castilla y León. A health examination was carried out, and information was collected on a retrospective basis from the clinical histories of a sample of boys and girls born in 1998.
The health examination was made in 2012, coinciding with the healthy child check-up scheduled for the year in which the children turned 14. Information was collected on the date of the check-up regarding personal data, the anthropometric parameters of the fathers and mothers, the current anthropometric data of the children, and the age of menarche of the mothers and girls. Anthropometric measurements were obtained according to protocolized standards and norms, with calibrated electronic scales being used, the subjects being weighed in their underwear, and height being measured while they were barefoot. The information was completed with a nutrition and lifestyle survey at the time of the check-up.
For each child retrospective data compilation was made by reviewing the clinical history (in electronic or paper format) and the pediatric health document, which details the evolution of anthropometric parameters and provides information related to pediatric health. The data in this regard included the type of delivery and maturity, the type of lactation and its duration, and anthropometric data collected on the occasions of the different pediatric check-ups: body weight, height and head circumference at birth, after 15 days, and at 1, 2, 4, 6, 12, 15 and 18 months of age, and weight and height at 2, 3, 6 and 11 years. The data at birth and at 6 and 11 years were collected from the clinical history of the corresponding check-ups, which follow the same protocols used in the check-up at 14 years of age.
Twenty of the 23 pediatricians belonging to the Health Sentinel Network of Castilla y León participated in the study. A first random sample of 9 boys and 9 girls was generated for each pediatrician from the health card database (360 children overall). A second reserve random sample of 4 boys and 4 girls was also generated for each pediatrician to replace children that were excluded or could not be located.
The BMI was calculated from the data of the sample, the underweight, overweight and obesity categories being established according to the WHO12 (underweight: <−2 standard deviations (SD); overweight: ≥+1 SD; and obesity: ≥+2 SD) and IOTF criteria8 (pediatric equivalents of the adult cut-off points for underweight: BMI<18.5kg/m2; overweight: BMI≥25kg/m2; and obesity: BMI≥30kg/m2).16 For each child, this procedure was carried out at the age at the time of the study, 11 years and 6 years. Stratification by gender was made, with a calculation of the proportions of each weight category at each age, and the corresponding 95% confidence intervals (95%CIs).
To study the variation over time of overweight and obesity, four groups were considered based on the change in the BMI (pooling the WHO categories normal weight with underweight, and overweight with obesity) from 6 to 14 years of age:
Group 1: underweight or normal weight children at 6 years and 14 years of age.
Group 2: overweight or obese children at 6 years of age, but underweight or normal weight at 14 years of age.
Group 3: underweight or normal weight children at 6 years of age, but overweight or obese at 14 years of age.
Group 4: overweight or obese children at 6 and 14 years of age.
An analysis was made of how these four groups varied according to different variables that may be related to overweight and obesity. The clinical history provided information regarding the environment in which the children lived, the type of delivery and maturity, breastfeeding, and its duration. The anamnesis recorded the BMI of the parents, the age of menarche in girls, and hours and quality of sleep.
Data analysis was performed using the SAS, SPSS, and Epidat statistical packages.
ResultsPrevalence of overweight and obesityThe final study sample consisted of 326 boys and girls (51.5% and 48.5%, respectively) aged 13–14 years, with a mean age of 13.88 years (SD: 0.25). Seventy-three percent lived in an urban setting. Most of them were children of Spanish parents, and only 8.8% had one or both parents of foreign origin.
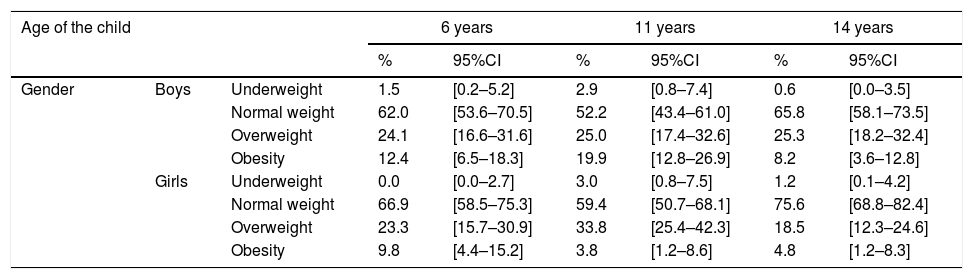
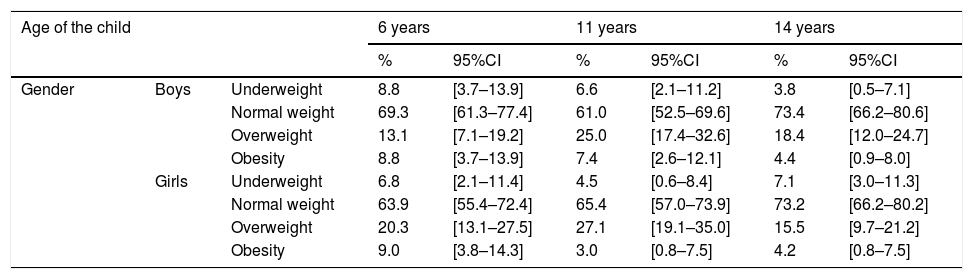
Table 1 shows the prevalences of the different weight categories according to the WHO cut-off points, by gender and age. Table 2 in turn shows these same results according to the cut-off points of the IOTF.
Prevalence of the different WHO weight categories according to gender and age.
| Age of the child | 6 years | 11 years | 14 years | |||||
|---|---|---|---|---|---|---|---|---|
| % | 95%CI | % | 95%CI | % | 95%CI | |||
| Gender | Boys | Underweight | 1.5 | [0.2–5.2] | 2.9 | [0.8–7.4] | 0.6 | [0.0–3.5] |
| Normal weight | 62.0 | [53.6–70.5] | 52.2 | [43.4–61.0] | 65.8 | [58.1–73.5] | ||
| Overweight | 24.1 | [16.6–31.6] | 25.0 | [17.4–32.6] | 25.3 | [18.2–32.4] | ||
| Obesity | 12.4 | [6.5–18.3] | 19.9 | [12.8–26.9] | 8.2 | [3.6–12.8] | ||
| Girls | Underweight | 0.0 | [0.0–2.7] | 3.0 | [0.8–7.5] | 1.2 | [0.1–4.2] | |
| Normal weight | 66.9 | [58.5–75.3] | 59.4 | [50.7–68.1] | 75.6 | [68.8–82.4] | ||
| Overweight | 23.3 | [15.7–30.9] | 33.8 | [25.4–42.3] | 18.5 | [12.3–24.6] | ||
| Obesity | 9.8 | [4.4–15.2] | 3.8 | [1.2–8.6] | 4.8 | [1.2–8.3] | ||
Prevalence of the different IOTF weight categories according to gender and age.
| Age of the child | 6 years | 11 years | 14 years | |||||
|---|---|---|---|---|---|---|---|---|
| % | 95%CI | % | 95%CI | % | 95%CI | |||
| Gender | Boys | Underweight | 8.8 | [3.7–13.9] | 6.6 | [2.1–11.2] | 3.8 | [0.5–7.1] |
| Normal weight | 69.3 | [61.3–77.4] | 61.0 | [52.5–69.6] | 73.4 | [66.2–80.6] | ||
| Overweight | 13.1 | [7.1–19.2] | 25.0 | [17.4–32.6] | 18.4 | [12.0–24.7] | ||
| Obesity | 8.8 | [3.7–13.9] | 7.4 | [2.6–12.1] | 4.4 | [0.9–8.0] | ||
| Girls | Underweight | 6.8 | [2.1–11.4] | 4.5 | [0.6–8.4] | 7.1 | [3.0–11.3] | |
| Normal weight | 63.9 | [55.4–72.4] | 65.4 | [57.0–73.9] | 73.2 | [66.2–80.2] | ||
| Overweight | 20.3 | [13.1–27.5] | 27.1 | [19.1–35.0] | 15.5 | [9.7–21.2] | ||
| Obesity | 9.0 | [3.8–14.3] | 3.0 | [0.8–7.5] | 4.2 | [0.8–7.5] | ||
As reflected in Table 1, and based on the WHO references, at 14 years 25.3% of the boys were overweight, versus 18.5% of the girls. On applying the IOTF criteria (Table 2), the prevalence of overweight decreased several percentage points to 18.4% in boys and 15.5% in girls (i.e., the decrease was more pronounced among the males).
Obesity in turn was recorded in 8.2% of the boys and 4.8% of the girls according to the WHO criteria. These prevalences of obesity were again lower using the IOTF cut-off points, particularly in boys, where the prevalence of obesity was seen to be 4.4%. In the case of the girls, the IOTF-based prevalence of obesity was 4.2%, i.e., similar to the percentage according to the WHO criteria.
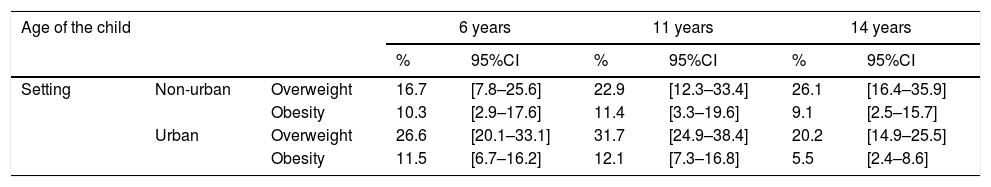
Table 3 describes the variation with age of the prevalences referring to overweight and obesity using the WHO cut-off points according to the setting (urban or non-urban) in which the boys and girls lived. In the urban setting, both overweight and obesity decreased with age, the prevalence being lower at 14 years than at 6 years. By contrast, in the non-urban setting the prevalence of overweight increased during this period (16.7% at 6 years and 26.1% at 14 years), while obesity remained relatively constant.
Prevalence of overweight and obesity in the urban and non-urban settings according to the WHO cut-off points.
| Age of the child | 6 years | 11 years | 14 years | |||||
|---|---|---|---|---|---|---|---|---|
| % | 95%CI | % | 95%CI | % | 95%CI | |||
| Setting | Non-urban | Overweight | 16.7 | [7.8–25.6] | 22.9 | [12.3–33.4] | 26.1 | [16.4–35.9] |
| Obesity | 10.3 | [2.9–17.6] | 11.4 | [3.3–19.6] | 9.1 | [2.5–15.7] | ||
| Urban | Overweight | 26.6 | [20.1–33.1] | 31.7 | [24.9–38.4] | 20.2 | [14.9–25.5] | |
| Obesity | 11.5 | [6.7–16.2] | 12.1 | [7.3–16.8] | 5.5 | [2.4–8.6] | ||
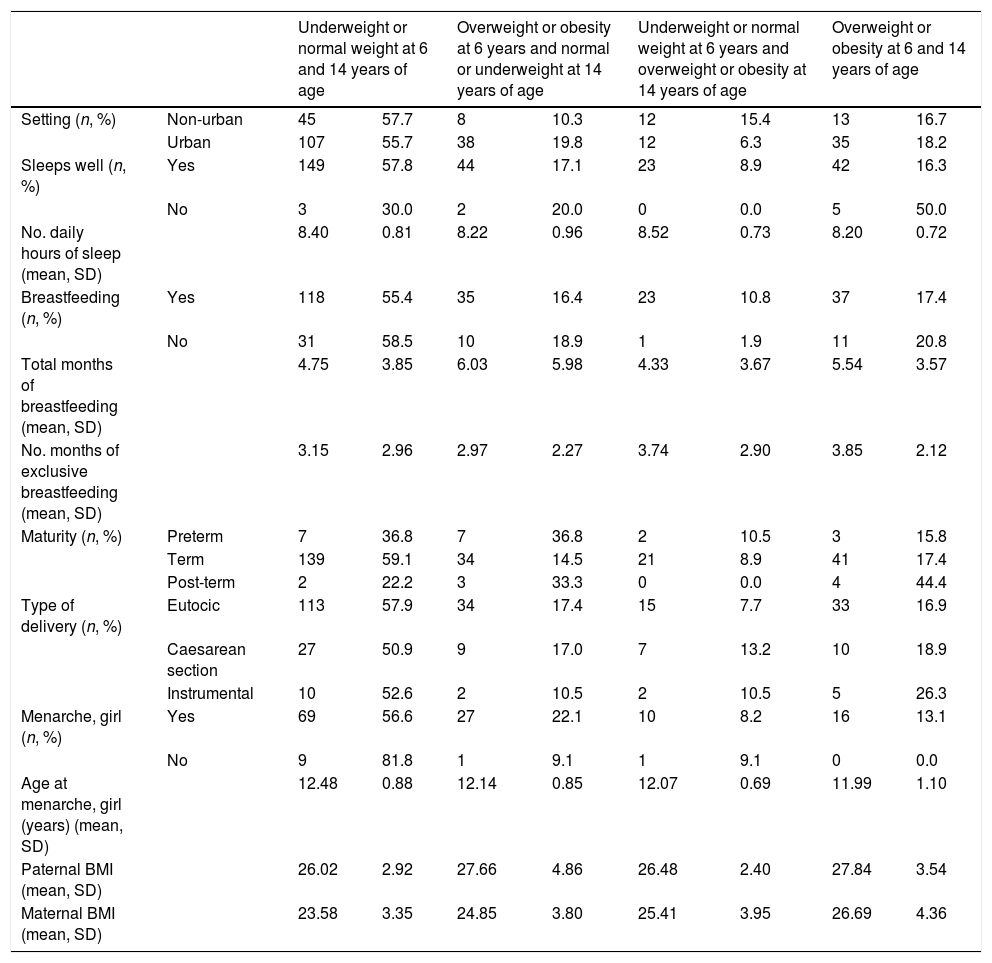
With regard to the evolution of overweight and obesity (Table 4), the children living in an urban setting were seen to experience a decrease in their weight category (19.8% shifted from overweight or obesity to normal weight or underweight, as compared to 10.3% of those living in a non-urban setting). By contrast, in the non-urban setting, 15.4% shifted from underweight or normal weight to overweight or obesity, a situation that only occurred in 6.3% of those living in an urban setting.
Evolution over time of the BMI category of the children according to habits and history.
| Underweight or normal weight at 6 and 14 years of age | Overweight or obesity at 6 years and normal or underweight at 14 years of age | Underweight or normal weight at 6 years and overweight or obesity at 14 years of age | Overweight or obesity at 6 and 14 years of age | ||||||
|---|---|---|---|---|---|---|---|---|---|
| Setting (n, %) | Non-urban | 45 | 57.7 | 8 | 10.3 | 12 | 15.4 | 13 | 16.7 |
| Urban | 107 | 55.7 | 38 | 19.8 | 12 | 6.3 | 35 | 18.2 | |
| Sleeps well (n, %) | Yes | 149 | 57.8 | 44 | 17.1 | 23 | 8.9 | 42 | 16.3 |
| No | 3 | 30.0 | 2 | 20.0 | 0 | 0.0 | 5 | 50.0 | |
| No. daily hours of sleep (mean, SD) | 8.40 | 0.81 | 8.22 | 0.96 | 8.52 | 0.73 | 8.20 | 0.72 | |
| Breastfeeding (n, %) | Yes | 118 | 55.4 | 35 | 16.4 | 23 | 10.8 | 37 | 17.4 |
| No | 31 | 58.5 | 10 | 18.9 | 1 | 1.9 | 11 | 20.8 | |
| Total months of breastfeeding (mean, SD) | 4.75 | 3.85 | 6.03 | 5.98 | 4.33 | 3.67 | 5.54 | 3.57 | |
| No. months of exclusive breastfeeding (mean, SD) | 3.15 | 2.96 | 2.97 | 2.27 | 3.74 | 2.90 | 3.85 | 2.12 | |
| Maturity (n, %) | Preterm | 7 | 36.8 | 7 | 36.8 | 2 | 10.5 | 3 | 15.8 |
| Term | 139 | 59.1 | 34 | 14.5 | 21 | 8.9 | 41 | 17.4 | |
| Post-term | 2 | 22.2 | 3 | 33.3 | 0 | 0.0 | 4 | 44.4 | |
| Type of delivery (n, %) | Eutocic | 113 | 57.9 | 34 | 17.4 | 15 | 7.7 | 33 | 16.9 |
| Caesarean section | 27 | 50.9 | 9 | 17.0 | 7 | 13.2 | 10 | 18.9 | |
| Instrumental | 10 | 52.6 | 2 | 10.5 | 2 | 10.5 | 5 | 26.3 | |
| Menarche, girl (n, %) | Yes | 69 | 56.6 | 27 | 22.1 | 10 | 8.2 | 16 | 13.1 |
| No | 9 | 81.8 | 1 | 9.1 | 1 | 9.1 | 0 | 0.0 | |
| Age at menarche, girl (years) (mean, SD) | 12.48 | 0.88 | 12.14 | 0.85 | 12.07 | 0.69 | 11.99 | 1.10 | |
| Paternal BMI (mean, SD) | 26.02 | 2.92 | 27.66 | 4.86 | 26.48 | 2.40 | 27.84 | 3.54 | |
| Maternal BMI (mean, SD) | 23.58 | 3.35 | 24.85 | 3.80 | 25.41 | 3.95 | 26.69 | 4.36 | |
With regard to sleep, 57.8% of the boys and girls that slept well remained stable in the underweight-normal weight category, while 50.0% of those that slept poorly were overweight or obese at both 6 and 14 years of age. In addition, those who slept more than 8.52h on average were the subjects that experienced an increase in their BMI.
The duration of breastfeeding (either exclusive or mixed) was longer in the children with overweight and obesity at 6 years of age and who normalized their weight at age 14 (mean: 6.03 months; SD: 5.98). By contrast, the children that shifted from normal weight at 6 years of age to overweight or obesity at age 14 showed the shortest duration of breastfeeding (mean: 4.33 months; SD: 3.67). Exclusive breastfeeding showed a different pattern, with a longer duration among the children that were overweight or obese at 14 years of age and among the children that increased their body weight between 6 and 14 years of age.
As regards delivery, the children in groups 3 and 4, with overweight or obesity at 14 years of age, showed higher percentages of caesarean section or instrumental delivery as compared to the other two groups, though the differences were not significant (p=0.98, 0.19 and 0.37 in groups 2, 3 and 4). The children in group 3 also showed a higher proportion of preterm deliveries, though without reaching statistical significance (p=0.44), while those in group 4 showed a significantly higher proportion of post-term deliveries (p=0.03).
At the time of the study, 91.7% of the girls in the study had reached menarche. Of the 11 girls who had not yet reached menarche at 14 years of age, 81.8% were underweight or had normal weight at both 6 and 11 years of age. Although an advance was seen in the age of menarche in overweight or obese girls as compared to those with normal weight, the differences among the four groups were not significant (p=0.14, 0.29 and 0.11 for groups 2, 3 and 4, respectively).
The boys and girls with sustained overweight or obesity were the offspring of fathers and/or mothers with higher mean BMI values (27.84kg/m2 in the father and 26.69kg/m2 in the mother). Group 2 was the only group that proved statistically significant for the BMI of the father (p=0.02), while groups 3 and 4 were statistically significant for the BMI of the mother (p=0.04 and 0.01, respectively). The mean paternal BMI was in the overweight category, while the maternal BMI category was more similar to that of the children.17
DiscussionChildhood overweight and obesity affects approximately one in every three boys and one in every four girls aged 14 years in Castilla y León, according to the WHO criteria. The population living in a rural setting appears to exhibit a poorer evolution over time. In addition to the place of residency, the tendency toward increased overweight and obesity is related to the type of delivery and nursing, sleeping habits, and the occurrence of menarche in girls.
Our findings regarding overweight and obesity at 6 years of age according to gender are similar to those of the Spanish nationwide ALADINO study.7 Comparing other Autonomous Communities, Galicia13 reported prevalences higher than those found in Castilla y León, with overweight and obesity rates of 29.9% and 7.2%, respectively, at 11 years of age (based on the IOTF references). The Canary Islands reported even higher figures.6 By contrast, the Balearic Islands,3 reported a higher prevalence of obesity in both boys and girls. With regard to the wider European setting, it should be noted that a French population study18 estimated prevalences of obesity (according to the IOTF cut-off points) lower than those found in our study at 6 and 11 years of age (3.1% and 3.7%, respectively), though at 14 years of age the results were similar to those recorded in Castilla y León.
With regard to the changes in weight category over time based on age, the prevalence of overweight in girls and of obesity in boys has been seen to reach a peak at 11 years of age. Prepubertal age has been regarded as a risk factor for the development of obesity in children and adolescents.19
In the urban setting, overweight and obesity are less prevalent at 14 years of age, while in the non-urban setting overweight increases and obesity remains relatively constant. This could be due to differences in habits related to the environment in which the children live. In this regard, there may be a more sedentary lifestyle at the time of puberty in the rural setting due to a lack of facilities. Likewise, socially accepted beauty standards may cause adolescents (particularly females) to want to lose weight.
The role of sleep as a risk factor for obesity has been clearly established.20,21 In our study, although the number of children reporting poor sleep was small compared to those who slept well, the former appeared to have a greater tendency toward overweight and obesity at both 6 and 14 years of age. This could suggest that poor quality of sleep affects excess weight, or that obesity causes poor quality of sleep. We also recorded a slight decrease in hours of sleep in those who were overweight or obese at 6 and 14 years of age.
Breastfeeding could play a relevant role in regulating overweight in children and adolescents. The data from this study reflect the positive influence of the total duration of nursing, though the results proved conflicting in the case of exclusive breastfeeding. A more complete data analysis would be needed to assess the true effect without interference from other variables such as the history of the child, maternal obesity, the socio-cultural level, etc.
Both the full-term and eutocic delivery infants showed the highest percentages of normal body weight. Pre- and/or postmaturity may be related to a greater frequency of dystocia and, consequently, to a greater number of instrumental deliveries and/or caesarean sections. Likewise, it could be postulated that dystocia leading to instrumental delivery or caesarean section may be due to disorders that affect newborn infant weight, such as low weight, which later turns into overweight.
An interesting observation regarding menarche is that most girls who had not yet reached menarche at 14 years of age presented normal weight at both 6 and 14 years of age. Mention also must be made of the advance in the age of menarche in girls with overweight or obesity. Neither pubertal development nor the date of menarche was taken into account in adjusting the BMI, a fact that may represent a limitation of our study. However, most studies use the WHO and IOTF tables, which do not include the above factors, thereby facilitating the comparison of our findings with those of other studies.
The parents were questioned verbally about the BMI, and this could also represent a source of bias. In any case, we found the children with overweight or obesity at both 6 and 14 years of age to be the offspring of fathers and/or mothers with a higher mean BMI. Of note is the observation that the BMI of children appears to be more related to maternal BMI than to paternal BMI. The mothers of children with sustained normal weight at 6 and 14 years of age had a mean BMI of 23.58 (normal weight for an adult), while the fathers had a mean BMI of 26.02 (corresponding to overweight).
The 20 pediatricians participating in the Health Sentinel Network represented the global group of primary care pediatricians of the Health Service of Castilla y León in 2011, and the population they attended was representative of the global pediatric population of this Autonomous Community, according to the original design of the network22 and the periodic validation studies made.23
Only those children that failed to keep their appointments could have introduced a bias in terms of representativeness, though their number was low. There were no age or gender differences in relation to the study sample, though other variables of a socioeconomic nature could not be compared.
This study provides estimates of overweight and obesity for the population of Castilla y León at 6, 11 and 14 years of age, and confirms that our situation is similar to that of other populations in our geographical setting, with a serious problem of overweight and obesity that appears to increase over time up to 11 years age and then decreases in early adolescence. While growth rate curves have not yet been established with the collected data, they will afford future reference values for comparing weight and height gain, and individual deviations. Some variables related to both weight gain and weight loss have been identified, and some hypotheses regarding this relationship should be explored in greater depth in order to define risk control profiles.
Financial supportNone declared.
Conflicts of interestNone declared.
Isabel Carramiñana-Martinez: Epidemiology Section, Servicio Territorial de Sanidad, Junta de Castilla y León, Burgos, Spain.
Rufino Álamo-Sanz: Dirección General de Salud Pública, Consejería de Sanidad, Junta de Castilla y León, Valladolid, Spain.
Carolina Varela-Rodriguez: Department of Preventive Medicine, Hospital General Universitario de Ciudad Real, Ciudad Real, Spain.
Ana Mateos-Cachorro: Centro Nacional de Investigación sobre la Evolución Humana (CENIEH), Burgos, Spain.
The names of the components of the Working Group for Research in Overweight, Obesity and Childhood Development in Castilla and León are listed in Annex.
Please cite this article as: Yáñez-Ortega JL, Arrieta-Cerdán E, Lozano-Alonso JE, Gil Costa M, Gutiérrez-Araus AM, Cordero-Guevara JA, et al. Prevalencia de sobrepeso y obesidad infantil. Estudio de una cohorte en Castilla y León, España. Endocrinol Diabetes Nutr. 2019;66:173–180.

articles