


Hyperuricemia is associated to cardiovascular disease. However, the contribution of uric acid (UA) to cardiovascular mortality in diabetic patients is controversial.
ObjectiveTo assess the impact of UA levels on the risk of cardiovascular mortality risk in a cohort of patients with type 2 diabetes mellitus (T2DM).
Patients and methodsA prospective cohort study on outpatients with T2DM. The clinical endpoint was cardiovascular death. Anthropometric, demographic, clinical, and biochemical variables were collected, including UA levels, urinary albumin excretion and estimated glomerular filtration rate. The independent contribution of UA levels to cardiovascular mortality was assessed using multivariate Cox regression models, progressively adjusted for potential confounders.
ResultsA total of 452 patients with a mean age of 65.9 (SD 9.5) years were enrolled. Mean UA level was 4.2mg/dl. Quartiles of UA levels were Q1<3.3; Q2: 3.3–4.2; Q3: 4.3–5.1; Q4>5.1mg/dl. UA levels significantly correlated with estimated glomerular filtration rate (Rho=−0.227; p<0.001). During a median follow-up time of 13 years, cardiovascular mortality rates were higher in Q4 of the UA distribution (Q1: 10.7; Q2: 11.7; Q3: 10.7; Q4: 21.6 per 1000 patient-years; p=0.027). UA was a predictor of cardiovascular mortality in the univariate analysis (HR1mg/dl=1.30; p=0.002), but not in a multivariate analysis adjusted for urinary albumin excretion and eGFR (HR1mg/dl=1.20; p=0.12).
Discussion and conclusionsHigh UA levels are associated to cardiovascular mortality in patients with T2DM. However, the role of UA may be mediated by impaired kidney function in patients with hyperuricemia.
La hiperuricemia se asocia a enfermedad cardiovascular. Sin embargo, la contribución del ácido úrico (AU) sobre la mortalidad cardiovascular (MCV) en pacientes diabéticos es controvertida.
ObjetivoEvaluar la contribución del AU al riesgo de MCV en pacientes con diabetes de tipo 2 (DM2).
Pacientes y métodosSe incluyó a pacientes con DM2 atendidos en consultas externas hospitalarias. Se recogieron variables demográficas, clínicas y bioquímicas, incluidos niveles de AU, excreción de albúmina urinaria y tasa de filtración glomerular (TFG). La contribución independiente del AU a la MCV se evaluó con modelos de regresión de Cox con ajuste progresivo para potenciales factores de confusión.
ResultadosSe incluyó a 452 pacientes con edad media de 65,9 años (DE 9,5). La media de AU fue de 4,2mg/dl y los cuartiles (Q) de AU fueron: Q1<3,3; Q2: 3,3–4,2; Q3: 4,3-5,1; Q4>5,1mg/dl. La correlación entre AU y TFG fue significativa (Rho = −0,227; p<0,001). Durante una mediana de 13 años de seguimiento las tasas de MCV fueron más elevadas en el Q4 de la distribución de AU (Q1: 10,7; Q2: 11,7; Q3: 10,7 y Q4: 21,6 por cada 1.000 pacientes/año; p=0,027). El AU fue un factor predictor de MCV en análisis univariante (HR1mg/dl=1,30; p=0,002), pero no en multivariante ajustado para la excreción de albúmina urinaria y TFG (HR1mg/dl=1,20; p= 0,12).
Discusión y conclusionesLos niveles de AU se asocian a incremento de MCV en pacientes con DM2. No obstante, la asociación puede no ser causal, sino mediada por la afectación de la función renal en los pacientes con hiperuricemia.
The presence of type 2 diabetes mellitus (DM2) increases cardiovascular risk and is considered a coronary risk equivalent.1 However, not all patients with DM2 have the same probability of experiencing vascular events,2 which makes it necessary to search for biomarkers that may help discriminate individual risk.
There is a firmly established causal relationship between hyperuricemia (HU) and the occurrence of gout and nephrolithiasis. The clinical guides therefore recommend the administration of drugs with the aim of securing uric acid (UA) levels <5mg/dl in patients with recurrent gout attacks or with gout associated with complications (tophi, chronic kidney disease [CKD], urolithiasis).3,4
A number of epidemiological studies have moreover found a relationship between UA and other diseases such as metabolic syndrome or insulin resistance syndrome (MS), DM2, cardiovascular disease and CKD. However, the causal role of UA in these disorders has not been conclusively demonstrated.5 In patients with DM2, the contribution of UA to the cardiovascular mortality (CVM) risk is subject to controversy, with some studies reporting an independent association,6 while others do not.7,8 The differences among the studies can be explained by the patient profiles involved and by the different adjustment variables entered in the regression models. Specifically, the main confounders may be the finding of MS and the presence of CKD, both being associated with HU and CVM.9,10
Of special importance is the presence of CKD, which increases UA by lowering its renal excretion, and also increases CVM risk as a result of both increased urinary albumin excretion (UAE) and a decreased glomerular filtration rate (GFR).11 Urinary albumin excretion and the GFR provide additive and independent information concerning patient vascular risk.12
The objectives of our study, based on the long-term follow-up of a cohort of patients with DM2, were as follows:
- 1.
To determine whether UA levels are associated with CVM risk in patients with DM2.
- 2.
To determine whether the eventual increase in cardiovascular risk associated with UA is mediated by the coexistence of MS findings or the presence of CKD.
A retrospective cohort study was carried out.
Study populationA total of 463 patients with DM2 attending the Endocrinology outpatient clinic of Alcañiz District Hospital (Spain) were selected in the period between 1 June 1994 and 1 June 1998. The hospital has a recruitment population of 70,000 inhabitants.
The inclusion criteria were: diabetes diagnosed according to the criteria of the World Health Organization (WHO) in force at that time13; age over 35 years at the diagnosis of DM2; and no insulin treatment for at least one year after the diagnosis of the disease. The exclusion criteria were: severe organic disease, pregnancy, uncontrolled hyperthyroidism or hypothyroidism, systemic corticosteroid therapy, and advanced phase renal failure (creatinine greater >3mg/dl). The study design was approved by the hospital and all patients gave their verbal consent before inclusion. Patients being treated with allopurinol (n=11) were excluded from the study.
Baseline examinationAn interview was conducted at the time of inclusion, recording age, gender, known disease duration, smoking (active smokers, ex-smokers and non-smokers), treatment for DM2 (oral hypoglycemic drugs or insulin), and any prevalent manifestation of vascular disease:
- •
Ischemic heart disease: a history of myocardial infarction, coronary revascularization, or clinical evidence of angina.
- •
Lower limb ischemia: a history of amputation of vascular origin, arterial revascularisation or clinical signs of claudication.
- •
Cerebrovascular disease: a history of stroke.
- •
Vascular disease: any manifestation of ischemic heart disease, lower limb ischemia, or cerebrovascular disease.
A physical examination recorded body weight and height (with the calculation of the body mass index [BMI], defined as weight in kg/squared height in meters), systolic blood pressure and diastolic blood pressure. Hypertension in turn was defined as systolic blood pressure >140mmHg or diastolic blood pressure >90mmHg, or patient treatment with hypotensive agents.
Laboratory methodsA venous blood sample was collected after overnight fasting (10h), with glycosylated hemoglobin (HbA1c), creatinine, total cholesterol, HDL-cholesterol, non-HDL-cholesterol (total cholesterol and HDL-cholesterol), triglycerides and UA being measured. A 24-h urine sample was collected and, after urinary tract infection was excluded, the UAE rate was determined and classified as follows: normal albuminuria (<30mg), microalbuminuria (30–300mg) or macroalbuminuria (>300mg). The biochemical measurements were made using a Shimadzu CL 7200 autoanalyzer. The HbA1c concentration was determined with a Cobas Mira Plus autoanalyzer (normal range 4.5–5.7%). Urinary albumin excretion was determined by means of an immunoturbidimetric method on a Cobas Integra 700 analyzer. Low density lipoprotein cholesterol was estimated using the Friedewald formula when triglyceride levels were <300mg/dl.
The GFR was calculated in ml/min/1.73m2 based on the CKD-EPI formula:
Females:
If creatinine ≤0.7mg/dl GFR=144×(creatinine/0.7)−0.329×(0.993)Age
If creatinine >0.7mg/dl GFR=144×(creatinine/0.7)−1.209×(0.993)Age
Males:
If creatinine ≤0.9mg/dl GFR=141×(creatinine/0.9)−0.411×(0.993)Age
If creatinine >0.9mg/dl GFR=141×(creatinine/0.9)−1.209×(0.993)Age
All patients were followed-up prospectively until death or until 1 August 2011. The causes of death were obtained from the hospital records or by contacting the primary care physician who signed the death certificate. Sudden deaths (i.e., those occurring unexpectedly within the first hour of symptoms onset), deaths due to coronary artery disease, and deaths due to stroke were regarded as cardiovascular fatalities. Myocardial infarction was defined as documentation in the clinical history of patient admission due to chest pain, with typical electrocardiographic changes or characteristic elevation and progressive lowering of CPK-MB or troponin I levels (the latter parameter being available at the hospital since February 2000). Stroke in turn was defined as a neurological deficit persisting for more than 24h. Vital status could not be ascertained in four patients (0.9%), and these individuals were considered lost to follow-up.
Statistical analysisQuantitative variables were reported as the mean and standard deviation (SD) or as the median and interquartile range (IQR), while qualitative variables were reported as percentages and frequencies. Quantitative variables were compared by analysis of variance (ANOVA) or using the nonparametric Kruskal–Wallis test. Qualitative variables were compared by means of the chi-squared test, with linear trend assessment in variables with ordered categories.
The degree of the linear association between UA and the GFR was assessed based on the Spearman correlation coefficient.
Cardiovascular mortality was regarded as the primary outcome variable. The main predictive factor analyzed was UA, expressed as a quantitative variable or as a qualitative variable coded into four categories (quartiles [Q]).
Patients were followed-up from inclusion to exit from the study (having reached the study closure date, due to death, or because of loss of contact). The CVM rates were expressed as deaths per 1000 patient-years. The comparison of rates between Q and UA was carried out by Kaplan–Meier analysis and the log-rank test.
Evaluation of the independent contribution of UA levels to CVM was based on the use of Cox regression models, with the estimation of hazard ratios (HRs) and their corresponding 95% confidence intervals (95%CIs). Uric acid was entered as a qualitative variable coded into four categories (Q). The linear component, assessed by orthogonal polynomials, proved significant (p=0.032); UA was therefore also entered in the models as a quantitative variable. Univariate and multivariate models were generated, with a gradual adjusting for variables as follows:
Model 1: age, gender and the presence of initial cardiovascular disease.
Model 2: model 1+smoking, high blood pressure, total cholesterol, HbA1c and time from DM onset.
Model 3: model 2+BMI, HDL-cholesterol and triglycerides.
Model 4: model 3+GFR and UAE.
Statistical significance was considered for p<0.05. The SPSS version 15.0 statistical package was used throughout.
ResultsA total of 452 patients were included: 178 of them males (39.4%), with a mean age of 65.9 years (SD 9.5) and a mean duration of DM2 of 10.4 years (SD 7.5). At inclusion, 191 patients were treated with insulin (42.4%) and 98 patients had prevalent vascular disease (21.7%).
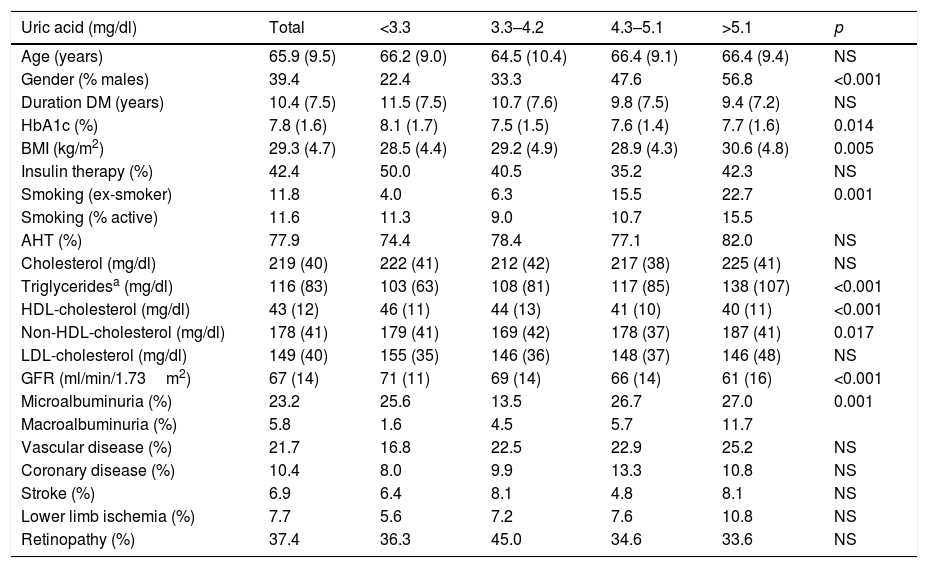
The mean UA concentration was 4.2mg/dl, with a median of 4.2mg/dl. The UA Q cut-off points were: Q1<3.3; Q2: 3.3–4.2; Q3: 4.3–5.1; Q4>5.1mg/dl. Table 1 describes the characteristics of the patients according to UA Q. The patients in the higher UA Q were characterized by a greater frequency of males, with a greater prevalence of smoking, better glycemic control, more characteristic features of MS (a higher BMI, higher triglyceride and non-HDL-cholesterol levels, and lower HDL-cholesterol levels), and poorer renal function (a lower GFR and a greater prevalence of albuminuria). Although there was a trend toward a higher initial prevalence of cardiovascular disease, statistical significance was not reached.
Patient characteristics according to the uric acid quartiles.
| Uric acid (mg/dl) | Total | <3.3 | 3.3–4.2 | 4.3–5.1 | >5.1 | p |
|---|---|---|---|---|---|---|
| Age (years) | 65.9 (9.5) | 66.2 (9.0) | 64.5 (10.4) | 66.4 (9.1) | 66.4 (9.4) | NS |
| Gender (% males) | 39.4 | 22.4 | 33.3 | 47.6 | 56.8 | <0.001 |
| Duration DM (years) | 10.4 (7.5) | 11.5 (7.5) | 10.7 (7.6) | 9.8 (7.5) | 9.4 (7.2) | NS |
| HbA1c (%) | 7.8 (1.6) | 8.1 (1.7) | 7.5 (1.5) | 7.6 (1.4) | 7.7 (1.6) | 0.014 |
| BMI (kg/m2) | 29.3 (4.7) | 28.5 (4.4) | 29.2 (4.9) | 28.9 (4.3) | 30.6 (4.8) | 0.005 |
| Insulin therapy (%) | 42.4 | 50.0 | 40.5 | 35.2 | 42.3 | NS |
| Smoking (ex-smoker) | 11.8 | 4.0 | 6.3 | 15.5 | 22.7 | 0.001 |
| Smoking (% active) | 11.6 | 11.3 | 9.0 | 10.7 | 15.5 | |
| AHT (%) | 77.9 | 74.4 | 78.4 | 77.1 | 82.0 | NS |
| Cholesterol (mg/dl) | 219 (40) | 222 (41) | 212 (42) | 217 (38) | 225 (41) | NS |
| Triglyceridesa (mg/dl) | 116 (83) | 103 (63) | 108 (81) | 117 (85) | 138 (107) | <0.001 |
| HDL-cholesterol (mg/dl) | 43 (12) | 46 (11) | 44 (13) | 41 (10) | 40 (11) | <0.001 |
| Non-HDL-cholesterol (mg/dl) | 178 (41) | 179 (41) | 169 (42) | 178 (37) | 187 (41) | 0.017 |
| LDL-cholesterol (mg/dl) | 149 (40) | 155 (35) | 146 (36) | 148 (37) | 146 (48) | NS |
| GFR (ml/min/1.73m2) | 67 (14) | 71 (11) | 69 (14) | 66 (14) | 61 (16) | <0.001 |
| Microalbuminuria (%) | 23.2 | 25.6 | 13.5 | 26.7 | 27.0 | 0.001 |
| Macroalbuminuria (%) | 5.8 | 1.6 | 4.5 | 5.7 | 11.7 | |
| Vascular disease (%) | 21.7 | 16.8 | 22.5 | 22.9 | 25.2 | NS |
| Coronary disease (%) | 10.4 | 8.0 | 9.9 | 13.3 | 10.8 | NS |
| Stroke (%) | 6.9 | 6.4 | 8.1 | 4.8 | 8.1 | NS |
| Lower limb ischemia (%) | 7.7 | 5.6 | 7.2 | 7.6 | 10.8 | NS |
| Retinopathy (%) | 37.4 | 36.3 | 45.0 | 34.6 | 33.6 | NS |
DM: diabetes mellitus; AHT: arterial hypertension; BMI: body mass index; GFR: glomerular filtration rate.
The correlation between UA and the GFR proved significant (Rho=−0.227; p<0.001) (Fig. 1).

Over a median of 13 years of follow-up, 70 cardiovascular deaths (13.4/1000) and 206 total deaths (39.3/1000) were recorded. The CVM rates were higher in Q4 of the UA distribution (Q1: 10.7; Q2: 11.7; Q3: 10.7; Q4: 21.6 per 1000 patients-year; p=0.027). Total mortality rates were also higher in Q4 of the UA distribution (Q1: 39; Q2: 29.3; Q3: 36.1; Q4: 55.4 per 1000 patients-year; p=0.003). The survival curves for CVM according to the different UA quartiles are shown in Fig. 2.

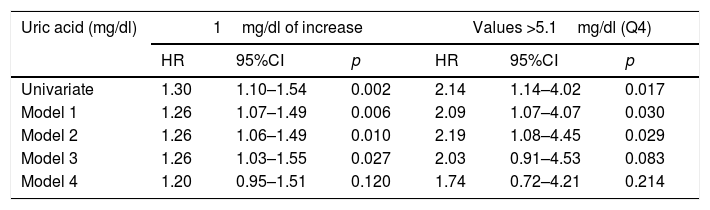
The univariate analysis identified a 30% increase in CVM risk for every 1mg/dl increase in UA levels (HR=1.30; 95%CI: 1.10–1.54; p=0.002), while UA>5.1mg/dl was seen to double the CVM risk (HR=2.14; 95%CI: 1.14–4.02; p=0.017). Table 2 shows the multivariate analysis with progressive adjustments in the successive models. Adjustment in model 4 for renal function parameters resulted in a clinically important attenuation of the CVM risk associated with UA levels, with a loss of statistical significance.
Cardiovascular mortality risk associated with uric acid levels, with progressive adjustment for confounding factors.
| Uric acid (mg/dl) | 1mg/dl of increase | Values >5.1mg/dl (Q4) | ||||
|---|---|---|---|---|---|---|
| HR | 95%CI | p | HR | 95%CI | p | |
| Univariate | 1.30 | 1.10–1.54 | 0.002 | 2.14 | 1.14–4.02 | 0.017 |
| Model 1 | 1.26 | 1.07–1.49 | 0.006 | 2.09 | 1.07–4.07 | 0.030 |
| Model 2 | 1.26 | 1.06–1.49 | 0.010 | 2.19 | 1.08–4.45 | 0.029 |
| Model 3 | 1.26 | 1.03–1.55 | 0.027 | 2.03 | 0.91–4.53 | 0.083 |
| Model 4 | 1.20 | 0.95–1.51 | 0.120 | 1.74 | 0.72–4.21 | 0.214 |
Model 1: Adjustment for age, gender and the presence of initial cardiovascular disease.
Model 2: Additional adjustment for classical risk factors and variables related to diabetes.
Model 3: Additional adjustment for variables related to metabolic syndrome.
Model 4: Additional adjustment for renal function parameters. Further information in the text (Material and Methods).
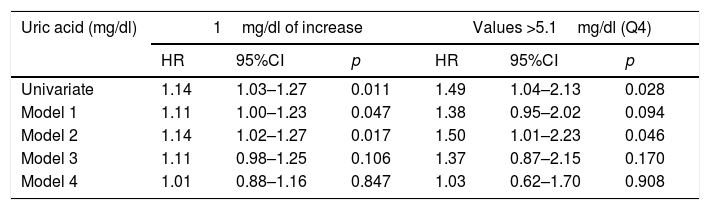
Table 3 shows the risk models for total mortality. The association between UA and total mortality proved weaker than the association with CVM. The risk conferred by UA levels disappeared entirely in the models that adjusted for the GFR and UAE.
Total mortality risk associated with uric acid levels, with progressive adjustment for confounding factors.
| Uric acid (mg/dl) | 1mg/dl of increase | Values >5.1mg/dl (Q4) | ||||
|---|---|---|---|---|---|---|
| HR | 95%CI | p | HR | 95%CI | p | |
| Univariate | 1.14 | 1.03–1.27 | 0.011 | 1.49 | 1.04–2.13 | 0.028 |
| Model 1 | 1.11 | 1.00–1.23 | 0.047 | 1.38 | 0.95–2.02 | 0.094 |
| Model 2 | 1.14 | 1.02–1.27 | 0.017 | 1.50 | 1.01–2.23 | 0.046 |
| Model 3 | 1.11 | 0.98–1.25 | 0.106 | 1.37 | 0.87–2.15 | 0.170 |
| Model 4 | 1.01 | 0.88–1.16 | 0.847 | 1.03 | 0.62–1.70 | 0.908 |
Model 1: Adjustment for age, gender and the presence of initial cardiovascular disease.
Model 2: Additional adjustment for classical risk factors and variables related to diabetes.
Model 3: Additional adjustment for variables related to metabolic syndrome.
Model 4: Additional adjustment for renal function parameters. Further information in the text (Material and Methods).
There were 36 patients with missing LDL-cholesterol data. Replacing total cholesterol with LDL-cholesterol did not result in any clinically relevant modification of the risk estimate conferred by UA in relation to either CVM risk or total mortality (data not shown).
DiscussionThis prospective follow-up over a median of 13 years of a cohort of patients with DM2 revealed high UA levels, indicating an increased CVM risk and, to a lesser extent, an increased total mortality risk. However, the effect was not independent, but appeared to be mediated, at least in part, by an association between high UA levels and altered renal function parameters.
The consideration of UA as a marker of cardiovascular disease is derived from observational studies in the general population that were started in the second half of the twentieth century. The NHANES I study (1971–1992) showed that for every 1mg/dl increase in UA, the CVM rate increased by 9% in men and 26% in women.14 However, in the Framingham study population, UA levels were not predictive of CVM risk after adjusting for other risk factors, especially diuretic treatment for arterial hypertension.15 In Mendelian randomization studies,16,17 genetic polymorphisms linked to elevated UA levels have been shown to correlate to higher blood pressure, the BMI, and triglyceride levels. After correcting for these pleiotropic effects, the causal relationship between UA and coronary disease failed to reach statistical significance. Uric acid therefore could be more a marker than a risk factor, when grouped with other established vascular risk factors, particularly findings defining MS and CKD.10
The coexistence of HU with MS findings has been firmly established. A recent meta-analysis of 11 prospective studies9 recorded a 30% increase in the risk of MS for every 1mg/dl rise in UA values. The mechanisms possibly mediating this association are bidirectional: insulin resistance decreases renal UA excretion, and HU induces insulin resistance by causing endothelial dysfunction, oxidative stress and inflammatory changes. However, HU does not appear to be a causal factor in the induction of DM2 in Mendelian randomization studies.18
Lastly, the intricate relationship between HU and CKD must be taken into account. Hypertensive subjects with HU and MS have a 5-fold increased risk of CKD.19 In a more recent analysis of the NHANES study20 a significant correlation was revealed between UA and the GFR of −0.29 (similar to the −0.23 correlation coefficient found in our cohort). Uric acid values above percentile 75 induced a 77% increase in CVM risk, which was attenuated (losing statistical significance) to 25% after adjusting for GFR and UAE. In our study the risk caused by UA Q4 was also attenuated in a clinically relevant manner (from 2.14 to 1.74), resulting in a loss of statistical significance after adjusting for GFR and UAE.
The findings in patients with DM2 reinforce the hypothesis that the presence of CKD may confound the causal association between UA and CVM. The Verona cohort6 included patients with DM2, and greater total and cardiovascular mortality was demonstrated in patients with HU. In this study, adjusting for the GFR and UAE resulted in a loss of significance of the association between HU and total mortality, but not of the association between HU and CVM. However, there were differences with respect to our study, since patients with prevalent cardiovascular disease were excluded, and the duration of follow-up was limited to 5 years. In the Fremantle cohort,7 involving a follow-up of over 10 years and without excluding subjects with initial cardiovascular disease (as in our study), the statistical significance of HU in predicting CVM and total mortality was found to be lost in a multivariate model adjusted for CKD.
The relationship between HU and CKD may also be bidirectional: UA excretion is compromised in the presence of a loss of glomerular filtration, and HU itself may favor the development of CKD due to oxidative stress and endothelial dysfunction, which promotes systemic and glomerular hypertension. In fact, there is evidence to suggest that UA reduction may slow the deterioration of renal function.21
Regarding the association between HU and CVM, the findings of our study suggest that UA and the GFR may reflect the same causal mechanisms for CVM, or that CKD is the mediator of increased CVM risk in patients with HU. The main strength of our study is that the patients could be followed-up for more than 10 years, with few losses, thus allowing for a reliable estimation of the CVM rates and reinforcing the internal validity of the study. We were also able to adjust for potential mediators of the relationship between UA and CVM, specifically findings of MS and CKD. With regard to the weaknesses of the study, mention must be made of the limited number of subjects involved; of the fact that only initial UA levels were available; and that patient recruitment was from hospital outpatient clinics, thus making extrapolation to the global population of patients with diabetes mellitus difficult. In addition, sudden deaths were considered to be of vascular origin, without necropsy confirmation, though the main cause of sudden death was cardiovascular disease.22
In conclusion, UA levels are associated with increased CVM and, to a lesser extent, with increased total mortality in patients with DM2. However, the association may not be of a causal nature, but could be mediated by the altered renal function in patients with HU. Interventional studies are needed23 to definitively clarify the potential causal role of UA in vascular risk.
Conflicts of interestNone declared.
Please cite this article as: Ilundain-González AI, Gimeno-Orna JA, Sáenz-Abad D, Pons-Dolset J, Cebollada-del Hoyo J, Lahoza-Pérez MC. Influencia de los niveles de ácido úrico sobre el riesgo de mortalidad cardiovascular a largo plazo en pacientes con diabetes de tipo 2. Endocrinol Diabetes Nutr. 2018;65:335–341.
