


Medical oncology inpatients are at a very high risk of malnutrition, and the presence of complications associated with malnutrition is significant in their evolution. It is necessary to have adequate tools in the diagnosis of malnutrition.
ObjectivesThis study is aimed to assess the nutritional status of cancer inpatients and compare the incidence of complications based on the nutritional diagnosis with different tools.
MethodsAn observational, longitudinal, and retrospective study was designed on 149 patients admitted to the Oncology Service who were requested nutritional and medical treatment between January 2014 and June 2017. Epidemiological, clinical, anthropometric, and nutritional data were collected. Nutritional status was assessed using the Mini Nutritional Assessment (MNA), the Malnutrition Universal Screening Tool (MUST), and the Global Leadership Initiative on Malnutrition (GLIM) criteria.
ResultsThe age of the patients was 61.61 (15.96) years. 67.8% of the patients were men. Most of the patients were in advanced tumor stages (stage III (15.3%); stage IV (77.1%)). The median of the MUST was 2 (0–3) (High risk: 83 (55.7%)). The median MNA was 17 (14–20) (poor nutritional status: 65 (43.6%); risk of malnutrition 71 (47.7%)). According to the GLIM criteria, 115 (77.2%) had malnutrition, and 97 (65.1%) had severe malnutrition. According to MNA, an increase in mortality was observed (MNA <17: 24.6% vs. MNA >17: 7.9%; pvalue <0.01). Multivariate analysis showed that poor nutritional status measured with MNA is related to an increased probability of mortality regardless of the stage of the disease and the patient’s age OR: 4.19 95% CI (1.41–12.47); p-value = 0.02.
ConclusionsMalnutrition among cancer patients in whom a nutritional assessment is requested during admission is very high. In hospitalized patients with oncological pathology, it was observed that malnutrition measured by MNA acts as a mortality risk factor.
El paciente oncológico hospitalizado tiene un riesgo de desnutrición muy elevado y la presencia de complicaciones asociadas a la desnutrición es muy importante en la evolución. Es necesario tener herramientas adecuadas en el diagnóstico de la desnutrición
ObjetivosLos objetivos del presente estudio son la valoración del estado nutricional en el paciente ingresado en plantas de oncología y la comparación de la incidencia de complicaciones en función del diagnóstico nutricional con distintas herramientas.
Material y métodosSe diseñó un estudio de tipo observacional, longitudinal y retrospectivo en 149 pacientes ingresados en el Servicio de Oncología en los que se solicitó tratamiento médico nutricional entre enero de 2014 y junio de 2017. Se recogieron datos epidemiológicos, clínicos, antropométricos y nutricionales. El estado nutricional se evalúo mediante el Mini Nutritional Assessment (MNA), el Malnutrition Universal Screening Tool (MUST) y los criterios del Global Leadership Initiative on Malnutrition (GLIM).
ResultadosLa edad de los pacientes fue 61,61 (15,96) años. El 67,8% de los pacientes eran hombres. La mayor parte de los pacientes se encontraban en estadios tumorales avanzados (estadio III (15,3%); estadio IV (77,1)%). La mediana del MUST fue de 2 (0–3) (Riesgo elevado: 83 (55,7%)). La mediana de MNA fue de 17 (14–20) (Mala situación nutricional: 65 (43,6%); riesgo de desnutrición 71 (47,7%). Según los criterios GLIM 115 (77,2%) presentaban desnutrición y 97 (65,1%) desnutrición severa. Se observó un aumento en la mortalidad al evaluar en función del MNA (MNA<17: 24,6% vs MNA> 17: 7,9%; p-valor < 0,01). El análisis multivariante mediante regresión logística mostró que la mala situación nutricional medida con MNA se relaciona con un aumento en la probabilidad de mortalidad de forma independiente al estadio de la enfermedad y a la edad del paciente OR 4,19IC 95% (1,41−12,47) p valor = 0,02.
ConclusionesLa desnutrición entre los pacientes oncológicos en los que se solicita valoración nutricional durante el ingreso es muy elevada. En el paciente con patología oncológica hospitalizado se observó que la desnutrición medida mediante MNA actúa como factor de riesgo independiente en la mortalidad.
The prevalence of cancer is increasingly high and it has a significant impact on patient quality of life. Patients with cancer of any type are at increased risk of malnutrition. Some 15–40% of patients with cancer have some degree of malnutrition at diagnosis. This condition worsens as the disease progresses, with 80% of patients in advanced stages becoming malnourished.1 The risk of malnutrition has also been shown to be high in patients with head and neck, gastrointestinal or lung tumours.2–5
These patients can require multiple hospital admissions depending on the treatment administered, disease progression and treatment complications. Admission is an added risk factor for malnutrition due to the metabolic stress it causes as well as the associated decrease in intake.6,7
Compared to patients with better nutritional status, malnutrition in cancer patients in general has been associated with a multitude of adverse consequences, including: more complications8; more frequent hospital admissions and longer stays9,10; poorer tolerance of aggressive treatments11; and lower survival rates.11,12 Early diagnosis and treatment of poor nutritional status can have a positive influence on the course of the disease. Identifying patients at risk and starting nutritional support can achieve nutritional goals, and has been associated with lowering both the rate of complications and the mean length of hospital stay.9,13
Weight loss is the most widely used indicator in detecting malnutrition in patients with cancer. However, simply identifying weight loss may not prompt measures that help prevent malnutrition. Screening strategies have been recommended for some years now to both detect malnutrition risk and start treatment early in order to prevent nutritional deterioration in these patients.14
With this in mind, the aim of this study was to determine the effects of nutritional status and nutritional support on hospitalized cancer patients. Our objectives were to assess nutritional status in patients on oncology wards in a tertiary level hospital, and compare the incidence of complications based on the nutritional diagnosis made with different tools.
MethodsStudy designThis was a longitudinal, observational, retrospective study. We selected a total of 149 cancer patients at nutritional risk.
The study was carried out in accordance with the standards set out in the Declaration of Helsinki, and a favourable opinion was obtained from the local Independent Ethics Committee for research with medicines (IECm) with code PI-17-804.
Study subjectsThe study was carried out on 149 patients with cancer, admitted to the Medical Oncology Department admissions ward of a tertiary hospital, who were referred to the Clinical Nutrition and Dietetics Unit for nutritional assessment. The study was conducted from January 2014 to June 2017.
VariablesWe collected data on the following variables:
- -
Epidemiological: gender, date of birth, date of admission, date of start of medical-nutritional therapy and date of discharge.
- -
Clinical: diagnosis on admission, oncological diagnosis, TNM classification, stage, complications during admission (respiratory, metabolic, nephrological, gastrointestinal and cardiac) and reason for end of admission (discharge, hospital transfer, death).
- -
Therapeutic: cancer treatment received, other treatments.
- -
Anthropometric: weight (kg), height (m); usual weight (kg).
- -
Nutritional:
- ◦
Intake assessment: an assessment of the patient's intake was conducted, questioning them at bedside about the percentage of consumption (25%–50%–75%–100%) of the prescribed diet according to the diet code.
- ◦
Nutritional requirements: estimated for each patient based on the Harris-Benedict equation with a correction factor of 1.5 associated with exacerbation of chronic disease. Protein requirements were estimated as between 1.2 and 1.5 g/kg per day depending on the patient’s clinical situation. These criteria were used according to the recommendations of the European Society for Clinical Nutrition and Metabolism (ESPEN) clinical guidelines for cancer patients.7
- ◦
Malnutrition Universal Screening Tool (MUST): when a patient could not be weighed, their weight was estimated using MUST, which is designed to detect malnutrition or risk of malnutrition using three criteria: body mass index (BMI); unintentional weight loss; and acute illness which causes a decrease in intake.15
- ◦
Mini Nutritional Assessment (MNA): this is a questionnaire validated in the older adult population, whether institutionalised or not, consisting of a total of 18 questions split into two parts: six for screening and 12 for assessment. If the patient scores 11 or less on the first part of the screening, all 12 assessment questions should be completed. The questions refer to intake, anthropometric data, general assessment and subjective assessment by the patients themselves. They were classified as malnourished if they scored <17, at risk of malnutrition if they scored 17–23.5, and having normal nutritional status if they scored 24–30.16
- ◦
Global Leadership Initiative on Malnutrition (GLIM): this was used for the diagnosis of malnutrition,17 using the appendicular skeletal muscle index (ASMI), estimated from calf circumference (CC), as a variable to assess muscle deterioration: 10.427 + (CC in cm × 0.768) + (age in years × 0.029) + (gender × 7.523)/(height in cm × height in cm)
- ◦
This formula was developed using data from the NHANES study from 1999 to 2006.18
- ◦
Medical nutritional therapy used during admission: artificial oral supplementation, complete enteral nutrition by tube, parenteral nutrition; route of administration of nutrition at admission, route of administration of nutrition at discharge; diet prescribed on admission (consumption of oral diet).
- ◦
The data were stored in a database of the statistical software SPSS 15.0 (SPSS Inc. Il, USA) officially licensed by the University of Valladolid. The normality of the continuous variables was analysed using the Kolmogorov–Smirnov test.
Continuous variables are expressed as the mean (standard deviation) and non-continuous variables as the median (p25-p75). Parametric variables were analysed with the unpaired and paired Student's t test, and non-parametric variables with the Friedman, Wilcoxon, Kruskal–Wallis and Mann–Whitney U tests.
A logistic regression was calculated to assess the influence of malnutrition as an independent variable on complications (dependent variable).
Qualitative variables were expressed as percentages (%) and analysed using the χ2 test (with Fisher and Yates corrections when necessary). A p value less than 0.05 was considered significant.
ResultsDescriptionThe mean age of the patients was 61.61 years (15.96); 46 patients (30.8%) were over 70 and 103 patients (69.1%) were under. In the sample as a whole, 67.8% of the patients were male. The underlying disease was lung cancer (20.1%), gynaecological cancer (18.1%), cancer of the upper gastrointestinal tract (17.4%), head and neck (14.1%) or lower gastrointestinal tract (12.1%), adenocarcinoma of the pancreas (7.4%) or urological (5.4%) and other cancers (5.4%).
In terms of cancer stage, four patients (3%) had stage i cancer, six patients (4.6%) stage ii, 20 (15.3%) stage iii and 101 (77.1%) stage iv.
Mean length of hospital stay was 12 days (7–19), with 33.9% of the patients hospitalized for more than 15 days, and the delay in referral to the nutrition department was four days (1–9).
In terms of the therapeutic techniques, 64 (56.8%) of these patients had undergone surgery, 128 (85.9%) were receiving active chemotherapy at the time of admission, and 58 (38.9%) were receiving (or had received) radiotherapy.
Mean BMI was 22.65 kg/m2 (4.64); with weight loss of 12.58% (6.67–18.93). The mean estimated ASMI was 5.78 kg/m2 (1.51) (males: 6.43 kg/m2 [1.33] and females: 4.49 kg/m2 [0.92]).
The risk of malnutrition was calculated using the MUST; the median was 2 (0–3). According to this scale, 35 patients (23.5%) were at low risk, 18 (12.1%) moderate risk and 83 (55.7%) high risk.
Malnutrition was diagnosed using the MNA. The median score was 17 (14–20). Distributing according to the development of malnutrition on this scale, five patients (3.4%) had good nutritional status, 71 (47.7%) were at risk of malnutrition and 65 (43.6%) had poor nutritional status. Stratifying nutritional status according to cancer stage, lower values were found in more advanced stages of cancer in both the MUST and the MNA (Fig. 1).
 and Malnutrition Universal Screening Tool (MUST) according to cancer stage.")
As the MNA is a tool validated primarily in older adult patients, the malnutrition rate according to this test was calculated based on age. In patients over 70 years of age, 51.1% were at risk of malnutrition, and 48.9% had poor nutritional status; while in patients under 70 years of age, 5.4% had good nutritional status, 48.9% were at risk of malnutrition and 45.7% had poor nutritional status.
According to the GLIM criteria, 115 of the patients (77.2%) had some degree of malnutrition. Applying the severity criteria, 97 patients (65.1%) had severe malnutrition, with a higher rate of severe malnutrition measured by GLIM in more advanced stages of cancer (Fig. 2).
 diagnosis of malnutrition and its severity based on cancer stage.")
Analysis of the intake assessment in patients admitted with cancer showed a median consumption of 57% (26.69) of the total prescribed diet. The calorie content of the prescribed diet exceeded the patient's requirements by 9.05% (+35.36–[−9.9]). The calorie content of the diet consumed was below the patient's requirements (−34.98%; −7.8–[−59.38]). Fig. 3 shows the intake assessment according to nutritional status measured by the MNA.
.")
Medical nutritional therapy through artificial nutrition was prescribed in 148 patients: 133 patients (89.3%) had artificial oral supplementation; 11 (7.5%) had complete enteral nutrition by tube; and four (2.7%) had parenteral nutrition.
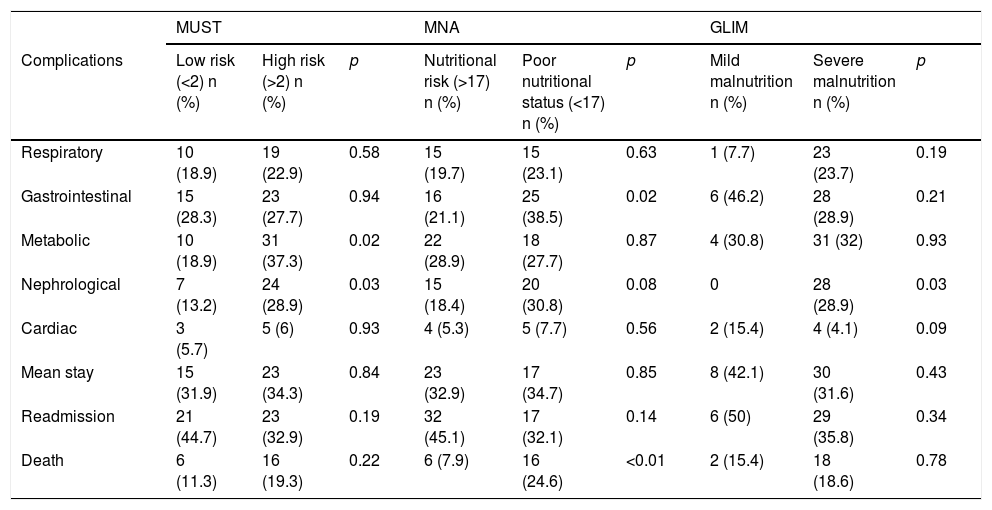
Influence of nutritional status on admission complicationsNo differences were found in patients' mean length of stay between the different tests used: MNA (malnutrition: 12 days5,8–18; risk of malnutrition: 117–22; p = 0.93); MUST (high risk of malnutrition: 12 days7–19; low risk of malnutrition: 128–17; p = 0.79) and GLIM (severe malnutrition: 11 days7,9–18; mild malnutrition: 12 days5,9–17; p = 0.82). There were also no differences between patients in hospital for longer than or less than 15 days (Table 1).
Comparison of complications according to nutritional status measured with MUST, MNA and GLIM criteria.
| MUST | MNA | GLIM | |||||||
|---|---|---|---|---|---|---|---|---|---|
| Complications | Low risk (<2) n (%) | High risk (>2) n (%) | p | Nutritional risk (>17) n (%) | Poor nutritional status (<17) n (%) | p | Mild malnutrition n (%) | Severe malnutrition n (%) | p |
| Respiratory | 10 (18.9) | 19 (22.9) | 0.58 | 15 (19.7) | 15 (23.1) | 0.63 | 1 (7.7) | 23 (23.7) | 0.19 |
| Gastrointestinal | 15 (28.3) | 23 (27.7) | 0.94 | 16 (21.1) | 25 (38.5) | 0.02 | 6 (46.2) | 28 (28.9) | 0.21 |
| Metabolic | 10 (18.9) | 31 (37.3) | 0.02 | 22 (28.9) | 18 (27.7) | 0.87 | 4 (30.8) | 31 (32) | 0.93 |
| Nephrological | 7 (13.2) | 24 (28.9) | 0.03 | 15 (18.4) | 20 (30.8) | 0.08 | 0 | 28 (28.9) | 0.03 |
| Cardiac | 3 (5.7) | 5 (6) | 0.93 | 4 (5.3) | 5 (7.7) | 0.56 | 2 (15.4) | 4 (4.1) | 0.09 |
| Mean stay | 15 (31.9) | 23 (34.3) | 0.84 | 23 (32.9) | 17 (34.7) | 0.85 | 8 (42.1) | 30 (31.6) | 0.43 |
| Readmission | 21 (44.7) | 23 (32.9) | 0.19 | 32 (45.1) | 17 (32.1) | 0.14 | 6 (50) | 29 (35.8) | 0.34 |
| Death | 6 (11.3) | 16 (19.3) | 0.22 | 6 (7.9) | 16 (24.6) | <0.01 | 2 (15.4) | 18 (18.6) | 0.78 |
There was a higher rate of metabolic and nephrological complications based on the nutritional risk measured using MUST (Table 1).
An increase in the mortality rate during admission was found in patients with the worst nutritional status assessed by MNA. There was an increase in gastrointestinal complications in patients with lower MNA scores (Table 1).
When using the GLIM severity criteria, the only difference was in nephrological complications (Table 1).
Multivariate analysisMultivariate analysis using logistic regression adjusted for age and cancer stage showed that a worse nutritional status measured by the MNA was associated with an increased risk of death (OR = 4.19; 1.41–12.47; p = 0.01). This relationship was not found when measuring nutritional status with MUST (OR = 1.87; 0.66–5.24; p = 0.24) or using the GLIM criteria (OR = 1.01; 0.19–5.25).
Analysing complications by multivariate analysis showed that a worse nutritional status measured by MUST, adjusting for age and cancer stage, was associated with higher rates of metabolic complications (OR = 2.72; 1.12–6.60; p = 0.03) and nephrological complications (OR = 2.61; 1.01–6.78; p <0.05).
The multivariate analysis was stratified by age, revealing an increased risk of death in patients over 70 with MNA showing poor nutritional status (OR = 14.21; 1.46–138.41; p = 0.02); this association was not found in patients under 70 (OR = 2.26; 0.61–8.42; p = 0.22). This increased risk was not found when analysing GLIM or MUST.
DiscussionThis study found that poor nutritional status in patients with cancer acts as an independent risk factor for death after adjusting for age and cancer stage.
When analysing the nutritional status of our patients, 44.6% of those admitted to the Oncology Department had some degree of malnutrition. In the study carried out by Calleja et al., the prevalence of malnutrition was 47.7%, a figure similar to ours, although they used the Subjective Global Assessment as their nutritional assessment method.6 Hebuterne et al. found the prevalence of malnutrition to be 30.9% in hospitalized cancer patients, but they used BMI to assess nutritional status.5 In the study by Villar-Taibo et al., in patients admitted with haematological malignancies, 37.8% screened positive for malnutrition using MUST, compared to our figure of 39%.19 Considering all of the above, we can conclude that the prevalence of malnutrition in the patients admitted to our hospital is similar to that of previous studies that used integrated nutritional assessment tools.
We found a high prevalence of malnutrition among the patients with cancer in our sample when analysing malnutrition diagnosis using the GLIM criteria. Our figure of 67.8% is higher than that of other series, such as that of Gascón-Ruiz et al., who reported 46.7% of patients with malnutrition; the difference may be explained by patient selection, as our patients were referred for a hospital nutritional assessment and had greater deterioration in nutritional status, compared to a sample taken from all cancer patients attending a medical oncology clinic.20,21 Probably due to the high sensitivity of the GLIM criteria in the detection of malnutrition in more selected samples, such as ours, they are less effective in differentiating the prognosis of complications. Moreover, the difficulty categorising muscle mass status with the GLIM criteria may mean the rating of the severity factor is different. In our study, we used calf circumference to estimate the ASMI with a formula generated from the NHANES study.18 This formula may generate errors, such as underestimation of muscle deterioration in patients with impaired fluid balance. However, the determination of muscle mass on the hospital ward at the time of writing this article was not so developed within the new paradigm of morphofunctional assessment; therefore, the use of estimated equations based on the elements at our disposal was better than not considering this parameter in the diagnosis.
Malnutrition as an independent mortality risk factor has been reported in numerous studies.10,12,22 However, in most BMI is used as an indicator of the patients' nutritional status. The lack of international consensus when it comes to defining a single indicator for patients' nutritional status makes it difficult to compare different studies. The possibility of using different nutritional assessment tools (malnutrition assessment test, body composition determination measures, muscle function determination tests) within the new paradigm of morphofunctional assessment23 may complete the information provided by BMI. The use of these tools can also help us to better categorise the mortality risk based on the deterioration of nutritional status, as shown when using the MNA in our study.
In the other complications, there were no significant differences between the patients with the worst nutritional status and the patients with nutritional risk, except in metabolic complications (dysnatraemia, dyskalaemia and dysglycaemia) and nephrological complications (acute kidney injury), possibly related to an altered state of hydration. In the study by Hongming et al., with 2,248 cancer patients, no significant differences were detected in the complications of patients with the worst nutritional status after adjusting the results according to age, gender, cancer stage and treatment received.24 In a study carried out at the Complejo Asistencial Universitario de León [León University Healthcare Complex], no significant differences were found in the development of metabolic, mechanical or infectious complications.6 The failure to detect differences in terms of complications may be due to the variability in the disease course in different patients.
A review of the scientific literature on the benefits of nutritional support in patients with cancer shows no clear consensus on its clinical importance in the different clinical guidelines.7 Although there does seem to be a consensus that intervention with individualised nutritional support can lead to clinical improvements and improve patient quality of life, it is not clear whether it reduces mortality rates or the incidence of complications.25–27 A possible explanation for this is the low number of cancer patients who are properly screened for nutritional risk, as highlighted by the Geiker et al., study, in which only 8% of patients with cancer had an adequate, correctly performed nutritional assessment.28 In our study, only 6.1% of the patients had previously undergone nutritional monitoring. Although it is true that there are many factors involved in monitoring a patient's nutrition, one factor to consider when evaluating the lack of international consensus on the utility of prior nutritional monitoring is perhaps the loss of candidate patients due to deficient screening of their nutritional status.
Patient age is another factor to add to the nutritional situation; the mean age was around 60 years, but 31% of the patients were over 70. There was a higher risk of death in those over 70 with malnutrition determined by the MNA, which is a validated tool in this age group.29 In fact, the MNA was less effective in predicting the risk of death in those under 70 years of age. The MNA has been used to assess the risk of complications from cancer treatment in older adult patients and has shown an association between poor nutritional status and a higher degree of vulnerability.30
The length of patient stay on the oncology ward, 11.5 days (7–19.75), is similar to that found by studies conducted in Spanish hospitals: 12.1 days in malnourished patients in a sub-analysis of the PREDyCES study9; and in the study on cancer patients at the Complejo Asistencial Universitario de León, 8.6 days in malnourished patients and 7.7 days in non-malnourished patients, with no statistically significant differences.6 In this same healthcare complex, the mean length of stay of patients with haematological malignancies was 11.5 days.19 However, in this study, patients who were in the terminal phase of their disease, which may involve longer hospital stays, were excluded. In summary, patients' length of stay on the oncology ward is similar to that reported by other studies.
The main strength of this study is that it highlights the importance of the nutritional situation at admission and its influence on mortality rates in cancer patients. Being aware of this will enable us to apply more sensitive screening techniques to diagnose nutritional risk more accurately and begin personalised nutritional therapy earlier.
The limitations of this study are related to its retrospective nature (loss of variables), as well as to the low number of patients with prior nutritional monitoring. In relation to the disease course, one limitation was the higher number of patients in advanced stages of cancer (III and IV) than in early stages (I and II), in addition to the lack of objectivity in defining a complication in a patient's disease course, as there is often no consensus on the clinical or biochemical values or results of other tests that might define it as such, the criteria being arbitrary in most cases. On the other hand, the long recruitment period may have contributed to the fact that there were patients with different profiles, in view of the variability of cancer. Finally, because of the type of patient (large number of patients with severe malnutrition and hospital admission), it is difficult to extrapolate these results to all patients with cancer.
In light of all the above, the future perspectives of this study are to open new lines of research on the adequate categorisation of the nutritional status of patients with cancer for the prognostic approach and, when necessary, to apply more intensive nutritional medical therapy to higher-risk patients. As such, using the different morphofunctional assessment tools routinely in nutrition units for the management of hospitalized patients can be a great help.
ConclusionsMalnutrition among cancer patients referred for nutritional assessment during admission is very high. In hospitalized patients with cancer, malnutrition measured by the MNA acts as an independent risk factor for death, predominantly in patients over 70 years of age. We found an increase in metabolic and nephrological complications in patients at high risk of malnutrition measured by MUST.
Conflicts of interestThe authors declare that they have no conflicts of interest.
