


This study was intended to analyze the change in prevalence of diabetes mellitus in Spain during the period 1999–2014, and to estimate its prevalence in the near future. On the other hand, the association between DM and the following variables was assessed: sex, age, educational level, and social class, and to others related to lifestyle such as diet and physical activity.
Material and methodsA descriptive analysis of prevalence was performed based on the different health surveys conducted in Spain from 1999 to the present day, including EDDES in 1999; ENS in 2003, 2006 and 2012; and EESE in 2009 and 2014. Mean interannual changes were also calculated for different periods. The confidence intervals in the observed prevalence rates were estimated to verify the significance of the differences seen. Contingency tables and regression were used to verify the association of DM prevalence with independent variables.
ResultsSociodemographic variables such as social status or educational level are determinant in the risk of suffering the disease. In recent years, change in prevalence suggests a different pattern, with negative interannual rates. The exponential increase seen in previous decades tends to stabilize, and decreases are seen in some cases.
ConclusionThere may be a greater awareness of the need for a balanced diet and the benefits of continued physical exercise. Campaigns promoting public health policies are probably working.
Este trabajo se propone analizar la evolución reciente de la prevalencia en España para el período entre 1999-2014. Por otro lado, se pone en relación la prevalencia de la DM con algunas de las variables sociodemográficas que la determinan: edad, sexo, nivel de estudios, clase social, y otras relativas al estilo de vida como la alimentación y el ejercicio.
Material y métodosSe ha realizado un análisis descriptivo de la prevalencia basado en las estadísticas de los organismos oficiales que proporcionan los datos analizados aquí: las distintas Encuestas Nacionales de Salud que se han realizado en España desde el año 1999 hasta la actualidad: EDDES, 1999, ENS 2003, 2006 y 2012, EESE 2009 y 2014. Así mismo se calculan los promedios de variación interanual para distintos períodos. Se estiman los intervalos de confianza en las prevalencias observadas a fin de contrastar la significatividad de las diferencias observadas (tablas de contingencia y regresión se usan para verificar la asociación de la prevalencia de la DM con las variables independientes).
ResultadosLas variables sociodemográficas, como el estatus social o el nivel de estudios, son determinantes en el riesgo de contraer la enfermedad. En los últimos años la evolución de la prevalencia apunta una pauta diferente, presentando tasas de variación interanual negativas. El incremento exponencial al que asistimos en décadas anteriores tiende a estabilizarse y, en algunos casos, a remitir.
ConclusiónPodría hablarse de una mayor conciencia de la necesidad de una alimentación equilibrada o las bondades de algún ejercicio físico continuado, así como las distintas medidas de salud pública que los gobiernos comienzan a implementar que, sumado al desarrollo biotecnológico, incidirán en una atenuación del crecimiento de la incidencia de DM.
Diabetes mellitus (DM) has been extensively investigated over the centuries. However, despite very important advances such as the discovery of insulin in the early twentieth century, the incidence of the disease has increased constantly, particularly in the developing countries. The most recent figures reported by the International Diabetes Federation (IDF), referring to the year 2017, indicate that DM affects 425 million people worldwide.1 Such a high prevalence, aggravated by its associated comorbidities, together with the multiple social, cultural, economic or political factors underlying this chronic disease, make it of specific interest also for the social sciences.
Diabetes mellitus is not a reportable disease, even though a significant proportion of people (50% in some countries)1 suffer DM without the disease having been diagnosed. In some cases the disorder manifests with symptoms requiring emergency hospital admission, though the great majority of patients are diagnosed in primary care centers. These circumstances contribute to explaining the fact that there is no reliable systematic registry defining the number of people with DM in Spain. The many studies that have been made show some disparity in the data provided. This is due to the different methods employed (surveys, clinical analyses or secondary data exploitation), the different age cohorts investigated, and the diversity of the geographic settings analyzed. Nevertheless, on comparing studies involving the same methodological procedure and similar populations, particularly as regards the age ranges analyzed, the results obtained are consistent. All this justifies the need for further prevalence studies, in an attempt to generate increasingly precise epidemiological information.
Despite their limitations, the statistics on DM offered by the official organisms can give us a good idea of the epidemiology of the disease. The present study represents an attempt both to gather the most current general and specific data referring to the prevalence of DM in Spain with a view to analyzing its course, and to describe the relationships among the principal variables determining the disease. Our working hypothesis is that there is a tendency toward stabilization of the increase in DM seen in the past decades in Spain.
The World Health Organization (WHO) estimated a worldwide prevalence of DM of 3% in the year 2002, representing approximately 170 million affected people.2 Moreover, at that time the experts warned that this figure would be more than double by the year 2025. Much of this increase would come from developing countries as a result of factors such as a growing or aging population, unhealthy eating habits, obesity and sedentary lifestyles. Likewise, it was noted that differences based on the degree of development of the country would be reflected in the affected age groups. Accordingly, by the year 2025 the industrialized countries would have the largest number of affected individuals in the over 65 age group. By contrast, in the developing countries the most affected group would correspond to those individuals between 45 and 65 years of age. This would have a considerable socioeconomic impact, since this is precisely the most productive age group. Today these predicted figures have been clearly exceeded, and the WHO now reports 422 million people with DM worldwide.3 Furthermore, according to these sources, the future perspectives are also a cause for concern: in a single year, 16 million additional people throughout the world are expected to develop the disease.
The most approximate systematic estimate of the prevalence of DM in Spain is that offered by the Spanish National Health Survey/European Survey of Health in Spain (Encuesta Nacional de Salud/Encuesta Europea de Salud en España [ENS/EESE]). The most recent survey, conducted in 2014, revealed an overall prevalence in the population over 16 years of age of close to 7%. This means that over 2.5 million people (2,662,400) have DM in Spain, a figure that falls a little short of the number reported in the previous national survey.
Different studies in Spain suggest an increase in the prevalence of both type 1 DM (DM1), even in adults, and of type 2 DM (DM2) in children and adolescents.4–8 In this country, the most recent studies have reported DM1 prevalence rates ranging from 1 to 10 cases per 10,000 individuals.5,9–11 Epidemiological studies often address the disease from a global perspective, reporting prevalence rates that make no distinction between DM1 and DM2. The most recent and relevant studies conducted in Spain describe a wide range of prevalence rates, ranging from 3 to 20% during the period between the 1990s and today.12–19
Based on a documentary review in 2006, Ruiz-Ramos et al.20 reported DM2 prevalence rates ranging from 4.8 to 18.7%, and DM1 prevalence rates ranging from 0.08 to 0.2%, indicating that the frequencies increase as population income decreases.
In 2007, and based on various health surveys, Basterra-Gortari et al.21 reported an increase in prevalence in Spain during the period 1997–2003 parallel to that seen with other associated diseases such as arterial hypertension, obesity and hypercholesterolemia. The figures proved even more significant when adjusted for gender and age, being higher in males and in individuals over 70 years of age.
Subsequently, Martínez22 described prevalence rates ranging from 6.5% in the population between 30 and 65 years of age to 16.7% among individuals between 65 and 74 years of age, and as high as 19.3% in those over 74 years of age, corresponding to the year 2007. More recently, Jiménez-Mejías23 estimated an overall prevalence of 7.1% in 2012, representing an increase over the figures seen in 2006 (6%) and 2001 (5.5%).
Such broadly varying ranges are mainly attributable to differences in the analytical methods used, and more specifically to the different cohorts examined. However, on focusing upon studies with the same methodology and identical age ranges, the results show a high level of consistency (see Appendix A).
Material and methodsOur main data source was the Spanish National Health Survey (ENS), a statistical project promoted by the Spanish Ministry of Health and Consumer Affairs, within the National Statistics Plan, and which also includes the Inventory of Statistical Operations of the General State Administration. Since 2002, and resulting from an agreement between the Ministry and the Spanish National Institute of Statistics (Instituto Nacional de Estadística [INE]), the latter has been in charge of this statistical project. In recent years the project has been conducted within the context of the European Survey of Health in Spain, the aims of which are similar to those of the ENS, though with the additional purpose of harmonizing information across European Union countries. The first edition of this project corresponds to the year 2009. The survey is also representative of the regional or community setting in that a separate sample representing each of the Spanish Autonomous Communities has been contemplated. Indeed, one of the objectives of this statistical project is to produce results that can be individualized at this level. However, when a subsample with specific characteristics is selected from this level, the results may prove less reliable. The latest available European Survey of Health in Spain corresponds to the year 2014, based on a sample of 23,000 households distributed among the 2500 census sections selected.
Data from the 1999 Disabilities, Deficiencies and Health Survey (Encuesta de Discapacidades, Deficiencias y Estado de Salud [EDDES]) were also collected, since it comprises the largest DM population sample in Spain (3658 cases), and moreover offers information not provided by any other statistical project, such as the variable “year of diagnosis of the disease”.
For the purposes of our study, we obtained the complete databases (microdata) of the competent bodies, particularly of the Institute of Health Information, which is within the Ministry of Health and Consumer Affairs, and the National Institute of Statistics (INE). After examining the microdata, we selected the variable of interest for this study: the prevalence of diabetes as a dependent variable (adopted by all the statistical projects considered herein), which was obtained by questioning the population about the presence of the disease and whether it had been diagnosed. Since the answers were obtained from the interviewees, this variable was contrasted for control purposes against another parameter referring to drug prescription and use, eliminating cases with inconsistencies (i.e., interviewees denying the disease or its diagnosis but claiming to take drugs for DM).
The independent variables relating to the socio-demographic circumstances of the study population were taken from the most recent European Survey of Health in Spain (2014). Specifically, and in addition to gender and age compiled from 10-year cohorts, we considered educational level, documented from the above-mentioned source as follows:
- 1.
Unable to read or write.
- 2.
Incomplete primary education (less than 5 years of schooling).
- 3.
Full primary education.
- 4.
First stage of secondary education, with or without title (2nd year ESO, EGB or equivalent).
- 5.
High school studies.
- 6.
Intermediate level vocational training.
- 7.
Higher level vocational training.
- 8.
University education or equivalent.
Furthermore, in order to explain the relationship between prevalence and social class, we took into consideration the variable described by the INE as “social class based on occupation”, based on 6 levels or classes:
- 1.
Directors and managers of establishments with 10 or more employees and professionals traditionally associated with university degrees.
- 2.
Directors and managers of establishments with fewer than 10 employees, professionals traditionally associated with university diplomas, and other technical support professionals. Athletes and artists.
- 3.
Intermediate occupations and self-employed workers.
- 4.
Supervisors and workers in qualified technical positions.
- 5.
Qualified primary sector employees and other semi-qualified workers.
- 6.
Non-qualified workers.
It should be noted that the classification used in addressing this variable was inspired by Goldthorpe,24 whose stratification theory is based on professional occupation, using job and market similarities as a grouping criterion.
Eating and dietary variables were analyzed in reference to other lifestyle risk factors. The body mass index (BMI), derived from questioning about weight and height, was classified into four categories ranging from “underweight” to “obese”. The variables referring to physical exercise were recorded from the questionnaire based on frequency scales.
With the data obtained from the above-mentioned sources, regarding the percentage of people with DM, we calculated the mean inter-annual variation or mean annual growth rate based on the following formula: r=Pf/Pit−1 where Pf: population with DM at the end of the period, Pi: population with DM at the start of the period, and t: time elapsed between Pf and Pi. In order to determine the recent variation over time, we took into consideration the prevalence rates of the following surveys: the European Survey of Health in Spain 1999, the ENS 2003, 2006 and 2012, and the European Survey of Health in Spain 2009 and 2014.
Contingency tables and odds ratio (OR) estimations were used to explore the relationship between the prevalence of diabetes and the independent variable. The relationship was also assessed with the regression function and R statistic.2
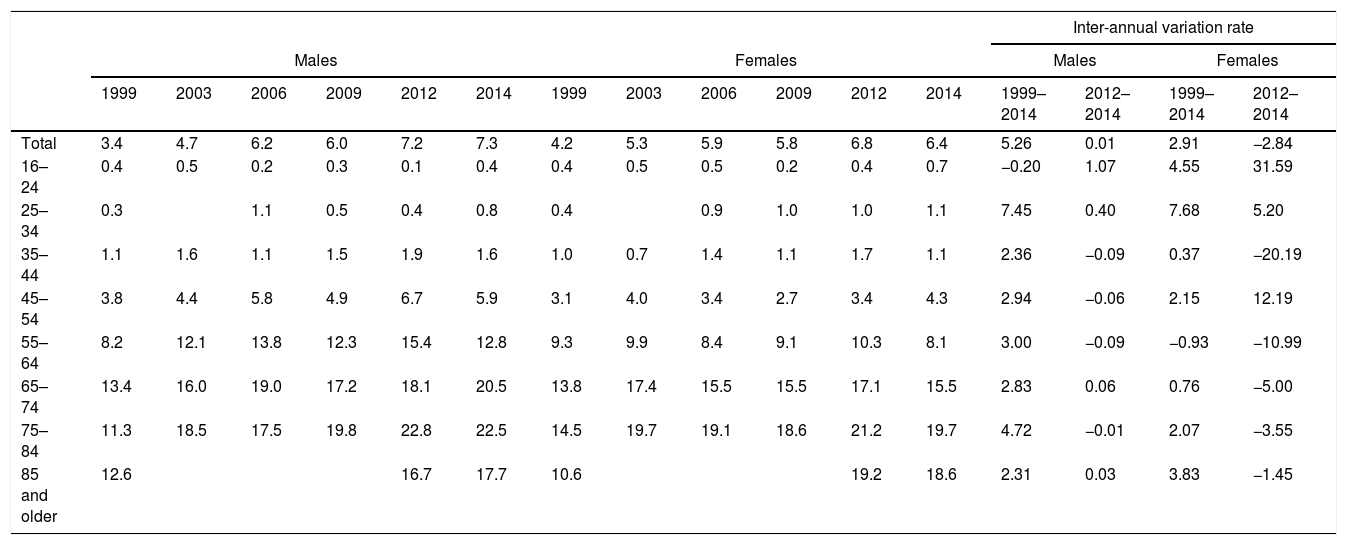
ResultsTable 1 shows the evolution of prevalence according to age and gender groups between 1999 and 2014, along with the inter-annual variation rates.
Change over time in the prevalence (%) of diabetes in Spain, according to age and gender (1999–2014).
| Inter-annual variation rate | ||||||||||||||||
|---|---|---|---|---|---|---|---|---|---|---|---|---|---|---|---|---|
| Males | Females | Males | Females | |||||||||||||
| 1999 | 2003 | 2006 | 2009 | 2012 | 2014 | 1999 | 2003 | 2006 | 2009 | 2012 | 2014 | 1999–2014 | 2012–2014 | 1999–2014 | 2012–2014 | |
| Total | 3.4 | 4.7 | 6.2 | 6.0 | 7.2 | 7.3 | 4.2 | 5.3 | 5.9 | 5.8 | 6.8 | 6.4 | 5.26 | 0.01 | 2.91 | −2.84 |
| 16–24 | 0.4 | 0.5 | 0.2 | 0.3 | 0.1 | 0.4 | 0.4 | 0.5 | 0.5 | 0.2 | 0.4 | 0.7 | −0.20 | 1.07 | 4.55 | 31.59 |
| 25–34 | 0.3 | 1.1 | 0.5 | 0.4 | 0.8 | 0.4 | 0.9 | 1.0 | 1.0 | 1.1 | 7.45 | 0.40 | 7.68 | 5.20 | ||
| 35–44 | 1.1 | 1.6 | 1.1 | 1.5 | 1.9 | 1.6 | 1.0 | 0.7 | 1.4 | 1.1 | 1.7 | 1.1 | 2.36 | −0.09 | 0.37 | −20.19 |
| 45–54 | 3.8 | 4.4 | 5.8 | 4.9 | 6.7 | 5.9 | 3.1 | 4.0 | 3.4 | 2.7 | 3.4 | 4.3 | 2.94 | −0.06 | 2.15 | 12.19 |
| 55–64 | 8.2 | 12.1 | 13.8 | 12.3 | 15.4 | 12.8 | 9.3 | 9.9 | 8.4 | 9.1 | 10.3 | 8.1 | 3.00 | −0.09 | −0.93 | −10.99 |
| 65–74 | 13.4 | 16.0 | 19.0 | 17.2 | 18.1 | 20.5 | 13.8 | 17.4 | 15.5 | 15.5 | 17.1 | 15.5 | 2.83 | 0.06 | 0.76 | −5.00 |
| 75–84 | 11.3 | 18.5 | 17.5 | 19.8 | 22.8 | 22.5 | 14.5 | 19.7 | 19.1 | 18.6 | 21.2 | 19.7 | 4.72 | −0.01 | 2.07 | −3.55 |
| 85 and older | 12.6 | 16.7 | 17.7 | 10.6 | 19.2 | 18.6 | 2.31 | 0.03 | 3.83 | −1.45 | ||||||
Source: Compiled from the National Institute of Statistics (INE).25
The main difference between the large age groups was directly related to the type of DM involved. In this regard, DM2 proved more likely in adults, while DM1 was more likely seen at very early ages. The probability of developing DM2 increased with age, while the risk of developing DM1 was seen to decrease with advancing age. This fact accounts for much of the increase in prevalence seen in the different age groups, particularly after 44 years of age (Table 1).
While the variable “age” explained differences in prevalence, little variability was observed on stratifying according to gender. Females presented somewhat higher prevalence rates at the start of the period, though not so at the end. The variation over time minimally favored females, with a slightly slower increase in rate compared with males (Fig. 1).

Data compiled from the INE: EDDS 1999; ENS 2003, 2006 and 2012; European Survey of Health in Spain 2009 and 2014.
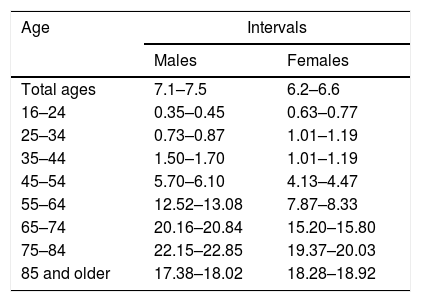
The estimation of intervals confirmed the significance of the differences recorded for each age and gender category in the last year. The intervals were not found to coincide: in relation to both age and gender the differences were significant, as usually occurs with sample sizes as large as those reported by the successive official health surveys (N=38,959,700 and n=22,852). The intervals were calculated for a 95% confidence level (z=1.96) (Table 2).
Confidence intervals for the observed prevalence rates (%) according to gender and age.
| Age | Intervals | |
|---|---|---|
| Males | Females | |
| Total ages | 7.1–7.5 | 6.2–6.6 |
| 16–24 | 0.35–0.45 | 0.63–0.77 |
| 25–34 | 0.73–0.87 | 1.01–1.19 |
| 35–44 | 1.50–1.70 | 1.01–1.19 |
| 45–54 | 5.70–6.10 | 4.13–4.47 |
| 55–64 | 12.52–13.08 | 7.87–8.33 |
| 65–74 | 20.16–20.84 | 15.20–15.80 |
| 75–84 | 22.15–22.85 | 19.37–20.03 |
| 85 and older | 17.38–18.02 | 18.28–18.92 |
Source: Compiled from the National Institute of Statistics.25
Considering the most recent source (European Survey of Health in Spain 2014), an association was observed between the prevalence of diabetes and educational level and social class.
The slopes reveal the negative correlation between the variable “prevalence of diabetes” and “educational level” and “social class”. As the social class level decreased, its prevalence was seen to increase. Likewise, its prevalence increased among those individuals with a lower educational level (Fig. 2).

Data compiled from the European Survey of Health in Spain 2014.
An association was also evident on considering prevalence in relation to lifestyle; eating habits and physical exercise were reflected in the muscle mass index, which was directly related to prevalence.
The slopes in this case show the association between prevalence and obesity and sedentary lifestyle. A direct relationship was recorded, with a positive slope, in the case of the body mass index (BMI): as weight increased, the prevalence of the disease also increased. Specifically, the prevalence was approximately 10% among those who did not perform any physical exercise, versus approximately 2% in those who exercised several times a week (Fig. 3).

More than half of the obese individuals were seen to have diabetes. Consequently, although an inverse relationship was seen in this case as shown by the negative slope, the greater the physical activity, the lower the prevalence of DM.
The results obtained support the association between these variables based on the calculated ORs (Appendix A). In effect, a low educational level was identified as a risk factor (OR=4.575), in the same way as belonging to the most disadvantaged social class (OR=1.670), a sedentary lifestyle defined as no physical exercise or sports activities (OR=2.180), and overweight (OR=3.503). In each case, the probability of having diabetes was greater in the presence of exposure to the mentioned risk variable.
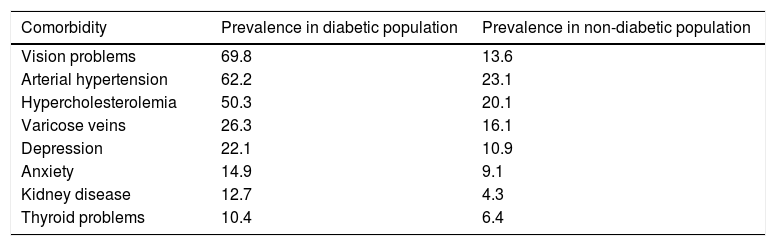
Lastly, the same source yielded some information related to comorbidity. Table 3 shows the prevalence rates of different diseases among the diabetic population. We show those presenting the highest values, comparing them with the prevalence rates of these same diseases in the general non-diabetic population. Vision problems were present in 7 out of every 10 diabetics, and more than half of them presented high blood pressure or hypercholesterolemia. Mental health-related problems were more prevalent in the diabetic population than kidney disorders, though this was also seen in the non-diabetic population. The prevalence of concomitant diseases was markedly higher in the diabetic population. Some disorders such as depression or thyroid gland disorders were more than twice as prevalent as in the general population, and in the case of kidney problems, the prevalence among diabetics was three times greater than in the general population.
Percentages of comorbidities in the adult population aged 45–55 years.
| Comorbidity | Prevalence in diabetic population | Prevalence in non-diabetic population |
|---|---|---|
| Vision problems | 69.8 | 13.6 |
| Arterial hypertension | 62.2 | 23.1 |
| Hypercholesterolemia | 50.3 | 20.1 |
| Varicose veins | 26.3 | 16.1 |
| Depression | 22.1 | 10.9 |
| Anxiety | 14.9 | 9.1 |
| Kidney disease | 12.7 | 4.3 |
| Thyroid problems | 10.4 | 6.4 |
Source: Compiled from the National Institute of Statistics.25
In order to offer a more precise result, these prevalence rates are shown for a single age interval corresponding to the adult population aged 45–55 years, thus yielding a diabetic and a non-diabetic population of similar characteristics, and eliminating the distortion introduced by the variable “age”.
DiscussionAge is undoubtedly the socio-demographic variable with the greatest impact upon diabetes, and this is related to the structure of the population itself. Jiménez et al.25 estimated a 12.5% increment between 2001 and 2009 attributable to the aging of the population. Of note, however, is the fact that from 80 years of age onwards, the prevalence decreased markedly in both males and females, though on considering the absolute values, twice as many females presented the disease in this particular age segment. This can be directly related to the total population volume, since we know that in the upper strata of the population pyramid the values corresponding to females are greater than those corresponding to males, as a result of the gender difference in life expectancy. Another important consideration regarding this decrease in prevalence in the upper strata is that individuals who have not developed DM before 85 years of age are unlikely to do so subsequently. Another possibility is that diabetic individuals do not have such a long life expectancy and die before reaching this age. A further plausible interpretation is that all subjects genetically susceptible to developing diabetes, in an environment characterized by highly accessible energy-dense foods and a generalized lack of physical exercise, have already developed the disease, and as the years go by the incidence values become moderated as a result of the fact that there are no remaining individuals genetically susceptible to developing DM.
The data from the most recent European Survey of Health in Spain confirm the observations of authors such as Ruiz-Ramos et al.20 or Reviriego et al.19 regarding the distribution of prevalence rates among the population according to socio-demographic factors such as social class, income, occupation or educational level, the prevalence being higher among individuals with the most disadvantaged social status.
As has been demonstrated by many publications, another risk factor for the development of DM is educational level.26–28 A study conducted in Maryland in 2009 by Abby and Ershow concluded that efforts should focus on education if we want to reduce the incidence of the disease. Language barriers also contribute to increasing the risk among immigrants, since they result in poorer access to healthcare.29 A lack of education, as well as language difficulties, also imply an increased mortality risk among diabetics.30
It should be noted that the highest percentages of the less educated population correspond to the older age cohorts, where the prevalence of the disease rises markedly. Among the more educated population, the figures are somewhat lower, and although the older population segments are known to group the lowest percentages of individuals with a higher education, it can be assumed that better educated people are more inclined to adopt preventive measures such as correct eating habits or a healthy lifestyle. In this regard, the surveys show a progressive increase in the population that does regular physical exercise, as shown by the Anuario de estadísticas deportivas, published by the Spanish Ministry of Education, Culture and Sports. According to this source, there was a 10% increase in the number of people involved in sporting activities on a weekly basis during the period 2010–2015, with women showing the greatest increase (17%).31
The statistics of the official health organizations provide a considerable amount of data for investigators. However, the specific target of our study – the diabetic population – is not addressed by the national surveys. Unfortunately, it is not possible from this source to analyze the difference between individuals with type 1 and type 2 diabetes, for although the interviewees expressly indicated whether they had been diagnosed with diabetes or not, they were not asked about the concrete type of the disease. Type 1 and type 2 diabetes are well differentiated disease entities, and the experience and perception of the disorder differ greatly between patients with one type of DM or the other. Drug prescription data could provide clues in this regard, helping to identify insulin-dependent individuals, but the questionnaire likewise did not address this aspect.
Another limitation of the questionnaire is the fact that it did not record the year of diagnosis. Among other aspects, such information is crucial regarding knowledge concerning the behavior of the comorbidities of DM, which in turn can prove indicative of the type of diabetes involved in each case.
Lastly, it should be taken into account that this was a survey in which the interviewees reported their own subjective perceptions. This may have introduced some bias which in turn affected our interpretation of the information.
Although the surveys used in our study have certain limitations, one of the strengths of the study is that no other statistical project offers data corresponding to such a large diabetic population sample. Furthermore, our sample addressed a large number of socio-demographic parameters, including aspects referring to health and lifestyle. Finally, since this statistical project is updated on a periodic basis, we have the possibility of finding out how the observed associations evolve over time, thereby opening the door to future lines of research.
ConclusionsIn relation to our starting hypothesis, we have found the prevalence indicators to exhibit a similar evolution over time, though the different studies show great variability. This is due not only to the broad diversity in geographical settings, but also to the methodology used in data compilation, and especially to the different age segments of the analyzed populations. As regards the future perspectives of the disease, negative inter-annual variation rates have been observed in most age cohorts in recent years, thus suggesting a possible stabilization of the increase in prevalence.
The reasons for this stabilization may include the impact of insistent awareness campaigns, as well as the effects of health policies implemented as a result of concern about the constant rise in the incidence of DM, which seek to improve eating habits and encourage physical exercise. Education is directly related to the prevalence of the disease, and in this respect it can be affirmed that as the educational level of the population improves, so too do lifestyle habits, thereby combating the increase in the prevalence of the disease.
In October 2016, the WHO encouraged countries to tax sugary beverages with the aim of combating obesity and diabetes, and several countries have adopted this measure. In this regard Catalonia is a pioneer in Spain, since to date it is the only autonomous community to have implemented this measure (on 1 May 2017). The introduction of policies of this kind suggests that a possible reduction in the prevalence of the disease can be expected in the coming years. A somewhat more optimistic future may be postulated as a consequence of the measures adopted to correct the evolution of the disease, along with generally improved living conditions and, in particular, higher educational levels, accompanied by the generalized adoption of healthy living habits, one example of this being the decrease in smoking observed in recent years.24 Lastly, the level of biotechnological specialization already reached constitutes a further contributing element.
Financial supportThis study was funded by the Extremadura Aid to Research Groups (Ayuda a Grupos de Investigación de Extremadura) (GR15182), established by the authorities of Extremadura and covered by the European Development Fund.
Conflicts of interestThe authors state that they have no conflicts of interest.
The authors acknowledge the support of the Grupo de Estudios Territoriales (GET), at the Faculty of Sociology of the University of A Coruña (Spain).
The following is the supplementary data to this article:
Please cite this article as: López Rey MJ, Docampo García M. Evolución de la prevalencia de la diabetes mellitus en España (1999–2014). Endocrinol Diabetes Nutr. 2018;65:515–523.
