


Chylomicronemias are generally diagnosed genetically by genomic sequencing or screening for mutations in causal genes with a large phenotypic effect. This strategy has allowed to improve the characterization of these patients, but we still have 30% of the patients without a conclusive genetic diagnosis. This is why we hypothesize that by adding the epigenetic component we can improve the genetic diagnosis, and for this we have explored the degree of methylation in the DNA of hypertriglyceridemic patients.
MethodologyBlood cell DNA was obtained from 16 hypertriglyceridemic patients and from 16 age- and sex-matched control subjects. The degree of methylation in genome-wide DNA was determined using the Illumina Infinium Methylation EPIC Array Analysis.
ResultsWe identified 31 differentially methylated cytosines by comparing the methylation patterns presented by hypertriglyceridemic patients vs control subjects. The cg03636183 in the F2RL3 gene was 10% hypomethylated in hypertriglyceridemic patients, and has previously been associated with an increased cardiovascular risk. Cg13824500 is 10% hypomethylated in hypertriglyceridemic patients and is located in VTI1A, which is a limiting gene in the transit of chylomicrons in the enterocyte through the endoplasmic reticulum and the Golgi apparatus. Cg26468118 in the RAB20 gene (13% hypomethylated) and cg21560722 in the SBF2 gene (33% hypermethylated) are involved in the regulation of Golgi apparatus vesicles.
ConclusionsOur results suggest that there are differentially methylated regions related to the formation of chylomicrons in hypertriglyceridemic patients.
Las quilomicronemias generalmente se diagnostican genéticamente mediante secuenciación genómica o screening de mutaciones en genes causales con un gran efecto fenotípico. Esta estrategia ha permitido mejorar la caracterización de estos pacientes, pero aún tenemos un 30% de los pacientes sin un diagnóstico genético concluyente. Es por esto que hipotetizamos que añadiendo el componente epigenético podemos mejorar el diagnóstico genético y para ello hemos explorado el grado metilación en el DNA de pacientes hipertrigliceridémicos.
MetodologíaEl DNA de células sanguíneas fue obtenido de 16 pacientes hipertrigliceridémicos y de 16 sujetos control apareados por edad y sexo. El grado de metilación en el DNA de todo el genoma fue determinado mediante el Illumina Infinium Methylation EPIC Array Analysis.
ResultadosIdentificamos 31 citosinas diferencialmente metiladas al comparar los patrones de metilación que presentaban los pacientes hipertrigliceridémicos vs los sujetos control. La cg03636183 en el gen F2RL3 estaba un 10% hipometilada en los pacientes hipertrigliceridémicos, y ha sido previamente asociada a un mayor riesgo cardiovascular. La cg13824500 está un 10% hipometilada en pacientes hipertrigliceridémicos y se localiza en VTI1A que es un gen limitante en el tránsito de los quilomicrones en el enterocito a través del retículo endoplásmico y el aparato de Golgi. La cg26468118 en el gen RAB20 (13% hipometilada) y la cg21560722 en el gen SBF2 (33% hipermetilada) están implicadas en la regulación de vesículas del aparato de Golgi.
ConclusionesNuestros resultados sugieren que existen regiones diferencialmente metiladas relacionadas con la formación de los quilomicrones en pacientes hipertrigliceridémicos.
Genetic diagnosis based on identifying causal mutations with a large phenotypic effect is central to the diagnosis of the most severe forms of dyslipidaemia.1 Chylomicronaemias or severe hypertriglyceridaemias are disorders with a complex aetiopathogenesis and defined by the abnormal presence of chylomicrons in fasting plasma, producing triglyceride (TG) levels above 500−1000 mg/dl. We differentiate between 2 types of severe hypertriglyceridaemia.
Primary hypertriglyceridaemia usually has a monogenic cause and occurs in an autosomal recessive manner. Five genes have now been identified as the main agents that code for key proteins in the TG lipolysis process: LPL, APOC2, GPIHBP1, APOA5, and LMF1. Certain mutations in these genes lead to chronically elevated TG levels. Primary hypertriglyceridaemias have a prevalence of 1:100,000−1:1,000,000; they are of early onset; their main clinical manifestation is pancreatitis, which can be fatal; and are not usually associated with elevated cardiovascular risk (reviewed in Dron and Hegele2).
However, secondary hypertriglyceridaemias have a higher prevalence (1:6. 000); they usually occur in adults; at the metabolic level they present an increase in the number of chylomicrons, together with VLDL, and their remnants, which means they are associated with an elevated cardiovascular risk; we found a significant influence of secondary factors (such as obesity, metabolic syndrome, diabetes, or high alcohol intake, among others); and the genetic cause is more complex, involving rare genetic variants in heterozygous form in the abovementioned 5 diagnostic genes, together with variants in other TG-associated genes.3 It seems increasingly clear that this form of chylomicronaemia usually presents as a relatively mild hypertriglyceridaemia but associated with sporadic hyperlipaemic decompensations which, due to certain lipid overload situations, can multiply TG levels up to 10-fold or more, only to decline rapidly again.4
There are clear differences between the two forms of severe hypertriglyceridaemia, and therefore knowing the genetic cause may help to better characterise each patient’s phenotype, better stratify their cardiovascular risk, improve the identification of new patients, and facilitate the most appropriate treatment for each patient.
Today, the combination of various genetic strategies, and the identification of new mutations with great phenotypic effect thanks to massive sequencing, together with the design of genetic risk-scores that include several TG modulating variants, have helped us improve in the characterisation of these patients,5 but this still leaves around 30% of cases of chylomicronaemia without a known genetic cause.6,7 Therefore, we do not rule out the possibility that other genetic components play a role in the development of this dyslipidaemia. In this study, we wanted to assess whether epigenetics may be involved in hypertriglyceridaemia, and therefore we used a non-targeted strategy, conducting an association study of the entire epigenome in samples from patients with severe hypertriglyceridaemia of no known genetic cause, to identify new differentially methylated regions in the genome compared to a group of normolipaemic subjects.
MethodologyParticipantsThe group of hypertriglyceridaemic patients comprises 16 subjects who were referred to our centre’s lipid unit for the study of severe hypertriglyceridaemia. These are patients with TG levels above 1000 mg/dl and in whom none of the main causal mutations in the genes responsible for the most severe forms of hypertriglyceridaemia described in the literature were detected (7 mutations in LPL, 5 in APOA5, 5 in GPIHBP1, one in APOC2 and 2 in LMF1). These patients were compared with age- and sex-matched normolipaemic subjects who were part of the European VITAGE project,8 which included apparently healthy men aged 20–75 years. Subjects with chronic hepatic, renal, cardiopulmonary, or neoplastic diseases were not included.
The study was approved by our centre’s Ethics and Clinical Research Committee and all participants signed the informed consent form.
SamplesFasting blood samples were obtained from all participants and collected in EDTA plasma tubes (Sarstedt, Ltd., Nümbrecht, Germany), protected from light, and centrifuged immediately at 1500 g for 10 min at 8 °C. Plasma was separated and divided into aliquots. The buffy coat was collected for genomic DNA extraction. All samples were stored at −80 °C until the analytical tests were performed.
Analysis of plasma lipidsPlasma TG and cholesterol concentrations were measured using enzyme kits (F. Hoffmann-La Roche, Ltd.) adapted for a Cobas Mira autoanalyser (F. Hoffmann-La Roche, Ltd.). We measured by immunoturbidometry apolipoprotein B and lipoprotein (a) using specific antibodies (F. Hoffmann-La Roche, Ltd., and Incstar Corp., respectively).
LDL-cholesterol was calculated using the Friedewald formula9 and could not be calculated in all the hypertriglyceridaemic patients.
Full genome association studyThe cytosines were treated with sodium bisulphite to 500 ng of DNA to convert them to uracils, whereas cytosines with a 5-methyl group do not react to sodium bisulphite. The DNA was then hybridised to the Illumina® array (Infinium MethylationEPIC BeadChip) following the instructions of the manufacturer's protocol. The data of the intensities of each probe type on the array (idat files) were processed using the R package, ChAMP version 2.9.10.10,11
Probes with a detection p-value above .01 in one or more samples, probes with a bead count <3 in at least 5% of the samples, probes with close SNPs as identified in Zhou et al.,12 probes that align at multiple locations as identified by Nordlund et al.,13 and probes located on X or Y chromosomes were filtered.
After filtering the probes, intracellular type normalisation was performed using the beta-mixing quantile normalisation method14 to avoid the bias introduced by the design of the Infinium type 2.
After beta-mixture quantile normalisation, using SVD analysis we assessed the magnitude of the batch effects. We used Houseman correction15 to correct for differences in methylation resulting from differences in cell heterogeneity.15
Differential methylation analysis was performed using the empirical Bayes moderated t-statistic (for the outcome variable) using the limma16 package of R statistical software. The β value in the methylation experiments is the estimate of the methylation level using the ratio of the methylation probe intensity to the overall intensity, while the M-value is a logarithmic transformation of the β value. The M-value was used for differential methylation analysis and the β value for reporting the results, which provided a more intuitive biological interpretation. Raw P-values were adjusted using the Benjamini-Hochberg procedure, and a cut-off false discovery rate of .05 and delta Beta ≥5% in the analyses related to the results was used as a statistically significant threshold.
Statistical analysisWe used the Kolmogorov-Smirnov test to determine whether the quantitative variables were normally distributed.
Descriptive data for quantitative variables are presented as mean ± standard deviation or median (interquartile range), they are presented as percentages for the qualitative variables.
Correlations between the percentage of differentially methylated cytosine methylation with the different quantitative variables were adjusted by age, sex, and BMI.
Results and discussionThere is now considerable evidence that epigenetic mechanisms play an important role in the regulation of metabolic phenotypes and in complex diseases such as dyslipidaemia,17 although it remains unclear whether most of the described changes in DNA methylation are causal or a consequence of dyslipidaemia. In the present study we used epigenetics as a tool to identify new genomic regions related to severe hypertriglyceridaemia, and for this purpose we wanted to determine the pattern of DNA methylation in a group of patients with severe hypertriglyceridaemia without a clear genetic diagnosis, to compare it with that of a group of normolipaemic subjects.
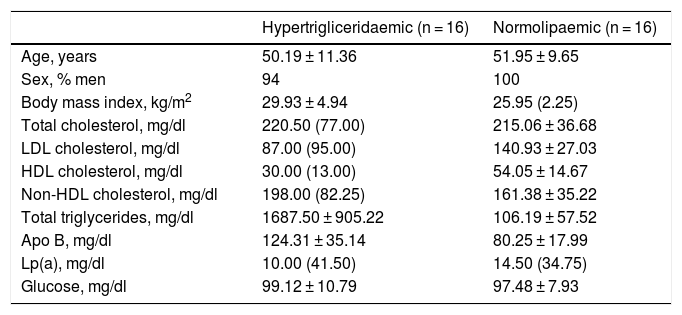
Both groups were matched by age and sex to minimise biological variability between groups. The participants were middle-aged and mostly male. As shown in Table 1, the group of hypertriglyceridaemic patients had statistically significantly higher BMI, higher TG concentration, lower HDL-cholesterol concentration, higher non-HDL-cholesterol concentration, and higher glucose concentration than the normolipaemic subjects.
Baseline anthropometric and biochemical characteristics of the participants.
| Hypertrigliceridaemic (n = 16) | Normolipaemic (n = 16) | |
|---|---|---|
| Age, years | 50.19 ± 11.36 | 51.95 ± 9.65 |
| Sex, % men | 94 | 100 |
| Body mass index, kg/m2 | 29.93 ± 4.94 | 25.95 (2.25) |
| Total cholesterol, mg/dl | 220.50 (77.00) | 215.06 ± 36.68 |
| LDL cholesterol, mg/dl | 87.00 (95.00) | 140.93 ± 27.03 |
| HDL cholesterol, mg/dl | 30.00 (13.00) | 54.05 ± 14.67 |
| Non-HDL cholesterol, mg/dl | 198.00 (82.25) | 161.38 ± 35.22 |
| Total triglycerides, mg/dl | 1687.50 ± 905.22 | 106.19 ± 57.52 |
| Apo B, mg/dl | 124.31 ± 35.14 | 80.25 ± 17.99 |
| Lp(a), mg/dl | 10.00 (41.50) | 14.50 (34.75) |
| Glucose, mg/dl | 99.12 ± 10.79 | 97.48 ± 7.93 |
Data presented as mean ± SD or median (IQR) for the quantitative variables.
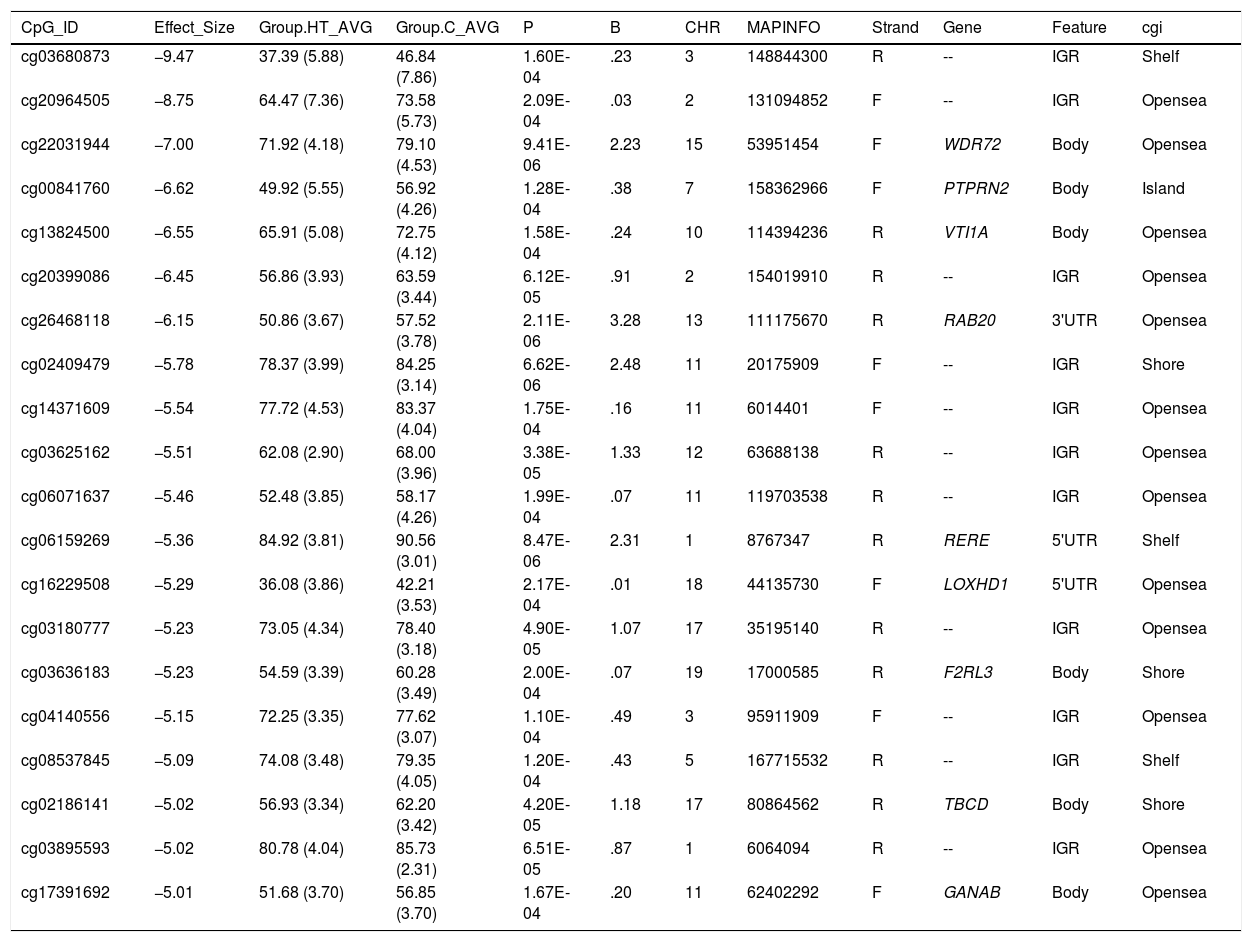
We compared global methylation patterns between the samples from the hypertriglyceridaemic patients and the normolipaemic control subjects, and identified 31 differentially methylated cytosines. Most of the associations (75%) represent cytosines that showed a lower degree of methylation (hypomethylated) in the hypertriglyceridaemic samples than in the normolipaemic subjects.
All the differentially methylated cytosines are listed in Tables 2 and 3. Some of these cytosines are located in genomic regions corresponding to a known gene, and others are located in intergenic regions and could not be assigned to a gene.
Differentially hypermethylated cytokines in hypertriglyceridaemic patients compared to normolipaemic subjects.
| ID | Effect_Size | Group.HT_AVG | Group.C_AVG | P | B | CHR | MAPINFO | Strand | Gene | Feature | cgi |
|---|---|---|---|---|---|---|---|---|---|---|---|
| cg21560722 | 20.65 | 60.76 (12.42) | 40.27 (17.63) | 7.07E-05 | .81 | 11 | 10293815 | F | SBF2 | Body | Opensea |
| cg04850286 | 9.13 | 53.84 (6.18) | 45.14 (5.72) | 5.97E-05 | .93 | 10 | 81895943 | F | PLAC9 | Body | Shelf |
| cg16289485 | 8.72 | 61.74 (5.24) | 53.15 (6.48) | 1.37E-04 | .34 | 12 | 111475128 | F | CUX2 | Body | Island |
| cg23387468 | 8.22 | 46.81 (6.25) | 38.98 (4.45) | 7.40E-05 | .77 | 7 | 139079360 | F | LUC7L2 | Body | Opensea |
| cg10403394 | 8.02 | 29.99 (5.16) | 22.54 (4.45) | 3.56E-05 | 1.29 | 15 | 63349192 | R | TPM1 | Body | Opensea |
| cg05878952 | 5.90 | 87.70 (3.89) | 81.88 (4.96) | 1.99E-04 | .07 | 8 | 141541073 | F | -- | IGR | Opensea |
| cg22264898 | 5.90 | 13.41 (3.68) | 8.17 (2.81) | 3.45E-05 | 1.32 | 18 | 3297176 | R | -- | IGR | Opensea |
| cg14718848 | 5.84 | 46.25 (3.79) | 40.66 (3.59) | 1.47E-04 | .29 | 11 | 128420863 | R | ETS1 | Body | Shore |
| cg01545223 | 5.76 | 41.08 (4.79) | 35.29 (3.58) | 3.61E-05 | 1.29 | 19 | 22801034 | F | -- | IGR | Island |
| cg26719629 | 5.54 | 22.60 (4.34) | 17.82 (2.80) | 7.93E-05 | .73 | 11 | 2163299 | F | IGF2AS | Body | Shore |
| cg08897705 | 5.30 | 63.04 (2.61) | 57.98 (3.36) | 2.18E-04 | .00 | 9 | 89382059 | R | -- | IGR | Opensea |
C: normolipaemic control subjects; CHR: chromosome that contains the CG (Build 38); HT: hypertriglyceridaemic patients; ID: unique identifier from the Illumina® GC database; MAPINFO: coordinates of the CG (Build 38); Strand: Forward (F) or Reverse (R) chain.
Differentially hypomethylated cytokines in hypertriglyceridaemic patients compared to normolipaemic subjects.
| CpG_ID | Effect_Size | Group.HT_AVG | Group.C_AVG | P | B | CHR | MAPINFO | Strand | Gene | Feature | cgi |
|---|---|---|---|---|---|---|---|---|---|---|---|
| cg03680873 | −9.47 | 37.39 (5.88) | 46.84 (7.86) | 1.60E-04 | .23 | 3 | 148844300 | R | -- | IGR | Shelf |
| cg20964505 | −8.75 | 64.47 (7.36) | 73.58 (5.73) | 2.09E-04 | .03 | 2 | 131094852 | F | -- | IGR | Opensea |
| cg22031944 | −7.00 | 71.92 (4.18) | 79.10 (4.53) | 9.41E-06 | 2.23 | 15 | 53951454 | F | WDR72 | Body | Opensea |
| cg00841760 | −6.62 | 49.92 (5.55) | 56.92 (4.26) | 1.28E-04 | .38 | 7 | 158362966 | F | PTPRN2 | Body | Island |
| cg13824500 | −6.55 | 65.91 (5.08) | 72.75 (4.12) | 1.58E-04 | .24 | 10 | 114394236 | R | VTI1A | Body | Opensea |
| cg20399086 | −6.45 | 56.86 (3.93) | 63.59 (3.44) | 6.12E-05 | .91 | 2 | 154019910 | R | -- | IGR | Opensea |
| cg26468118 | −6.15 | 50.86 (3.67) | 57.52 (3.78) | 2.11E-06 | 3.28 | 13 | 111175670 | R | RAB20 | 3'UTR | Opensea |
| cg02409479 | −5.78 | 78.37 (3.99) | 84.25 (3.14) | 6.62E-06 | 2.48 | 11 | 20175909 | F | -- | IGR | Shore |
| cg14371609 | −5.54 | 77.72 (4.53) | 83.37 (4.04) | 1.75E-04 | .16 | 11 | 6014401 | F | -- | IGR | Opensea |
| cg03625162 | −5.51 | 62.08 (2.90) | 68.00 (3.96) | 3.38E-05 | 1.33 | 12 | 63688138 | R | -- | IGR | Opensea |
| cg06071637 | −5.46 | 52.48 (3.85) | 58.17 (4.26) | 1.99E-04 | .07 | 11 | 119703538 | R | -- | IGR | Opensea |
| cg06159269 | −5.36 | 84.92 (3.81) | 90.56 (3.01) | 8.47E-06 | 2.31 | 1 | 8767347 | R | RERE | 5'UTR | Shelf |
| cg16229508 | −5.29 | 36.08 (3.86) | 42.21 (3.53) | 2.17E-04 | .01 | 18 | 44135730 | F | LOXHD1 | 5'UTR | Opensea |
| cg03180777 | −5.23 | 73.05 (4.34) | 78.40 (3.18) | 4.90E-05 | 1.07 | 17 | 35195140 | R | -- | IGR | Opensea |
| cg03636183 | −5.23 | 54.59 (3.39) | 60.28 (3.49) | 2.00E-04 | .07 | 19 | 17000585 | R | F2RL3 | Body | Shore |
| cg04140556 | −5.15 | 72.25 (3.35) | 77.62 (3.07) | 1.10E-04 | .49 | 3 | 95911909 | F | -- | IGR | Opensea |
| cg08537845 | −5.09 | 74.08 (3.48) | 79.35 (4.05) | 1.20E-04 | .43 | 5 | 167715532 | R | -- | IGR | Shelf |
| cg02186141 | −5.02 | 56.93 (3.34) | 62.20 (3.42) | 4.20E-05 | 1.18 | 17 | 80864562 | R | TBCD | Body | Shore |
| cg03895593 | −5.02 | 80.78 (4.04) | 85.73 (2.31) | 6.51E-05 | .87 | 1 | 6064094 | R | -- | IGR | Opensea |
| cg17391692 | −5.01 | 51.68 (3.70) | 56.85 (3.70) | 1.67E-04 | .20 | 11 | 62402292 | F | GANAB | Body | Opensea |
C: Normolipaemic control subjects; CHR: Chromosome that contains the CG (Build 38); HT: Hypertriglyceridaemic patients; ID: Unique identifier from the Illumina® GC database; MAPINFO: Coordinates of the CG (Build 38); Strand: Forward (F) or Reverse (R) chain.
We highlight 4 cytosines located in known gene regions.
Hypertriglyceridaemic patients have a 10% decrease in the degree of methylation of the cytosine cg0363636183 which is located in the F2RL3 gene -F2R Like Thrombin or Trypsin Receptor 3. This gene is involved in processes associated with cardiovascular risk, such as platelet activation,18 intimal hyperplasia and inflammation associated with smoking.19 In particular, hypomethylation of this cytosine cg0363636183 measured in blood cell DNA has been associated with an increased risk of cardiovascular mortality beyond the traditional risk factors in two large prospective studies.20,21
We also identified 3 cytosines related to vesicular transport. Hypertriglyceridaemic patients show a 10% decrease in the degree of methylation of cg13824500 located in the VTI1A gene-Vesicle Transport through Interaction with T-SNAREs 1A. This is a limiting gene in the formation of chylomicrons, and more specifically in the transit of chylomicrons through the endoplasmic reticulum to the Golgi apparatus in the enterocyte.22 In sum, the process of chylomicron formation takes place during intestinal lipid absorption. In the endoplasmic reticulum of the cell, pre-chylomicrons are formed by the binding of the synthesising apoB48 to complex lipids from the diet. These pre-alkylomicrons now must reach the Golgi apparatus to mature, and this is a complex and sequential process involving vesicles that fuse and interact with various ligands and receptor proteins in the Golgi complex. The prechylomicrons move through the different cisternae of the complex thanks to the transporting vesicles, and mature acquiring essential proteins and undergoing the necessary modifications until they form the chylomicrons found in the bloodstream.23,24 This process involves the participation of proteins such as SNARE and RAB, among others.
We also found that the cytosine cg26468118, located in the RAB20 gene-Member RAS Oncogene Family, showed a 13% lower degree of methylation in hypertriglyceridaemic subjects. This gene is involved in processes of apical endocytosis and vesicle recycling, and has recently also been linked to the arteriosclerotic process. A paper designed to identify new genes involved in myocardial infarction identified RAB20 as overexpressed in carotid arteriosclerotic plaques.25
Finally, cg21560722 is hypermethylated in hypertriglyceridaemic patients and is located in the SBF2-SET Binding Factor 2-gene, which regulates the expression of several members of the RAB family and regulates SNARE proteins.26 This gene has also recently been identified in a full genome association study associated with the concentration of HDL particles determined by nuclear magnetic resonance in the Women's Genome Health Study cohort.27
We did not find that the other cytosines identified are located in genes or regions that have already been linked to TG metabolism or lipid metabolism in general, or associated with cardiovascular disease or atherosclerosis. Although, pending validation of the present results, we do not rule out the possibility that the role of these cytosines may be relevant, which should be considered in future studies.
In conclusion, these results suggest that there are new genomic regions to consider when we perform the genetic characterisation of subjects with severe hypertriglyceridemias, highlighting the genes related to the formation and maturation of chylomicrons in enterocytes. However, it should be noted that this study has several limitations.
First, these results need to be validated in other larger cohorts to confirm their association and relevance in the management of hypertriglyceridaemia.
Another limitation is that the degree of methylation was determined on DNA extracted from peripheral blood mononuclear cells and we know that the DNA methylation profile and the regulation of gene expression are tissue specific. However, studies have shown that methylation determined in blood cells, used as a potential marker in easily accessible tissue, has some ability to reflect epigenetic effects occurring in target tissues. Nevertheless, we should not rule out some variation if studies are performed in target organs.
We should also bear in mind that we do not know what function these methylations may have. Generally, we know that the greater the cytosine methylation, the greater the repression of gene expression, but it has also been described that DNA methylation in different genomic regions can influence gene regulation in different ways.28
FundingThis study was supported by a 2018 FEA grant for clinicoepidemiological research in arteriosclerosis, and by the Instituto de Salud Carlos III through project PI19/00832 (co-funded by the European Regional Development Fund/European Social Fund. “A way of doing Europe”/“ESF invests in your future”). Cerca Programme/Generalitat de Catalunya.
Conflict of interestsThe authors declare that they have no conflicts of interest.
Please cite this article as: Guardiola M, Ibarretxe D, Plana N, Masana L, Ribalta J. Patrón de metilación en ADN de sujetos hipertrigliceridémicos. Clin Investig Arterioscler. 2022;34:27–32.