


The aim of this study was to measure the cost of treatment of colorectal cancer in the Basque public health system according to the clinical stage.
MethodsWe retrospectively collected demographic data, clinical data and resource use of a sample of 529 patients. For stages I to III the initial and follow-up costs were measured. The calculation of cost for stage IV combined generalized linear models to relate the cost to the duration of follow-up based on parametric survival analysis. Unit costs were obtained from the analytical accounting system of the Basque Health Service.
ResultsThe sample included 110 patients with stage I, 171 with stage II, 158 with stage III and 90 with stage IV colorectal cancer. The initial total cost per patient was 8644 € for stage I, 12675 € for stage II and 13034 € for stage III. The main component was hospitalization cost. Calculated by extrapolation for stage IV mean survival was 1.27years. Its average annual cost was 22403 €, and 24509 € to death. The total annual cost for colorectal cancer extrapolated to the whole Spanish health system was 623.9 million €.
ConclusionsThe economic burden of colorectal cancer is important and should be taken into account in decision-making. The combination of generalized linear models and survival analysis allows estimation of the cost of metastatic stage.
El objetivo de este trabajo fue medir el coste del tratamiento del cáncer colorrectal en un hospital del sistema sanitario público vasco según el estadio clínico.
MétodosSe recogieron de forma retrospectiva variables demográficas, clínicas y uso de recursos de una muestra de 529 pacientes. Para los estadios I a III se midieron los costes iniciales y de seguimiento. El coste del estadio IV combinó los modelos lineales generalizados para relacionar el coste con la duración del seguimiento con el análisis de supervivencia de tipo paramétrico. Los costes unitarios se obtuvieron del sistema de contabilidad analítica del Servicio Vasco de Salud.
ResultadosLa muestra se distribuyó en 110 pacientes en estadio I, 171 en estadio II, 158 en el estadio III y 90 en el estadio IV. El coste total inicial por paciente fue de 8.644 euros (€) en el estadio I, 12.675€ en el estadio II y 13.034€ en el estadio III. El principal componente del coste fue la hospitalización. La supervivencia media calculada por extrapolación para el estadio IV fue de 1,27años. Su coste anual medio fue de 22.403€, y de 24.509€ hasta el fallecimiento. El coste anual total para el tratamiento del cáncer colorrectal extrapolado a toda España fue de 623.900.000€.
ConclusionesLa carga económica del cáncer colorrectal es importante y debe ser tenida en cuenta en la toma de decisiones. La combinación de los modelos lineales generalizados y el análisis de supervivencia para relacionar el coste con el seguimiento permite estimar el coste del estadio metastásico.
Colorectal cancer (CRC) is the third most frequent type of cancer in men, after prostate and lung cancer, and the second most frequent in women after breast cancer.1,2 In the Basque Autonomous Community of Spain, the incidence and mortality have increased significantly since 1986.3,4 The high incidence of CRC and new treatment advances make its cost analysis a relevant topic for funding public healthcare systems.5
Medical care for cancer patients entails high costs in both non-metastatic and metastatic disease. The concentration of costs at the beginning and end of the process determines that its evolution follows a characteristic “U” curve.6,7 In Spain, not many studies about CRC treatment costs have been published.8 However, CRC patient care has changed with the implementation of screening programs, leading to a change in the distribution by cancer stages.9–11 The economic benefit of this diagnostic advancement is measured by the reduction of costs associated with the initial treatment and the lower probability of developing metastases over time. In order to estimate this impact, it is necessary to analyze cost data by stages and resources used. The care profile varies significantly in different European countries, and specific data are required in each country.12 Given the limited external validity of clinical trials, surgical and oncological practice in CRC provide the ideal scenario for measuring costs, which in turn would allow decision-makers to become aware of the economic impact of their decisions in the real world.13,14
The objective of this study was to measure the cost of the healthcare resources used in the Basque public healthcare system for the treatment of CRC, according to clinical stage.
MethodsAn observational, retrospective design was used to analyze the records from administrative and clinical databases of a random sample of 529 patients diagnosed with CRC included in the registry at the Hospital Universitario Araba from 2010 to 2013. The total number of cases in that period was 1228. CRC cases were identified by codes 153.** (colon) and 154.** (rectum) of the International Classification of Diseases Ninth Revision Clinical Modification (ICD-9-CM). The study was approved by the Euskadi Clinical Research Ethics Committee. Criteria for stages I, II, III and IV were taken from the literature.15
Data were collected for demographic variables (age, sex and year of diagnosis), clinical variables (location and stage) and use of resources (hospitalization for surgery and complications of surgery, consultations, hospitalization at home, chemotherapy and radiotherapy). Initial and follow-up costs were measured for stages I to III. Initial costs were defined as those associated with the treatment carried out starting from the moment of diagnosis and any complications. In stage IV, the costs included all resources used in the treatment of the patient from the diagnosis of metastasis until death or the last contact with the healthcare system. The cost of surgery and palliative stents for stage IV CRC was included within the hospitalization costs. Vital status was also recorded at the end of follow-up (living or deceased).
The analysis was conducted from the perspective of the public healthcare system, so only healthcare costs were included.15–17
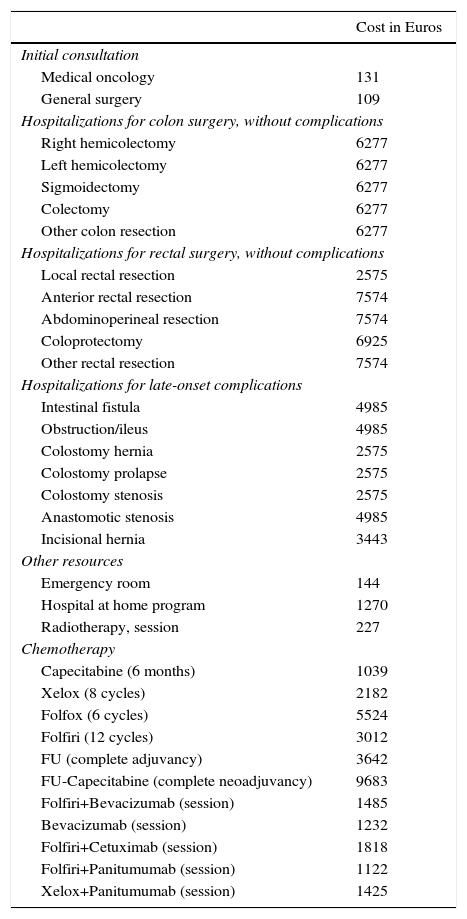
Unit CostsAll unit costs were adjusted for the year 2012 and are shown in Table 1. The costs of the different types of hospitalizations were calculated using the analytical accounting system of the Basque Health Service and the diagnosis-related group (DRG) codes. The unit costs for outpatient consultations (first visit €116, and €58 thereafter), emergency visits (€144), home-based hospitalization (€1270 per episode) and day hospital were obtained from the same accounting system. The pharmacy costs were collected from the database of the financial administration system of the Basque Health Services on January 1, 2012. Furthermore, to calculate the total cost of chemotherapy sessions, to the pharmaceutical costs we added the costs of preparation, the day hospital and the oncological consultation prior to administration. The dose was calculated for a weight of 75kg and a body surface area of 1.8m2. The estimated annual cost of follow-up, including colonoscopy, testing and outpatient consultations, was €450 per year (Appendix B, see technical appendix in Addendum A).
Unit Costs of the Different Resources Used in the Treatment of Colorectal Cancer Obtained From the Analytical Accounting System of the Basque Health Service.
| Cost in Euros | |
|---|---|
| Initial consultation | |
| Medical oncology | 131 |
| General surgery | 109 |
| Hospitalizations for colon surgery, without complications | |
| Right hemicolectomy | 6277 |
| Left hemicolectomy | 6277 |
| Sigmoidectomy | 6277 |
| Colectomy | 6277 |
| Other colon resection | 6277 |
| Hospitalizations for rectal surgery, without complications | |
| Local rectal resection | 2575 |
| Anterior rectal resection | 7574 |
| Abdominoperineal resection | 7574 |
| Coloprotectomy | 6925 |
| Other rectal resection | 7574 |
| Hospitalizations for late-onset complications | |
| Intestinal fistula | 4985 |
| Obstruction/ileus | 4985 |
| Colostomy hernia | 2575 |
| Colostomy prolapse | 2575 |
| Colostomy stenosis | 2575 |
| Anastomotic stenosis | 4985 |
| Incisional hernia | 3443 |
| Other resources | |
| Emergency room | 144 |
| Hospital at home program | 1270 |
| Radiotherapy, session | 227 |
| Chemotherapy | |
| Capecitabine (6 months) | 1039 |
| Xelox (8 cycles) | 2182 |
| Folfox (6 cycles) | 5524 |
| Folfiri (12 cycles) | 3012 |
| FU (complete adjuvancy) | 3642 |
| FU-Capecitabine (complete neoadjuvancy) | 9683 |
| Folfiri+Bevacizumab (session) | 1485 |
| Bevacizumab (session) | 1232 |
| Folfiri+Cetuximab (session) | 1818 |
| Folfiri+Panitumumab (session) | 1122 |
| Xelox+Panitumumab (session) | 1425 |
A report from the Department of Radiotherapy and the accounting system of the Hospital Universitario Araba provided the unit cost of each radiotherapy session (€227) based on activity, investments and staff in 2011.
Statistical AnalysisSince the costs do not follow normal distribution, the Mann–Whitney nonparametric test was applied to compare the median costs of metastatic cancers by location. The correlation of total cost for metastatic CRC with different clinical characteristics was analyzed using generalized linear models (GLM), since cost is a variable that does not follow normal distribution.18,19 GLM are a generalization of least-squares linear regression that allow the response variable to follow non-normal distributions. The type of distribution applied was gamma, with the power function as a link. First, a complete GLM was analyzed with total cost as a dependent variable; death, follow-up, sex, age and location were applied as independent variables. A significance level of 5% was used. Subsequently, in order to calculate lifetime costs, we used a restricted GLM in which total cost was used as the dependent variable and age and follow-up as the independent variables. Stata version 13 statistical software was used for these calculations.
As patient follow-up was a censored variable, a parametric survival analysis was used to extrapolate total life expectancy. The survival function type was selected using the Akaike Information Criterion (AIC).20,21 A statistical significance level of 5% was applied. The statistical software used was Stata version 13.
The total annual cost of CRC incidence was calculated in the Basque Autonomous Community and Spain with Cancer Registry data from 2008. A total of 1941 cases were diagnosed in the Basque Country: 14% in stage I, 28% in stage II, 31% in stage III and 27% in stage IV.4 Stages I–III were multiplied by the initial cost, and a 5-year follow-up was added as well as the cost of the recurrences. This latter cost was calculated by multiplying the probability of recurrence by stage (9.3% for I, 27.2% for II, and 56.1% for III) with the cost of stage IV.22 For stage IV, the lifetime cost was estimated according to mean survival.21 The cost of the incidence in Spain was estimated based on the 21000 cases per year cited in the literature.8
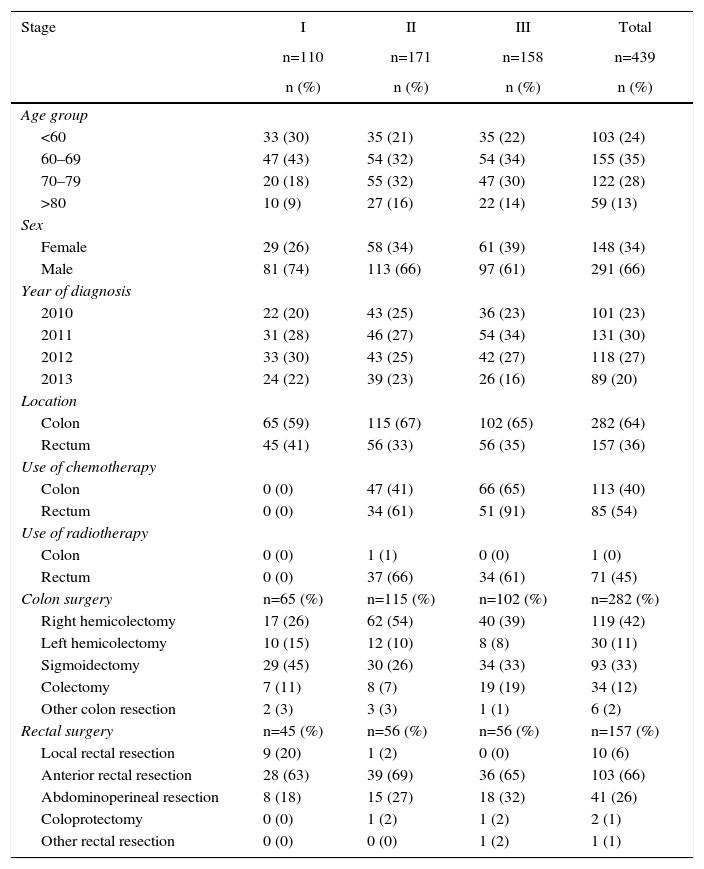
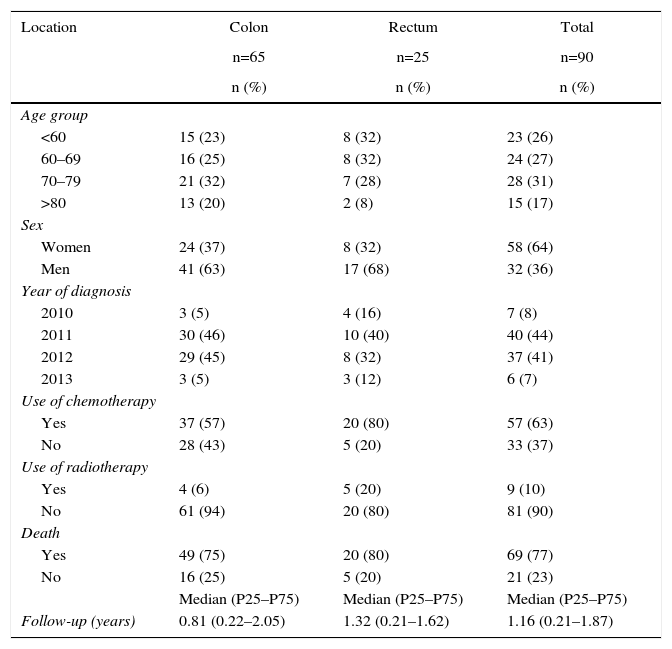
ResultsThe sample included 529 patients, 110 of which were in stage I, 171 in stage II, 158 in stage III, and 90 in stage IV. Table 2 (stages I–III) and Table 3 (stage IV) show the characteristics of and resources used in the sample studied. The median follow-up in stage IV patients was 1.16 years (Q1: 0.21 years; Q3: 1.87 years), during which 75% of these patients had deceased. The cost of follow-up was €450 per year for stages I, II and III.
Characteristics and Resource Use Profile for Metastatic Cancers According to Stage.
| Stage | I | II | III | Total |
|---|---|---|---|---|
| n=110 | n=171 | n=158 | n=439 | |
| n (%) | n (%) | n (%) | n (%) | |
| Age group | ||||
| <60 | 33 (30) | 35 (21) | 35 (22) | 103 (24) |
| 60–69 | 47 (43) | 54 (32) | 54 (34) | 155 (35) |
| 70–79 | 20 (18) | 55 (32) | 47 (30) | 122 (28) |
| >80 | 10 (9) | 27 (16) | 22 (14) | 59 (13) |
| Sex | ||||
| Female | 29 (26) | 58 (34) | 61 (39) | 148 (34) |
| Male | 81 (74) | 113 (66) | 97 (61) | 291 (66) |
| Year of diagnosis | ||||
| 2010 | 22 (20) | 43 (25) | 36 (23) | 101 (23) |
| 2011 | 31 (28) | 46 (27) | 54 (34) | 131 (30) |
| 2012 | 33 (30) | 43 (25) | 42 (27) | 118 (27) |
| 2013 | 24 (22) | 39 (23) | 26 (16) | 89 (20) |
| Location | ||||
| Colon | 65 (59) | 115 (67) | 102 (65) | 282 (64) |
| Rectum | 45 (41) | 56 (33) | 56 (35) | 157 (36) |
| Use of chemotherapy | ||||
| Colon | 0 (0) | 47 (41) | 66 (65) | 113 (40) |
| Rectum | 0 (0) | 34 (61) | 51 (91) | 85 (54) |
| Use of radiotherapy | ||||
| Colon | 0 (0) | 1 (1) | 0 (0) | 1 (0) |
| Rectum | 0 (0) | 37 (66) | 34 (61) | 71 (45) |
| Colon surgery | n=65 (%) | n=115 (%) | n=102 (%) | n=282 (%) |
| Right hemicolectomy | 17 (26) | 62 (54) | 40 (39) | 119 (42) |
| Left hemicolectomy | 10 (15) | 12 (10) | 8 (8) | 30 (11) |
| Sigmoidectomy | 29 (45) | 30 (26) | 34 (33) | 93 (33) |
| Colectomy | 7 (11) | 8 (7) | 19 (19) | 34 (12) |
| Other colon resection | 2 (3) | 3 (3) | 1 (1) | 6 (2) |
| Rectal surgery | n=45 (%) | n=56 (%) | n=56 (%) | n=157 (%) |
| Local rectal resection | 9 (20) | 1 (2) | 0 (0) | 10 (6) |
| Anterior rectal resection | 28 (63) | 39 (69) | 36 (65) | 103 (66) |
| Abdominoperineal resection | 8 (18) | 15 (27) | 18 (32) | 41 (26) |
| Coloprotectomy | 0 (0) | 1 (2) | 1 (2) | 2 (1) |
| Other rectal resection | 0 (0) | 0 (0) | 1 (2) | 1 (1) |
Characteristics and Resource Use Profile for Metastatic Cancers According to Location.
| Location | Colon | Rectum | Total |
|---|---|---|---|
| n=65 | n=25 | n=90 | |
| n (%) | n (%) | n (%) | |
| Age group | |||
| <60 | 15 (23) | 8 (32) | 23 (26) |
| 60–69 | 16 (25) | 8 (32) | 24 (27) |
| 70–79 | 21 (32) | 7 (28) | 28 (31) |
| >80 | 13 (20) | 2 (8) | 15 (17) |
| Sex | |||
| Women | 24 (37) | 8 (32) | 58 (64) |
| Men | 41 (63) | 17 (68) | 32 (36) |
| Year of diagnosis | |||
| 2010 | 3 (5) | 4 (16) | 7 (8) |
| 2011 | 30 (46) | 10 (40) | 40 (44) |
| 2012 | 29 (45) | 8 (32) | 37 (41) |
| 2013 | 3 (5) | 3 (12) | 6 (7) |
| Use of chemotherapy | |||
| Yes | 37 (57) | 20 (80) | 57 (63) |
| No | 28 (43) | 5 (20) | 33 (37) |
| Use of radiotherapy | |||
| Yes | 4 (6) | 5 (20) | 9 (10) |
| No | 61 (94) | 20 (80) | 81 (90) |
| Death | |||
| Yes | 49 (75) | 20 (80) | 69 (77) |
| No | 16 (25) | 5 (20) | 21 (23) |
| Median (P25–P75) | Median (P25–P75) | Median (P25–P75) | |
| Follow-up (years) | 0.81 (0.22–2.05) | 1.32 (0.21–1.62) | 1.16 (0.21–1.87) |
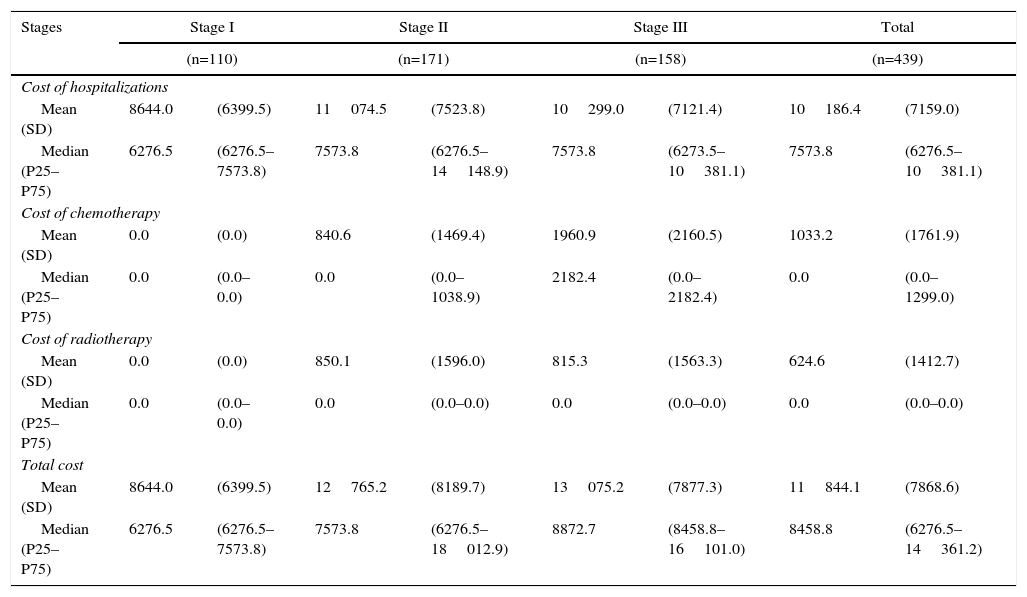
Table 4 demonstrates the treatment costs of stage I–III patients, broken down by the different healthcare resources. The total cost per patient ranged from €8644 in stage I to €12765 for stage II and €13075 for stage III. The main cost component was surgery-related hospitalization.
Initial Costs per Patient With Non-Metastatic Cancer, by Stage.
| Stages | Stage I | Stage II | Stage III | Total | ||||
|---|---|---|---|---|---|---|---|---|
| (n=110) | (n=171) | (n=158) | (n=439) | |||||
| Cost of hospitalizations | ||||||||
| Mean (SD) | 8644.0 | (6399.5) | 11074.5 | (7523.8) | 10299.0 | (7121.4) | 10186.4 | (7159.0) |
| Median (P25–P75) | 6276.5 | (6276.5–7573.8) | 7573.8 | (6276.5–14148.9) | 7573.8 | (6273.5–10381.1) | 7573.8 | (6276.5–10381.1) |
| Cost of chemotherapy | ||||||||
| Mean (SD) | 0.0 | (0.0) | 840.6 | (1469.4) | 1960.9 | (2160.5) | 1033.2 | (1761.9) |
| Median (P25–P75) | 0.0 | (0.0–0.0) | 0.0 | (0.0–1038.9) | 2182.4 | (0.0–2182.4) | 0.0 | (0.0–1299.0) |
| Cost of radiotherapy | ||||||||
| Mean (SD) | 0.0 | (0.0) | 850.1 | (1596.0) | 815.3 | (1563.3) | 624.6 | (1412.7) |
| Median (P25–P75) | 0.0 | (0.0–0.0) | 0.0 | (0.0–0.0) | 0.0 | (0.0–0.0) | 0.0 | (0.0–0.0) |
| Total cost | ||||||||
| Mean (SD) | 8644.0 | (6399.5) | 12765.2 | (8189.7) | 13075.2 | (7877.3) | 11844.1 | (7868.6) |
| Median (P25–P75) | 6276.5 | (6276.5–7573.8) | 7573.8 | (6276.5–18012.9) | 8872.7 | (8458.8–16101.0) | 8458.8 | (6276.5–14361.2) |
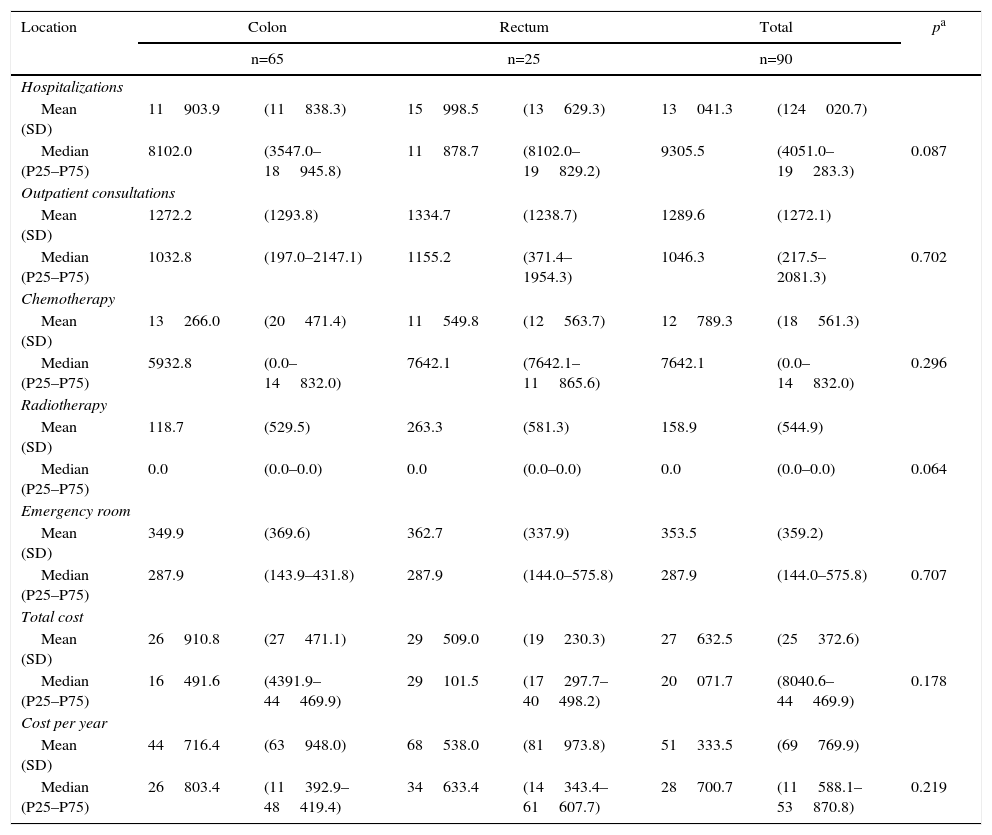
The treatment costs for metastatic patients are shown in Table 5 according to location and cost components. Likewise, in this stage, hospitalizations generated the majority of the cost, although the difference is that they mainly included nonsurgical hospitalizations.
Costs per Patients With Metastatic Cancers According to Location.
| Location | Colon | Rectum | Total | pa | |||
|---|---|---|---|---|---|---|---|
| n=65 | n=25 | n=90 | |||||
| Hospitalizations | |||||||
| Mean (SD) | 11903.9 | (11838.3) | 15998.5 | (13629.3) | 13041.3 | (124020.7) | |
| Median (P25–P75) | 8102.0 | (3547.0–18945.8) | 11878.7 | (8102.0–19829.2) | 9305.5 | (4051.0–19283.3) | 0.087 |
| Outpatient consultations | |||||||
| Mean (SD) | 1272.2 | (1293.8) | 1334.7 | (1238.7) | 1289.6 | (1272.1) | |
| Median (P25–P75) | 1032.8 | (197.0–2147.1) | 1155.2 | (371.4–1954.3) | 1046.3 | (217.5–2081.3) | 0.702 |
| Chemotherapy | |||||||
| Mean (SD) | 13266.0 | (20471.4) | 11549.8 | (12563.7) | 12789.3 | (18561.3) | |
| Median (P25–P75) | 5932.8 | (0.0–14832.0) | 7642.1 | (7642.1–11865.6) | 7642.1 | (0.0–14832.0) | 0.296 |
| Radiotherapy | |||||||
| Mean (SD) | 118.7 | (529.5) | 263.3 | (581.3) | 158.9 | (544.9) | |
| Median (P25–P75) | 0.0 | (0.0–0.0) | 0.0 | (0.0–0.0) | 0.0 | (0.0–0.0) | 0.064 |
| Emergency room | |||||||
| Mean (SD) | 349.9 | (369.6) | 362.7 | (337.9) | 353.5 | (359.2) | |
| Median (P25–P75) | 287.9 | (143.9–431.8) | 287.9 | (144.0–575.8) | 287.9 | (144.0–575.8) | 0.707 |
| Total cost | |||||||
| Mean (SD) | 26910.8 | (27471.1) | 29509.0 | (19230.3) | 27632.5 | (25372.6) | |
| Median (P25–P75) | 16491.6 | (4391.9–44469.9) | 29101.5 | (17297.7–40498.2) | 20071.7 | (8040.6–44469.9) | 0.178 |
| Cost per year | |||||||
| Mean (SD) | 44716.4 | (63948.0) | 68538.0 | (81973.8) | 51333.5 | (69769.9) | |
| Median (P25–P75) | 26803.4 | (11392.9–48419.4) | 34633.4 | (14343.4–61607.7) | 28700.7 | (11588.1–53870.8) | 0.219 |
The parametric survival analysis of metastatic cancers determined that the Weibull distribution was best suited to extrapolate total mean survival, which is shown along with the Kaplan–Meyer curve in Fig. 1. A large model was initially constructed with the parameters for age, death, location and sex, which estimated an average survival of 1.30 years. Although age was a significant variable, location, death, and sex were not significant. Consequently, we limited the variables included in the model to age, which had remained significant. With this restricted model, mean survival calculated by extrapolation was 1.27 years (Table 6).

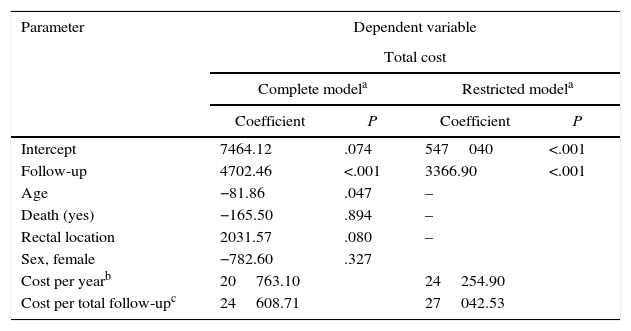
Results of the Generalized Linear Regression Models With Total Cost in Patients With Metastasis as a Dependent Variable.
| Parameter | Dependent variable | |||
|---|---|---|---|---|
| Total cost | ||||
| Complete modela | Restricted modela | |||
| Coefficient | P | Coefficient | P | |
| Intercept | 7464.12 | .074 | 547040 | <.001 |
| Follow-up | 4702.46 | <.001 | 3366.90 | <.001 |
| Age | −81.86 | .047 | – | |
| Death (yes) | −165.50 | .894 | – | |
| Rectal location | 2031.57 | .080 | – | |
| Sex, female | −782.60 | .327 | ||
| Cost per yearb | 20763.10 | 24254.90 | ||
| Cost per total follow-upc | 24608.71 | 27042.53 | ||
When the total cost of patients in stage IV was correlated to the different variables using GLM models, statistically significant differences only appeared in the follow-up (Table 6). Therefore, a model restricted to the follow-up variable was constructed in order to calculate the average annual cost per patient, which was €24254.90. The average total cost from diagnosis to death was €27042.50.
When these results were extrapolated to the incidence reported in the literature, the cost of the incidence of CRC in the Basque Autonomous Community of Spain in 2012 was 49 million euros, and the global total for Spain reached 986 million euros.
DiscussionFor the first time, this study estimates the cost of CRC treatment at hospitals of the Spanish national healthcare system, broken down by stage and based on the profile of resources used in standard clinical practice. In addition, this article provides a novel methodology for calculating the cost of care for patients with metastatic cancers. Our approach combines GLM to correlate costs with the length of follow-up and a parametric survival analysis to calculate mean survival of the sample despite partial follow-up. Although the sample studied comes from a single hospital, we believe that the cost results can be extrapolated to all Basque public hospitals given the homogeneity of salary conditions in the Basque Health Service and the common criteria coordinated by the Basque Cancer Advisory Council, created in 2006. Cost estimates for incidence as well as longitudinal estimates of medical costs after the disease diagnosis are useful for informing decision-makers in terms of the allocation of resources and implementation of specific treatments.23,24
The comparison of these results with the literature identifies differences according to whether the studies have been carried out in Europe or the United States. European studies consistently give cost figures similar to our study, which are clearly lower than estimates from the United States.25,26 For stages I–III in the United States, treatment costs reach approximately $28000, $38000 and $46000.7,27 For metastatic cancer, a Dutch study gives a figure of €24000, similar to ours, while the US expenditure is much higher at $41562.7,25 The higher costs in the United States are due to a clinical practice with greater use of resources as well as higher unit costs than in Europe.
One limitation of our study is not having differentiated the unit cost according to surgical technique (open or laparoscopic), which is a relevant result from the standpoint of evaluating technological advances. Since our objective was not to define costs by surgical technique but instead the burden of CRC treatment per stage, we believe that the calculated unit cost is the average cost of the surgical hospitalization process.
In the literature, the same method is usually used to calculate the treatment costs of all stages. In this study, this method has been applied for stages I, II and III because they follow a fairly homogenous pattern due to the weight of the initial surgery. In contrast, the cost of stage IV shows great individual variations throughout the follow-up according to age, type of metastasis, comorbidity, degree of tumor extension and patient survival. Therefore, the cost has been determined by statistical analyses based on follow-up. The advantage of our approach is that it enables us to correlate costs with the follow-up, which usually varies depending on patient mortality among the different studies and among the different patients within each study. On the one hand, GLM allow us to treat cost as a dependent variable, thereby solving the problem of the lack of normal distribution.18 Just as the treatment cost of patients in stages I to III has an initial cost peak, the cost of patients with metastases is best described with a longitudinal approach because they require a consumption of resources that is maintained over time. Consequently, its analysis does not reproduce the U-shaped curve, and it is best described by applying statistical techniques.
The financial burden of CRC treatment at the national level reported in this article (€986 million) is very important and should be taken into account in the decision-making process.28 It is relevant to the budget of the national healthcare system, and the distribution of costs among the different cancer stages should also be understood. In Spain, CRC screening has not been extended to the population as a whole because of limited resources. At the same time, the budgetary impact of new drugs for the treatment of metastatic CRC will be a barrier for patient access. Given the need to make decisions to incorporate primary, secondary and tertiary prevention interventions in the national healthcare system, the resources available should be allocated to maximize health benefits.16,17 Since screening allows CRC to be diagnosed in earlier stages, it reduces the cost of advanced cases. The higher the unit cost of these treatments, the greater the financial savings and impact of screening.6 On the one hand, our results provide data for future cost-effectiveness studies to analyze the efficiency of new treatments for metastatic CRC. At the same time, they can be used to evaluate current screening programs and draw conclusions about their extension to all the autonomous communities of Spain.
Access to InformationThe study was approved by the Clinical Research Ethics Committee of the Spanish Basque Country and has followed the protocols established by the respective medical centers to access the data from clinical records in order to be able to carry out this research/information publication for the medical community.
FundingThis study was completed with the resource of the departments involved and has received no public or private funding.
Conflict of InterestThe authors have no conflict of interest.
The following are the supplementary data to this article:
Please cite this article as: Mar J, Errasti J, Soto-Gordoa M, Mar-Barrutia G, Martinez-Llorente JM, Domínguez S, et al. Valoración del coste económico del cáncer colorrectal según estadio tumoral. Cir Esp. 2017;95:89–96.
