


Trauma is a major cause of morbidity and mortality; hence severity scales are important adjuncts to trauma care in order to characterise the nature and extent of injury. Trauma scoring models can assist with triage and help in evaluation and prediction of prognosis in order to organise and improve trauma systems. Given the wide variety of scoring instruments available to assess the injured patient, it is imperative that the choice of the severity score accurately match the application. Even though trauma scores are not the key elements of trauma treatment, they are however, an essential part of improvement in triage decisions and in identifying patients with unexpected outcomes. This article provides the reader with a compendium of trauma severity scales along with their predicted death rate calculation, which can be adopted in order to improve decision making, trauma care, research and in comparative analyses in quality assessment.
El traumatismo es una de las principales causas de morbimortalidad, por lo cual las escalas de severidad son herramientas importantes de cuidados intensivos para determinar la naturaleza y magnitud de la lesión. Los modelos de valoración de gravedad pueden definir la prioridad y ayudar en la evaluación y pronóstico del traumatismo, contribuyendo a la organización y mejora de los centros para traumatismos. Aunque los índices de valoración del traumatismo no son los elementos clave en el tratamiento del mismo, son una parte esencial para una mejor decisión de priorización y para identificar mejor a los pacientes con resultados inesperados. Este artículo ofrece al lector un compendio de escalas de gravedad de traumatismos y tasa de mortalidad asociada a cada una de ellas. Estos sistemas de puntuación pueden ser utilizados para mejorar la toma de decisiones, los cuidados intensivos, la investigación y en el análisis comparativo de la calidad de las evaluaciones.
Trauma is a major cause of morbidity and mortality. The survival probability of patients with trauma injuries generally depends on differences in therapeutic results or differences in age or injury severity. Considering such differences, trauma scoring systems have been developed, as instruments designed to quantify trauma severity and estimate the survival probability.1 For more than 30 years, several methods have been suggested and implemented with a view to quantifying injury severity. Almost all trauma scores try to convert injury severity into a number. Trauma severity measurement or tabulation is a very important step for the treatment of these patients, which results in effective care and also makes clinical research easier.2 In addition, it may facilitate trauma care triage, and help in evaluation and prediction of prognosis, in order to organise and improve trauma care systems, thus saving time, health care costs and, above all, preventing deaths. Severity classifications may be nominal (when verbal definitions are used to categorise trauma according to different severity levels), ordinal (when a number is assigned to each different severity status) or interval-based (when numbers are assigned, but there is a certain consistency among intervals).2 A scoring system usually consists of two parts: a score (which is a number assigned to the severity of a disease) and a probability model (which is an equation indicating a probability of in-patient death). Models can improve the ability to use scores or scales to compare groups of patients for treatment, triage or comparative analysis purposes.2 An accurate scoring model should have a high predictive power from the very first day. A true logistic score should be calculated according to the well-known and established formula used for this purpose, such as, for example, the logistic EuroSCORE, which provides a direct risk of mortality in percentage and not in score points. This formula is as follows: predicted mortality=exp (β0+β1*x1+β2*x2+…+βi*xi)/(1+exp [β0+β1*x1+β2*x2+…+βi*xi]) where β0 is the constant of the logistic regression equation and βi is the coefficient of a variable. The value of xi is 1 when the variable is present and 0 when it is absent.3 A logistic scoring model is appropriate for use, since it is not limited to certain cut-off values or thresholds. Therefore, for different severity levels, it can be calculated with specific β coefficients, also considering age as a factor on some occasions. From a theoretical point of view, it has been stated that an ideal model should be well validated, calibrated and discriminated. “Validity” is the term usually used to assess the performance of the prediction model through the data set analysis used to create the model (development data). Validity may be internal (new samples of development data obtained by bootstrapping techniques when multiple samples of the same size as that of the development data are collected to replace them) or external (sample of new patients, treated either more recently or in another site). “Calibration” assesses the accuracy of the matching degree between the estimated probabilities of mortality provided by a model and the mortality actually recorded in patients. It may be statistically assessed by goodness-of-fit tests.4 “Discrimination” consists of the ability of the model to differentiate between survivors and non-survivors, based on the estimated probabilities of mortality. Discrimination measures are sensitivity, specificity, false positive rate, false negative rate, positive predictive power, classification error rate, area under the receiver operating characteristic curve and concordance; the latter is frequently used as a discrimination measure.2 Conversion of a (severity) score into a probability of in-patient death employs a logistic regression equation. Trauma scores may be anatomical (using scores that indicate anatomical injury severity, for example, the Abbreviated injury scale (AIS), Injury severity score (ISS), the Anatomic profile (AP) characterisation, the New injury severity score (NISS), etc.), physiologic scores or scales (measuring the injury acute dynamic component, for example, Trauma score (TS), Revised trauma score (RTS), etc.) or combined scores or models, for example, Trauma score-injury severity score (TRISS) and A severity characterisation of trauma (ASCOT). Trauma severity scoring systems may be used in different health care contexts for trauma patients, and, therefore, it is essential that the choice of severity scoring scale, rate or model is the right one for the disorder, context or implementation, since an inadequate implementation of these systems may result in a waste of time and unjustified costs, and may lead to extrapolations and even death.
Data used for this review were identified by means of MEDLINE, Current Contents, PubMed searches and the literature of relevant articles, with the use of the following search terms: trauma scoring systems, Glasgow coma score, Abbreviated injury scale, Injury severity score, Revised trauma score, Trauma score-injury severity score, Paediatric trauma score and A severity characterisation of trauma. Only articles published in English from 1971 to 2012 were included.
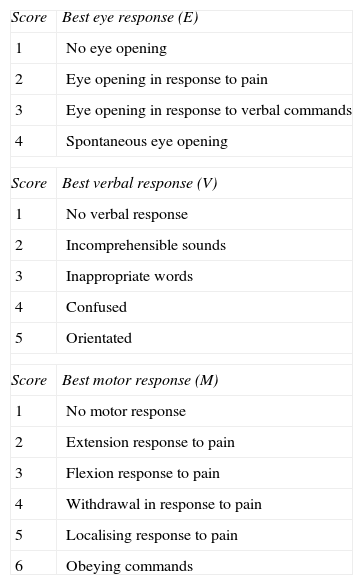
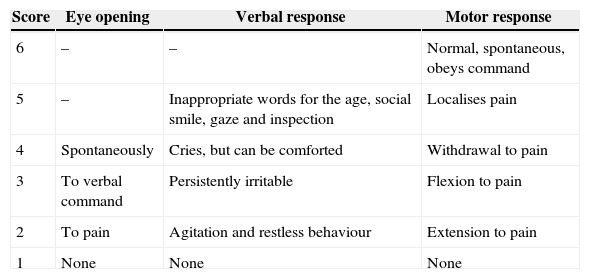
Trauma ScalesGlasgow Coma ScoreThe Glasgow coma score (GCS)5 (Table 1) is a worldwide instrument for rapid assessment of the level of consciousness of a trauma patient. The GCS is widely used as a parameter to determine traumatic brain injury severity.6 Several studies have proved that there exists a good correlation between the GCS and the neurological outcomes.7,8 In a study about the clinimetric properties of the GCS, conducted by Prasad,9 the scale has shown good sensitivity and feasibility and has a well-established cross-sectional construct validity; its predictive validity in traumatic coma, when combined with age and brainstem reflexes, has not been evaluated in an external validation sample, but has shown to be good in the sample used to generate it (sensitivity: 79%–97%; specificity: 84%–97%). The author reached the conclusion that this scale represents a well-established discriminatory instrument, but that its validity as a prediction and assessment instrument has not been studied yet.9 Grote et al.10 did research on the diagnostic value of the GCS in order to identify severe traumatic brain injuries (TBI) in 18002 adult patients with severe multiple trauma, whose ISS was >16. The authors observed that the GCS (defined as a value ≤8) in unconscious patients with multiple trauma shows a moderate correlation with the diagnosis of a severe TBI. A modified verbal and motor version has been created to facilitate the assessment of the level of consciousness in infants and children11,12 (Table 2).
Glasgow Coma Score (GCS).
| Score | Best eye response (E) |
| 1 | No eye opening |
| 2 | Eye opening in response to pain |
| 3 | Eye opening in response to verbal commands |
| 4 | Spontaneous eye opening |
| Score | Best verbal response (V) |
| 1 | No verbal response |
| 2 | Incomprehensible sounds |
| 3 | Inappropriate words |
| 4 | Confused |
| 5 | Orientated |
| Score | Best motor response (M) |
| 1 | No motor response |
| 2 | Extension response to pain |
| 3 | Flexion response to pain |
| 4 | Withdrawal in response to pain |
| 5 | Localising response to pain |
| 6 | Obeying commands |
A coma score of 13 or higher correlates with a mild brain injury, 9–12 is a moderate injury, and 8 or less is a severe brain injury.
Paediatric Glasgow Coma Score.
| Score | Eye opening | Verbal response | Motor response |
|---|---|---|---|
| 6 | – | – | Normal, spontaneous, obeys command |
| 5 | – | Inappropriate words for the age, social smile, gaze and inspection | Localises pain |
| 4 | Spontaneously | Cries, but can be comforted | Withdrawal to pain |
| 3 | To verbal command | Persistently irritable | Flexion to pain |
| 2 | To pain | Agitation and restless behaviour | Extension to pain |
| 1 | None | None | None |
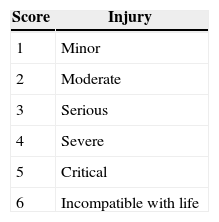
The Abbreviated injury scale (AIS) (Table 3), published by the Committee on Medical Aspects of Automotive Safety of the American Medical Association in 1971 to provide safety data to engineers working on automotive design, includes an initial set of 73 non-penetrating injuries.13 A severity level ranging from 1 to 6 was assigned to each traumatic injury. However, this system only offers an approximate planning and the associated increase in mortality is not linear.14 In spite of the fact that the AIS describes the anatomic injury, it shows a certain lack of internal consistency; for example, the score of 5 in the head is a different outcome from the score of 5 in the abdomen, and the interval between a score of 2 and 3 or between a score of 3 and 4 also varies from one part of the body to the other.2 However, the AIS sets the basis for the calculation of other trauma scores.
Abbreviated Injury Scale (AIS).
| Score | Injury |
|---|---|
| 1 | Minor |
| 2 | Moderate |
| 3 | Serious |
| 4 | Severe |
| 5 | Critical |
| 6 | Incompatible with life |
Injuries are ranked according to a scale ranging from 1 to 6, where 1 is a minor injury and 6 corresponds to an injury which is incompatible with life. This represents a “life-threatening” condition associated with the injury.
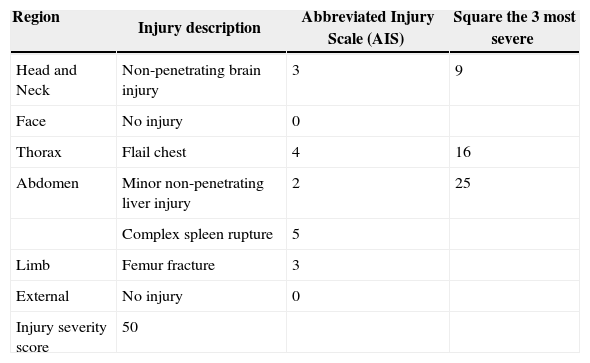
The Injury severity score (ISS) was published for the first time in 1974 by Baker et al.15 The ISS (Table 4) is based on an anatomic classification of injury severity of the AIS, combining the severity levels in a single value which is correlated with the outcomes.14 The ISS, a scoring system which is commonly used in traumatology,7 has values ranging from 0 to 75, and increases with severity (the higher the score, the higher the injury severity, and, therefore, the higher the mortality). To establish the ISS, an AIS score is assigned to each injury and only the highest AIS score of each body region is used to calculate the ISS. Scores corresponding to the three body regions with the most severe injuries are squared and added to obtain the ISS; and, therefore, the ISS consists of the sum of the squares of the highest degrees of AIS of each of the three body regions which have suffered the most severe injuries. In the case of a level 6 injury, an ISS of 75 is automatically assigned to the patient. An ISS of 16 or higher tends to be considered as polytrauma. Some studies have considered the ISS not to be a good prediction tool, even in the case of severe injuries.16 In others, a good outcome has been observed as a predictor of poor prognosis.17–19 Several ISS limitations have been identified, most of which are due to the use of a one-dimensional scoring to represent the different types of injury sites and severity levels. The presence of multiple injuries in one body region, for example, gunshot wounds, or the differences in severity between the different regions are not taken into account. Thus, it does not provide a reliable basis to characterise injury severity and tends to overestimate or underestimate outcome variability. But, despite the fact that the ISS has been created by means of a combination of intuition, experimentation and opportunity,20 it does not meet one of the main scoring targets, which consists of establishing a common language to improve communication in research and clinical practice.14Tables 4–7 show a simple calculation example of the different trauma scores.
Injury Severity Score (ISS).
| Region | Injury description | Abbreviated Injury Scale (AIS) | Square the 3 most severe |
|---|---|---|---|
| Head and Neck | Non-penetrating brain injury | 3 | 9 |
| Face | No injury | 0 | |
| Thorax | Flail chest | 4 | 16 |
| Abdomen | Minor non-penetrating liver injury | 2 | 25 |
| Complex spleen rupture | 5 | ||
| Limb | Femur fracture | 3 | |
| External | No injury | 0 | |
| Injury severity score | 50 |
The Injury severity score (ISS) ranges from 0 to 75, and escalates as severity increases. If an injury is assigned with an AIS of 6 (incompatible-with-life injury) an ISS of 75 is automatically established.
The example included herein below will allow for a better understanding of the trauma score calculation.
A 40-year-old male subject suffered a blunt trauma as a result of a car accident and was immediately taken to the Emergency Room. On baseline examination, the patient was conscious and opened his eyes spontaneously, but seemed to be confused. The patient did not properly obey verbal commands, but was able to localise pain. His heart rate was 120/min, his blood pressure was 86/54 and his respiratory rate was 40/min. He had suffered a right patella fracture and the abdomen was tender on palpation; the abdominal ultrasound identified a splenic laceration; the chest X-ray and the thoracic ultrasound showed the presence of a non-penetrating bilateral flail chest; the head computed tomography scan showed a large non-penetrating brain injury. Thus, the patient's condition was summarised as follows:
- (1)
Glasgow coma score: 13.
- (2)
Injury
- -
Abdomen: spleen laceration=AIS-2.
- -
Thorax: bilateral pulmonary non-penetrating injury=AIS-3, bilateral flail chest=AIS-5.
- -
Head: non-penetrating brain injury, large=AIS-4.
- -
Limb: right patella=AIS-2.
As a result, ISS=52+42+22=45 (sum of the squares of 3 body regions).
New injury severity score=32+52+42=50 (calculated by means of the sum of the squares of the 3 highest scores, regardless of the part of the body where they are located).
One of the main inconveniences of ISS is that it does not consider the presence of multiple injuries in one body region. The Anatomic profile (AP) characterisation was created to mitigate the ISS limitations. It employs four variables to describe the injury anatomic pattern: A=severe injuries (AIS≥3) in the head, the brain or the spinal cord; B=severe injuries (AIS≥3) in the thorax or the anterior part of the neck; C=severe injuries (AIS≥3) in all the remaining body regions (abdomen, pelvis, limbs, etc.) and D=all minor or moderate injuries (AIS≤2). Scores are combined with the use of a Euclidean distance model, i.e., the square root of the sum of squares √A2+B2+C2+D2, which enables a reduction in the influence of injuries while increasing the number thereof.2 Therefore, probabilities of survival may be estimated by means of multiple logistic regressions. The maximum AP (mAP) doubles the maximum score of the AIS, which enables its dominant effect in the case of multiple injuries.2,21 However, the AP implementation complexity hinders a wide acceptance of this index.
New Injury Severity ScoreThe ISS allows documenting only one injury per body region (the most severe), and therefore, confusion is created among patients who have suffered multiple injuries in a single part of the body. The New injury severity score (NISS) was developed to overcome some of the ISS inconveniences and enabled the consideration of severe injuries in multiple body regions.20 In the NISS, only scores corresponding to the three most severe injuries are squared and added regardless of the part of the body they affect.20 The ISS and NISS system accuracy to predict the need for intubation, mechanical ventilation and its duration in 110 trauma patients admitted to an intensive care unit was validated in a study conducted by Honarmand and Safavi.22 These authors observed that to predict the need for intubation and mechanical ventilation, the NISS is more accurate than the ISS. This simple, but effective ISS improvement shall require further study. A simple example is included below to better understand the difference between the ISS and the NISS.
A patient who has suffered a car accident shows blunt abdominal trauma. After the main diagnostic tests, the patient is immediately taken to the operating theatre to undergo a laparotomy where a small intestinal perforation (AIS score=3) is first found. Thus, the ISS is 9 (32), as is the NISS. In a closer examination, a moderate liver laceration is discovered (AIS score=3). The ISS is still 9 (32), but the NISS increases to 18 (32+32). Next, a moderate pancreatic laceration is observed, with compromise of the pancreatic duct (AIS score=3). The ISS is still 9 (32), whereas the NISS increases again to 27 (32+32+32). Then, a urinary bladder perforation is discovered (AIS score=4). The ISS is now 16 (42) and the NISS continues to increase to 34 (42+32+32). Therefore, the NISS behaves in a way which is more consistent with the surgeon's criteria and instinct than the ISS; its logic is simple: as the number of injuries increases, death becomes more likely, even when these injuries are in a single body region.
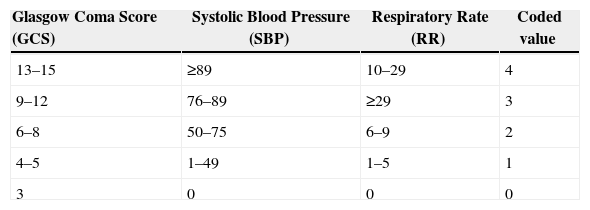
Trauma Score/Revised Trauma ScoreThe Trauma score (TS)23 measures the trauma acute dynamic component and includes five variables: GCS, respiratory rate (RR), respiratory effort, systolic blood pressure (SBP) and capillary refill. The TS values range from 16 (the best) to 1 (the worst) and are calculated by adding the scores assigned to each variable. In 1989, the same group of authors introduced a new revised version of the TS, the Revised trauma score (RTS) (Table 5), based on the analysis of more than 2000 cases.24 The RTS incorporates three items: GCS, RR and SBP. Respiratory effort and capillary refill were removed due to the problems related to a valid assessment in usual practice.14 It was also observed that the TS underestimated disease severity in some patients with traumatic brain injury (i.e., weighting given to the GCS was not enough).2 The RTS is calculated using the coded values (0–4) of GCS, SBP and RR. Regression weighing factors were obtained for the coded RTS variables, using the data of the patients included in the Major trauma outcome study.25 These weighting factors were the following: GCS 0.9368/SBP 0.7326/RR 0.2908.2 The weighting factor assigned to the GCS shows the importance of coma to predict patients’ progress.2 The RTS values range from 0 to 7.8408. Outcome evaluation was thus made by means of logistic regression analysis (see Table 5). Regarding outcome evaluation and survival prediction, the RTS has proved to be as satisfactory as the TS, with the use of less information.24 In fact, the ISS and the RTS were better than what the hypothesis stated in terms of their mortality predictive value.26
Revised Trauma Score (RTS).
| Glasgow Coma Score (GCS) | Systolic Blood Pressure (SBP) | Respiratory Rate (RR) | Coded value |
|---|---|---|---|
| 13–15 | ≥89 | 10–29 | 4 |
| 9–12 | 76–89 | ≥29 | 3 |
| 6–8 | 50–75 | 6–9 | 2 |
| 4–5 | 1–49 | 1–5 | 1 |
| 3 | 0 | 0 | 0 |
Regression weighting factors were obtained for the coded RTS variables and the RTS was calculated as follows: RTS=0.9368 GCS+0.7326 SBP+0.2908 RR. The RTS values range from 0 to 7.8408. Outcome evaluation was thus made by means of logistic regression analysis, where scores may directly be converted into a probability of survival P using the logistic equation P=1/(1+e−RTS+3.5718) (in which the Euler's constant 2.7182818 is indicated, i.e., the base of natural logarithms).2,14
Using the example shown in Table 4, the RTS may be calculated, with the regression weighting factors assigned and the coded values for GCS, SBP and RR, as follows:
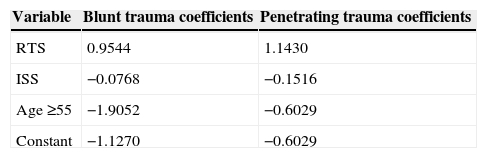
In 1987 Boyd et al.27 summarised the methodology of the Trauma and injury severity score (TRISS) (Table 6) by means of the combination of the injury anatomic pattern and the physiological response to such injuries. Then, it was observed that age has a significant influence on the probability of survival, probably due to the cardiovascular compromise associated with ageing.14Table 6 shows the coefficients and formula for the calculation of the TRISS from the RTS, ISS and age data. The calculated TRISS values range from 0 to 1, and this may be directly interpreted as the estimated probability of survival. Apart from the ISS, the TRISS is currently the most commonly used trauma score.
Trauma Score-injury Severity Score (TRISS) Coefficients and Formula for TRISS Methodology.
| Variable | Blunt trauma coefficients | Penetrating trauma coefficients |
|---|---|---|
| RTS | 0.9544 | 1.1430 |
| ISS | −0.0768 | −0.1516 |
| Age ≥55 | −1.9052 | −0.6029 |
| Constant | −1.1270 | −0.6029 |
ISS, injury severity score; RTS, revised trauma score.
For the calculation, the ISS, the RTS and the patient's age (age ≥55)=1 for patients aged 55 years or older and 0 in another case are required.
Paediatric cases (ages <15) use the blunt trauma model for both non-penetrating and penetrating injury mechanisms.
For blunt trauma:
The logit X=0.9544*RTS+(−0.0768*ISS)+(–1.9052*age ≥55)+(−1.1270)
TRISS (predicted mortality rate)=1 (1+elogit).
The TRISS indicates the probability of survival based on the patient's characteristics. Using the example mentioned in Table 4, the TRISS is automatically calculated with the use of the ISS (see Table 4), the RTS (see Table 5) and taking into account the patient's age, as follows:

Using a logarithmic equation, TRISS (predicted mortality rate) for the patient=1/(1+elogit)=21.3%.
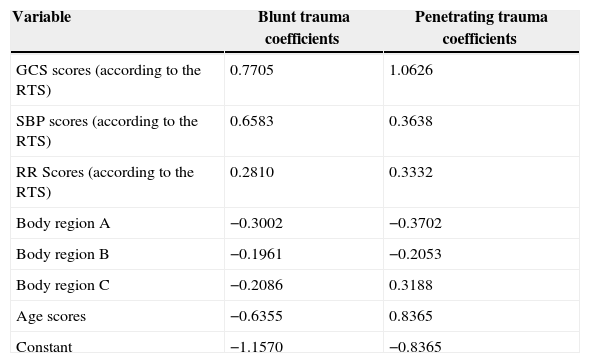
A severity characterisation of trauma (ASCOT) (Table 7) was introduced for the first time in 1990 by Champion et al.28 in an attempt to improve the prediction of trauma patients’ progress. Up to then, the TRISS had been the predominant prediction model of trauma progress, but its most important limitation was related to the use of the ISS.2 For this reason, the ISS was replaced by the AP in the definition of the TRISS, and the ASCOT was created as a result of that. The ASCOT not only replaces the ISS by the AP, but also stops considering age as a dichotomous variable to regard it as a continuous one.2,29 The ASCOT is composed of the AP and the RTS. Age was also considered in a five-step system. For each component, the square root of the sum of the squares was used in all injuries as a severity index. With this method, multiple injuries in a single body region should obtain a higher weight in the formula. Once again, the ASCOT is based on a logistic equation to calculate the probabilities of survival. As it happens with TRISS, different coefficients are employed for blunt and penetrating trauma. The ASCOT is calculated in an analogous fashion to the TRISS with a logistic equation. While comparing the ASCOT and the TRISS, the former shows much better outcomes than the latter as regards the prediction of patients’ progress. However, its “complexity” has been widely considered an obstacle to its implementation and the TRISS is still the cornerstone of comparative analysis of trauma patients.2
A Severity Characterisation of Trauma (ASCOT).
| Variable | Blunt trauma coefficients | Penetrating trauma coefficients |
|---|---|---|
| GCS scores (according to the RTS) | 0.7705 | 1.0626 |
| SBP scores (according to the RTS) | 0.6583 | 0.3638 |
| RR Scores (according to the RTS) | 0.2810 | 0.3332 |
| Body region A | −0.3002 | −0.3702 |
| Body region B | −0.1961 | −0.2053 |
| Body region C | −0.2086 | 0.3188 |
| Age scores | −0.6355 | 0.8365 |
| Constant | −1.1570 | −0.8365 |
| Age in years | Scores |
|---|---|
| Age scores are assigned as follows: | |
| ≤54 | 0 |
| 55–64 | 1 |
| 65–74 | 2 |
| 75–84 | 3 |
| ≥85 | 4 |
GCS, Glasgow coma score, RR, respiratory rate, SBP, systolic blood pressure.
ASCOT coefficients 14, 28 A, B and C represent severity scores for different body regions. The ASCOT is calculated in an analogous fashion to the TRISS with a logistic equation.
Using the example shown in Table 4, the ASCOT may be calculated as follows:
Number of Abbreviated Injury Scale (AIS) of 3 injuries (in thorax)=1
Number of AIS of 4 injuries (in head, brain)=1
Number of AIS of 5 injuries (in thorax)=1
Thus, injury scores are calculated as follows:
- (1)
Head and brain injuries=√42=4 points.
- (2)
Thorax injuries=√32+52=5.83095 points.
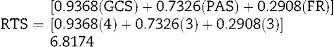
ASCOT=blunt trauma constant+(0.9368 [GCS]+0.7326 [SBP]+0.2908 [RR])+(−0.3002 * AIS score of head, brain and spinal cord injuries+[−0.1961 * AIS score of thorax and neck injuries+ −0.2086* [AIS score of injuries in all other body regions])+ −0.6355* (age score)=−1.1570+6.8174+(−2.3442493)+0=3.3161507.
Predicted mortality rate for the patient=1/(1+elogit)=8.3%.
Rutledge et al.30,31 suggested an injury severity score based on the 9th review of the International Classification of Diseases (ICD-9), called ICD-based Injury severity score (ICISS). The ICISS for a trauma patient is calculated by means of the product of the individual probabilities of survival of all injuries. Therefore, patients with multiple injuries and severe injuries tend to have lower probabilities of survival. The inconvenience of this scoring system is that the method used to calculate the probabilities did not take into account the effect of the presence of multiple injuries, and the formula of the product of different risks implies the statistical independence thereof, which represents a questionable assumption.14 Although in a comparative study conducted by Rutledge et al.32 the ICISS showed better outcomes than the TRISS, this scoring system still requires a more complete validation.
Polytrauma ScoreIn 1983, the Polytrauma score (PS) was introduced based on the analysis of 696 trauma patients. Subsequently, it was modified with a sum of up to 90 points. It includes physiological data, the GCS, the partial pressure of oxygen, the fraction of inspired oxygen, the base excess and the anatomical information about abdominal, limb, thoracic and pelvic injuries. Age was also taken into account, and a specific score is assigned to each injury.2
The PS is a reliable scoring system, mainly to estimate mortality and morbidity in patients showing blunt trauma at the Emergency Room.33
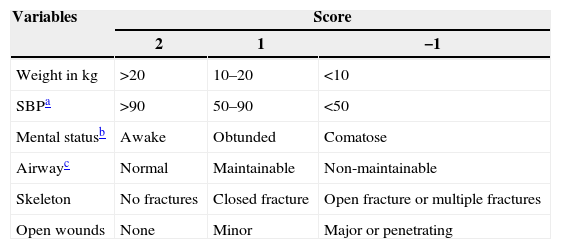
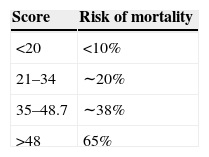
Paediatric Trauma ScoreThe Paediatric trauma score (PTS)34,35 (Table 8) is a physiological score that assesses six components which are commonly observed in paediatric trauma, and emphasises the child's weight and airway status. A mortality of 0% has been observed in patients with a PTS greater than 8, while mortality increases up to 30% in patients with a PTS equal to or lower than 8,2 or up to 100% in patients with a PTS≤0.36 Although no advantage was observed compared to the RTS,37 a significant correlation with survival is added.
Paediatric Trauma Score (PTS).
| Variables | Score | ||
|---|---|---|---|
| 2 | 1 | −1 | |
| Weight in kg | >20 | 10–20 | <10 |
| SBPa | >90 | 50–90 | <50 |
| Mental statusb | Awake | Obtunded | Comatose |
| Airwayc | Normal | Maintainable | Non-maintainable |
| Skeleton | No fractures | Closed fracture | Open fracture or multiple fractures |
| Open wounds | None | Minor | Major or penetrating |
SBP, systolic blood pressure.
If no blood pressure monitor is available or cuff size is inadequate, the BP may be assessed by assigning +2: palpable pulse at the wrist, −1: no palpable pulse
Mental status: a child who shows any degree of obtundation or who has suffered loss of consciousness, no matter how transient it might be, is graded as +1.
Airway: a child whose airway does not require any support measure is graded as +2; a child with obstructed or partially obstructed airway who requires simple measures such as head positioning, oral airway or oxygen administration via a face mask is graded as +1; a child whose airway requires a definitive treatment, such as intubation, cricothyroidotomy or other invasive techniques is graded as non-maintainable or −1.
Prediction models should be regularly updated to reflect the changes that take place in the clinical practice and in the proportions of several types of cases over time.38 The main difficulties faced by severity assessment scores and trauma cases reported are the following: unavailable data (the GCS in patients who show paralysis, which leads to approximations), missing data, development and implementation of outcome measures other than death and complex injuries.2 This raises the question of what the desirable characteristics of mortality predictive factors are, with an adjustment regarding the risk and the way to avoid existing confusion between the interpretation of an estimated probability of mortality and the prediction of whether or not a certain patient will survive. The desirable characteristics of risk-adjusted mortality predictive factors, according to Selker,39 involve the fact that they are time-insensitive predictive instruments, i.e., with no initial time bias, they are not affected by whether the patient is hospitalised or not, they are calibrated with a high degree of accuracy, they are independent from the diagnosis-related group systems and they enable inspection and conduct of testing. No matter how utopian these criteria may seem, and despite the fact that ideal scoring systems have not been formalised yet, the existing systems are, however, very effective as far as the prediction of in-patient mortality and patients’ progress is concerned. In spite of being still imperfect, these risk assessments have increasingly been applied to decision-making at the right moment, and if combined with high-risk indicators of injury severe sequelae, such as cytokine response, lactate levels, etc., they may enable the implementation of an early prophylaxis in the face of multiple organ failure, increase scientific accuracy in their implementation and take treatment quality to a higher level.
Conflicts of InterestThe authors declare that they do not have any conflicts of interest.
Please cite this article as: Rapsang AG, Shyam DC. Compendio de las escalas de evaluación de riesgo en el paciente politraumatizado. Cir Esp. 2015;93:213–221.
