


The acquisition and classification of scientific evidence and subsequent formulation of recommendations constitute the basis for the development of clinical practice guidelines. There are several systems for the classification of evidence and strength of recommendations; the most commonly used nowadays is the Grading of Recommendations, Assessment, Development and Evaluation system (GRADE). The GRADE system initially classifies the evidence into high or low, coming from experimental or observational studies; subsequently and following a series of considerations, the evidence is classified into high, moderate, low or very low. The strength of recommendations is based not only on the quality of the evidence, but also on a series of factors such as the risk/benefit balance, values and preferences of the patients and professionals, and the use of resources or costs.
La adquisición y jerarquización de la evidencia, así como la posterior formulación de recomendaciones, constituyen la base del desarrollo de las guías de práctica clínica. Sistemas de graduación de la calidad de la evidencia y de la fuerza de las recomendaciones han existido muchos y actualmente se va imponiendo el modelo Grading of Recommendations, Assessment, Development and Evaluation (GRADE). En el sistema GRADE la calidad de la evidencia se clasifica, inicialmente, en alta o baja, según provenga de estudios experimentales u observacionales; posteriormente, según una serie de consideraciones, la evidencia queda en alta, moderada, baja y muy baja. La fuerza de las recomendaciones se apoya no solo en la calidad de la evidencia, sino en una serie de factores como son el balance entre riesgos y beneficios, los valores y preferencias de pacientes y profesionales, y el consumo de recursos o costes.
Evidence-based medicine (EBM) requires medical practitioners to combine their medical knowledge and judgement with the best existing scientific knowledge. Determining the best evidence requires skills of identification, critical analysis and prioritising published evidence. The former stage is essential, as any recommendation or grade of recommendation proposed in terms of preventive or therapeutic surgery or concerning a diagnostic procedure must be directly related to the quality (and other factors) of the existing evidence.
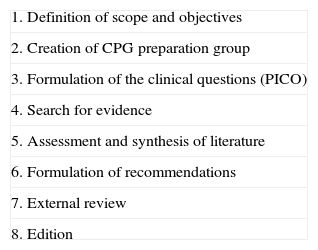
EBM is chiefly of interest to groups of experts who develop clinical practice guidelines (CPG) for research on a disease or health problem and for diagnosis, treatment and prevention. Up to 8 stages are described in the development of a guideline (Table 1), but only stages 3–8 concern us in this article (formulating questions, acquiring evidence, assigning quality and drawing up recommendations). Obtaining useful CPG is not an easy task due to the varied nature of the individuals making up the groups or committees of experts who create these guidelines, their different points of view and methods, and the similar variability of scientific information available on a particular topic.1–3 Until a few years ago these groups of experts used an informal methodology to reach a consensus, but recently procedures for prioritising evidence and establishing appropriate recommendations have improved. Here the system for the Grading of Recommendations, Assessment, Development and Evaluation (GRADE) comes into play.
Stages in the Preparation of a Clinical Practice Guideline.
| 1. Definition of scope and objectives |
| 2. Creation of CPG preparation group |
| 3. Formulation of the clinical questions (PICO) |
| 4. Search for evidence |
| 5. Assessment and synthesis of literature |
| 6. Formulation of recommendations |
| 7. External review |
| 8. Edition |
CPG: clinical practice guideline; PICO.
There are a great many sophisticated systems for categorising scientific evidence, including the English model, the Oxford Centre for Evidence-Based Medicine (OCEBM), the Scottish Intercollegiate Guidelines Network (SIGN) or the American College of Chest Physicians (ACCP) used by the ACCP itself in their guidelines on venous thrombosis up until their seventh revision.4–6 All of them attributed different quality levels to studies on a particular problem, which then enabled different degrees of recommendation to be made. However, some disadvantages soon emerged, such as the fact that these systems were developed principally as a result of a consensus of expert opinion and were not validated.7 Therefore, occasionally, different systems were not categorising the same studies in terms of similar levels of evidence. Indeed, sometimes no agreement was reached on the same model. Moreover, some systems were better at estimating the quality of evidence than establishing the grade of recommendation, and vice versa. All the above-mentioned meant that occasionally the CPG were not completely reliable.
The GRADE working group's proposal was communicated in 2004. It was created by an international and multidisciplinary group of methodologists, experts in CPG and clinical doctors, in an attempt to deal with the problems mentioned above.8,9 The advantage of the system is that it is a thorough and transparent method for classifying quality of evidence and for allocating a grade or strength of recommendation. We shall develop these points as the GRADE system does, but first we shall outline the steps to be followed in the formulation of clinical questions.
Formulation of Clinical Questions in PICO Format and Search for AnswersOnce the scope of a CPG has been established, a series of clinical questions need to be defined which are grouped into sections of organisation, prevention, diagnosis, treatment, prognosis, etc. PICO (acronym for Patient–Intervention–Comparison–Outcome) is the preferred method used to move from a generic clinical question to a specifically formulated one to facilitate a bibliographic search and preparation of recommendations for each question. Thus:
- a.
Patient: or population, disease statuses, age groups, comorbidities, etc.
- b.
Intervention: treatment, diagnostic test, aetiological agent, etc.
- c.
Comparison: possible alternative to intervention under research as a regular treatment or placebo, gold reference standard of a diagnostic test, lack of aetiological agent, etc.
- d.
Outcomes: relevant outcome variables in the case of studies on efficacy, prognosis or aetiology, and validity estimators in the case of diagnostic tests (sensitivity, specificity, probability coefficients, etc.).
When clinical questions are formulated in PICO format they are defined in a specific manner and there is no ambiguity as to what is being probed and moreover, as each type of question corresponds to a type of study with the appropriate design for its answer, the format helps towards conducting a literature search. During the formulation of clinical questions all the possible outcome variables must be defined. This is an even more relevant issue when used in preparing the GRADE system recommendations, where the variables are qualified as to their importance for clinicians and patients and are weighted on a scale from 1 to 9. Only variables with a score from 7 to 9 are considered key in affecting a GRADE system decision and the clinical questions need to be specified to these key variables. The answers to these questions on key outcomes shall be those which are used to grade the recommendations. Variables with a score of 4–6 are classified as important but not crucial for decision making. Those given a score from 1 to 3 shall be considered unimportant and will not be included in the evaluation or influence the recommendations. The strict and accurate selection of key outcome variables means that the studies are selected equally and thus it is possible that the findings that are going to be used to infer recommendations and therefore their strength, can vary from one CPG to another.10
A documentalist is sometimes needed to collaborate in finding the answers that we are looking for to PICO questions. We might need to consult previous GPC, updated systematic revisions, or original studies. When the scientific evidence has been found, it has to be categorised according to its methodological quality (internal validity), the importance of its outcomes and their applicability.
Finally, the strength of recommendations is graded according to a set system. Until now the Scottish SIGN system has been one of the systems used for questions in relation to treatment or prognosis, and the English Oxford CMBE system for questions on diagnosis. At present the GRADE system is starting to be used which we shall mention later. The GRADE Working Group proposed a different approach based on previous systems, which boasts a better structure and greater transparency and information.8–14 The advantages of this approach are (a) it weighs up the relative importance of the outcome variables and chooses the ones which are key; (b) it offers detailed descriptions of the evidence quality criteria with respect to specific outcomes and uses explicit definitions and sequential judgements during the categorisation process; (c) it separates the quality of the evidence and the strength of recommendations; (d) and it also considers the balance between benefits and risks, the patient's values and the consumption of resources or costs. It also provides the so-called evidence profile tables and summary of findings; these are unique and essential tables which we shall discuss later.
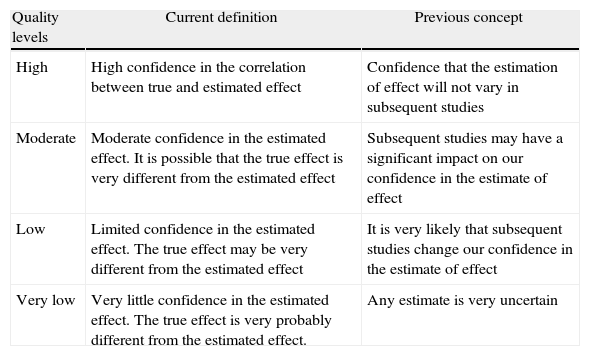
Levels of EvidenceGRADE defines the quality of evidence as the extent to which one can be confident that an estimate of effect is correct in order for a recommendation to be made. An assessment is made of each key outcome; therefore the same comparison of a therapeutic or preventive intervention can receive different allocations of quality of evidence. The GRADE system sets four categories for rating quality of evidence: high, moderate, low and very low. Table 2 shows what each of the 4 categories represents in terms of their initial and current conception.
GRADE System: Meaning of the 4 Levels of Evidence.
| Quality levels | Current definition | Previous concept |
| High | High confidence in the correlation between true and estimated effect | Confidence that the estimation of effect will not vary in subsequent studies |
| Moderate | Moderate confidence in the estimated effect. It is possible that the true effect is very different from the estimated effect | Subsequent studies may have a significant impact on our confidence in the estimate of effect |
| Low | Limited confidence in the estimated effect. The true effect may be very different from the estimated effect | It is very likely that subsequent studies change our confidence in the estimate of effect |
| Very low | Very little confidence in the estimated effect. The true effect is very probably different from the estimated effect. | Any estimate is very uncertain |
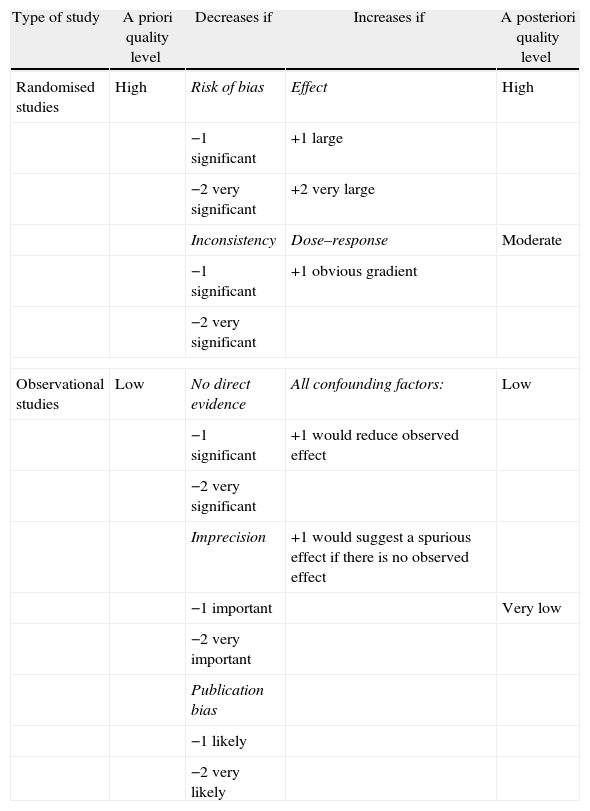
The first stage of the GRADE system considers experimental studies as high quality (randomised clinical trials) and observational studies as low quality (case-control, cohorts). In the second stage, for refining the level of quality, the system sets a series of items to be considered and which can either lower or raise the initially allocated level of quality.
- a.
Items which lower quality:
- 1)
Limitations with the design and execution of the study (risk of bias): Insufficient or incorrect randomisation, lack of blinding, major losses to follow-up, analysis without intention to treat and trials ending prematurely.
- 2)
Inconsistency of outcomes: when outcomes display a great deal of unexplained variability or heterogeneity. Particularly if some studies show substantial benefits and others no effect or even harm.
- 3)
Uncertainty as to whether the evidence is direct (indirectness): Following the PICO method, this can occur with the patients studied (age, gender or clinical status differences), with the intervention, if it is similar but not identical; with the comparison made; or with the outcomes, if some are compared short term and others long term, etc.
- 4)
Imprecision: this occurs if the confidence intervals (CI) are broad, the samples are small or there are few events.
- 5)
Publication bias: when there is a high probability of unreported studies, mainly due to a lack of impact, or when all the relevant outcome variables have not been included.
- 1)
- b.
Items which raise quality:
- 1)
Strong association: findings of relative effects RR>2, or <0.5 in observational studies with no confounding factors.
- 2)
Very strong association: findings of relative effects RR>5, or <0.2 based on studies where there are no problems with bias or precision.
- 3)
Where there is a dose–response gradient.
- 4)
Evidence that all possible confusion or bias factors might have reduced the effect observed.
- 1)
Situations which can determine increased confidence in the results of observational studies are uncommon. In such cases this increase should only be considered if there are no design or execution limitations (which could diminish quality) and there is also a very major and immediate effect or radical change in the prognosis after a particular intervention.
All these items determine, according to the scores shown in Table 3, whether the level of quality of the evidence is lowered or raised. Once the analysis has been completed, the GRADE experts summarise all the evidence with regard to the specific questions and the outcome variables chosen beforehand, in summary tables which they term evidence profiles [GRADE EP] and summary of findings [GRADE SoF]. EP and SoF tables have different purposes and are aimed at different collectives.15,16
Classification of the Level of Evidence According to the GRADE System.
| Type of study | A priori quality level | Decreases if | Increases if | A posteriori quality level |
| Randomised studies | High | Risk of bias | Effect | High |
| −1 significant | +1 large | |||
| −2 very significant | +2 very large | |||
| Inconsistency | Dose–response | Moderate | ||
| −1 significant | +1 obvious gradient | |||
| −2 very significant | ||||
| Observational studies | Low | No direct evidence | All confounding factors: | Low |
| −1 significant | +1 would reduce observed effect | |||
| −2 very significant | ||||
| Imprecision | +1 would suggest a spurious effect if there is no observed effect | |||
| −1 important | Very low | |||
| −2 very important | ||||
| Publication bias | ||||
| −1 likely | ||||
| −2 very likely | ||||
EP tables are more wide-ranging, they present the relevant findings for each key outcome, providing them in lines in the different columns, where the number of studies and the number of patients are expressed, the design (randomised or observational), the comparisons made, observed effect estimates in terms of relative effect RR (with its 95% CI) and absolute effect, and they also include an explicit assessment of the factors which weigh the quality of the studies (design limitations, inconsistency, indirectness, publication bias, etc.). Lastly they categorise the quality of the evidence for each outcome in plus signs (+) from 4 to 1, in other words, high, moderate, low or very low quality, respectively, with the meaning shown in Table 3. For tables which cover the evidence levels for questions relating to diagnostic tests, the format may be different. Evidence profiles are aimed at a small collective of CPG reviewers and creators and to anybody who questions or wants to check the goodness-of-fit of an assessment.
SoF tables are more concise and only offer the relevant findings of each outcome, i.e., as we mentioned earlier, the number of studies and the number of patients, comparisons made, observed effect estimates in terms of relative effect RR (with its 95% IC) and absolute effect. They also express the quality awarded. The summaries of findings are aimed at a wider collective, principally users of CPG and readers of systematic reviews. There is software (GRADEpro) for creating EP and SoF tables.14 For more information on EP and SoF consult Guyatt et al.16
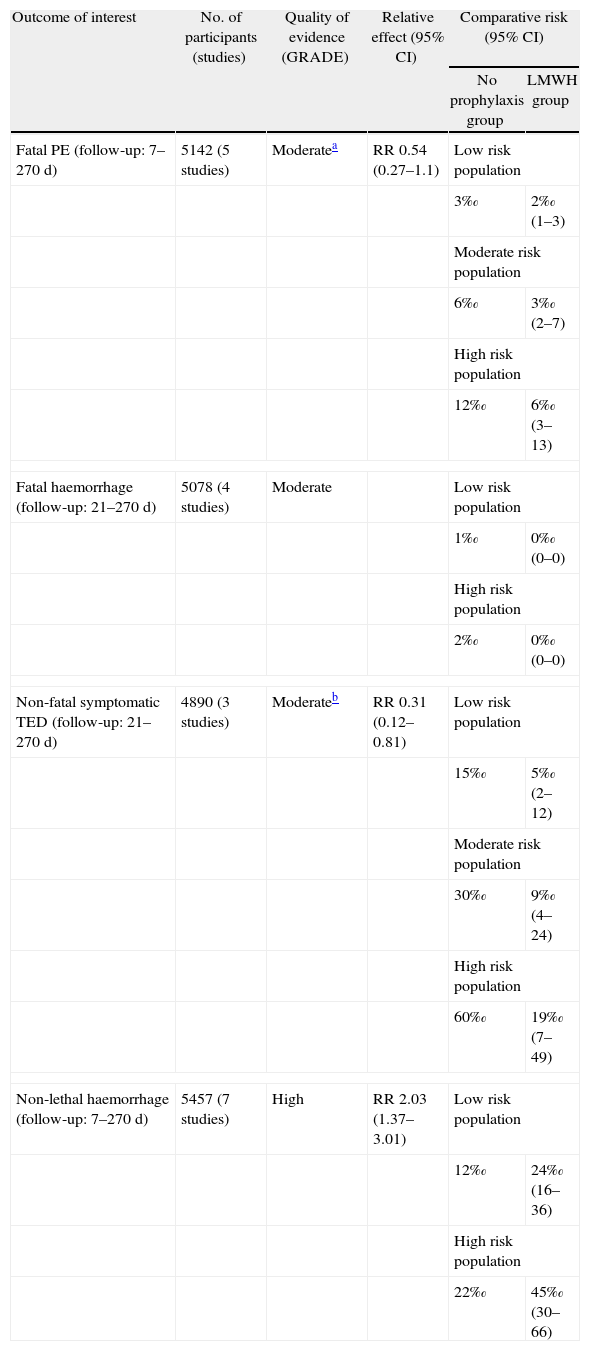
In this context, we highlight a table in the ACCP guidelines for antithrombotic therapy and prevention of thrombosis (9th ed.) which summarises the evidence for starting pharmacological thromboembolism prophylaxis in surgical patients (Table 4). We observe a decrease in the quality of evidence in 2 of the outcomes of interest (fatal pulmonary embolism and non-fatal symptomatic venous thromboembolic disease); in one case, due to the imprecision associated with possibly not achieving an effect, and in the other, due to limitations in the design of one of the studies. If we make a comparison with the 8th edition of these guidelines, we observe that the level of evidence and the degree of recommendation for pharmacological thromboembolic prophylaxis in moderate risk patients undergoing surgery has decreased in the new guidelines.17,18
Effect of Prophylaxis Using Low Molecular Weight Heparin Compared to no Prophylaxis for Thromboembolytic Disease in Surgical Patients.
| Outcome of interest | No. of participants (studies) | Quality of evidence (GRADE) | Relative effect (95% CI) | Comparative risk (95% CI) | |
| No prophylaxis group | LMWH group | ||||
| Fatal PE (follow-up: 7–270 d) | 5142 (5 studies) | Moderatea | RR 0.54 (0.27–1.1) | Low risk population | |
| 3‰ | 2‰ (1–3) | ||||
| Moderate risk population | |||||
| 6‰ | 3‰ (2–7) | ||||
| High risk population | |||||
| 12‰ | 6‰ (3–13) | ||||
| Fatal haemorrhage (follow-up: 21–270 d) | 5078 (4 studies) | Moderate | Low risk population | ||
| 1‰ | 0‰ (0–0) | ||||
| High risk population | |||||
| 2‰ | 0‰ (0–0) | ||||
| Non-fatal symptomatic TED (follow-up: 21–270 d) | 4890 (3 studies) | Moderateb | RR 0.31 (0.12–0.81) | Low risk population | |
| 15‰ | 5‰ (2–12) | ||||
| Moderate risk population | |||||
| 30‰ | 9‰ (4–24) | ||||
| High risk population | |||||
| 60‰ | 19‰ (7–49) | ||||
| Non-lethal haemorrhage (follow-up: 7–270 d) | 5457 (7 studies) | High | RR 2.03 (1.37–3.01) | Low risk population | |
| 12‰ | 24‰ (16–36) | ||||
| High risk population | |||||
| 22‰ | 45‰ (30–66) | ||||
PE: pulmonary embolism; TED: thromboembolic disease; LMWH: low molecular weight heparin.
The GRADE system sets out recommendations based on a series of considerations.8,9,11,12 These are as follows: (1) risk-benefit balance: this is based on the knowledge that the majority of clinicians will offer patients therapeutic or preventive measures as long as the advantages of the intervention exceed its risks and collateral damage. The certainty or uncertainty of the clinician in considering the risk-benefit balance will greatly determine the strength of the recommendation. (2) Quality of evidence: the second factor is the methodological quality of the studies for each outcome variable, this factor is weighted by the details we set out above and which could raise or lower the level of evidence. In general, the degree of recommendation follows the level of evidence but not always. (3) The values and preferences of the patients have also to be considered. To that end a value judgement needs to be made and the values and preferences of the population in our area need to be established with any possible individual differences. (4) An estimate of resource consumption and costs.
There are still no appropriate studies which analyse patients’ values and preferences in specific situations. In any event, values and preferences strengthen the degree of the recommendation when there is high concordance and weaken it when there is variability. Cost analysis usually requires the services of health economy experts. In general it is considered that an intervention can be classified as very cost-effective if it costs < the average per capita income of a country or region per quality adjusted life year (QALY) gained. Up to 3 times the average per capita income per QALY gained may be tolerable. Threshold tables have been developed on this subject.19,20
Finally, the recommendations are simply graded in binary form as: strong (grade 1) or weak (grade 2), either for or against. A strong recommendation implies that the great majority of patients would agree (or disagree) with the recommended action. Clinicians should implement the action for most patients and the health authorities would have to adopt the recommendation as a health policy in the majority of situations. A weak recommendation implies that the majority of patients would accept (or reject) the recommended action, but a significant number of them would not. Clinicians must recognise that there are different options that are appropriate for different patients and, in this case, each patient requires help to reach the decision which is most consistent with their values and preferences. The health authorities would have to debate with the interest groups whether this recommendation should be implemented.
In the example we gave earlier, we observed that pharmacological pulmonary thromboembolism prophylaxis significantly reduces the risk of non-fatal venous thromboembolic disease (TED), not of fatal pulmonary embolism (PE), with an increased risk of major non-fatal haemorrhage (risk-benefit balance). On the other hand, we can see how the quality of evidence reduces as a result of the imprecision noted in the outcomes of fatal PE and the limitations in the design of a particular study. In short, a weak recommendation is established in favour of the use of pharmacological prophylaxis for patients with moderate thromboembolic risk.18
Limitations and Future of the GRADE System and its Use in SpainCertain limitations should be highlighted. Firstly, the method was developed to deal above all with questions related to alternative interventions, treatment or prevention, not risk or prognosis and it entails difficulties in terms of diagnostic tests, public health and health system issues. Secondly, it only covers steps 3–6 (Table 1) in the elaboration of a CPG. And thirdly, although the system makes highly systematic, transparent and reproducible judgements, it does not completely eliminate any disagreements which might exist when assessing a piece of evidence or when deciding alternative courses of action, given that there is always a subjective element in any judgement.
For those wishing to go into the GRADE method in more depth, such as authors of systematic reviews or health technology assessment studies, CPG panellists and methodologists, there is a wide-ranging and thorough series of sequential articles in this regard which have been published in the Journal of Clinical Epidemiology between 2011 and 2013 and is yet to be completed.15,21–32
In Spain, several prestigious scientific journals of significant impact have covered the GRADE phenomenon—the Revista de Atención Primaria,33Medicina Clínica,34Archivos de Bronconeumología35 and Revista Española de Cardiología.13 Its use has also been reported in health technology assessment36 and in the development of CPG.37–39
Conflict of InterestsThere is no conflict of interest.
Please cite this article as: Aguayo-Albasini JL, Flores-Pastor B, Soria-Aledo V. Sistema GRADE: clasificación de la calidad de la evidencia y graduación de la fuerza de la recomendación. Cir Esp. 2014;92:82–88.
