


A variable percentage of patients admitted to surgical departments are not operated on for several reasons. Our goal is to check if surgeons have more problems in caring for non-operated hospitalized patients than operated ones.
Material and methodsWe included all patients aged ≥14 years discharged in 2010 from General Surgery, Gynaecology, Urology, and Otolaryngology. The main variables were the length of stay, mortality, readmissions, and number of consultations/referrals requested to medical services. Secondary variables were age, sex, number of emergency admissions, total number of diagnoses, and the Charlson comorbidity index (ICh).
ResultsBetween 8.7% and 22.8% of patients admitted to these surgical departments are not operated on. The non-operated patients had significantly higher stay, mortality, readmissions and consultations/referrals requests than operated ones, with significantly higher age (except Urology), number of diagnoses, emergency admissions and ICh (except Urology).
ConclusionsPatients admitted to surgical departments and have not been operated on have higher mortality, readmissions and consultation/referrals requests than those operated on, which may be due to their greater medical complexity and urgency of admission. This suggests a greater difficulty in their care by surgeons.
Un porcentaje variable de los enfermos ingresados en los servicios quirúrgicos no son operados por diversas razones. Nuestro objetivo es comprobar si los cirujanos tienen más dificultades en la atención de los pacientes ingresados no operados que en los operados.
Material y métodosHemos incluido a todos los pacientes de edad ≥ 14 años dados de alta el año 2010 de Cirugía General, Ginecología, Urología y Otorrinolaringología. Las variables principales fueron la estancia, mortalidad, reingresos y número de interconsultas solicitadas a servicios médicos. Las variables secundarias: edad, sexo, número de ingresos urgentes, número total de diagnósticos y el índice de comorbilidad de Charlson (ICh).
ResultadosEntre el 8,7 y el 22,8% de los pacientes ingresados en estos servicios no son operados. Los pacientes no operados tienen significativamente mayores estancia, mortalidad, reingresos y solicitudes de interconsultas que los operados, con significativamente mayores edad (excepto Urología), número de diagnósticos, ingresos urgentes e ICh (excepto Urología).
ConclusionesLos pacientes ingresados en los servicios quirúrgicos que no son operados tienen mayor mortalidad, reingresos y solicitudes de interconsultas que los operados, probablemente por su mayor complejidad médica y urgencia del ingreso. Ello podría indicar una mayor dificultad en su manejo por parte de los cirujanos.
The age and comorbidity of patients admitted to surgical departments are progressively increasing,1 and interventions have increased in older patients with more complex diseases, or with a greater comorbidity. These are some of the causes that lead to growing difficulties among surgical specialists regarding the control and follow-up of their patients. As a result, perioperative care is becoming progressively more complex and multidisciplinary. For this reason, perioperative medicine2 is developing as a way of organising and improving medical care during the perioperative period. However, some of the patients admitted to surgical departments are not submitted to surgery (NSS). This group is made up of patients admitted to conduct a diagnostic test, patients with a disease related to the surgical speciality that does not require intervention, at least at that time, and patients with surgical indication that cannot be operated on for several reasons. Therefore, they may not be subject to the coverage of perioperative medicine. In general terms, a surgical specialist should not find it more difficult to treat a patient depending on whether they have had surgery or not, unless this depended on related medical problems. In fact, in our experience as surgical department consultants, we have observed that the follow-up and management of non-operated patients seem to be more difficult for surgeons than the follow-up and treatment of operated patients. This observation was confirmed in the case of Orthopaedic Surgery and Traumatology.3
Our objective is to determine if seeing NSS patients are more difficult for surgical specialists than seeing operated patients, and to identify the possible causes of these difficulties. It is important to confirm this hypothesis because, if proven, it could be used to suggest modifications to the current organisation of hospital care.
Material and MethodsOur hospital has 550 beds and provides health care for an almost exclusively urban population of 375000 inhabitants. The study has included all the patients over 14 years of age that were discharged during 2010 from the following departments: General and Digestive Surgery, Urology, Gynaecology and Otorhinolaryngology (ORL). The main objective was to study the greatest possible difficulty in the treatment of NSS patients compared to operated patients by analysing the hospital stay, mortality, readmissions for any reason and in any department within a maximum of 15 days, and the number of interdepartmental referrals requested. The secondary objective was to study the possible causes, or related factors, of this difficulty by analysing the age, sex, number of emergency admissions, total number of diagnoses and Charlson comorbidity index (CCI),4 which is validated for its use with administrative databases.5 The data required to conduct the study, with the exception of interdepartmental referrals, were obtained from the minimum basic set of hospital data (MBSD) of our centre, which allows up to 13 codified diagnoses, as per ICD-9-CM. In our hospital, non-urgent interdepartmental referrals during working hours are requested by means of a software application, which makes it possible to review all the requested referrals for each department and, among other information, the requested department. The data provided by this application are easily combined with MBSD.
Statistical AnalysisThe age, number of diagnoses, CCI and average stay are described with an average and its respective 95% confidence interval (95% CI). The rest of the variables, which are all qualitative, are described with the percentage and its respective 95% CI. The average differences between both groups, with their 95% CI, are analysed with Student's t-test. The other variables are analysed by obtaining the odds ratio (OR) and its respective 95% CI. The level of statistical significance is set in P<.05. All the calculations were made with the statistical package SPSS 15.0 (IBM, Chicago, USA).
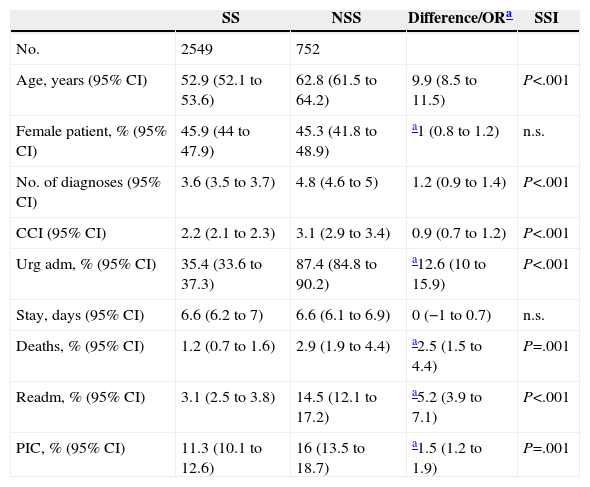
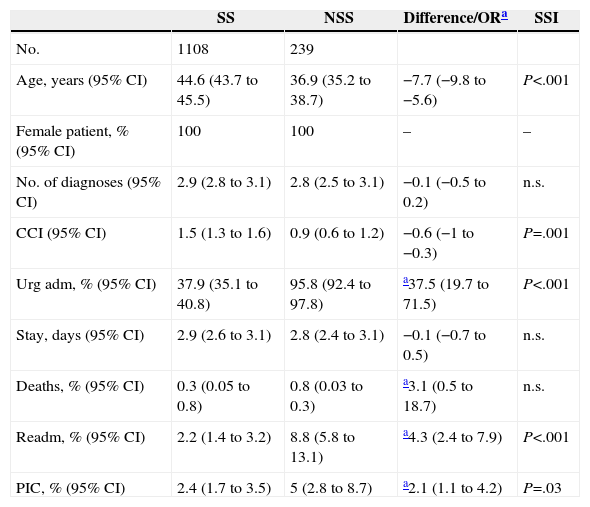
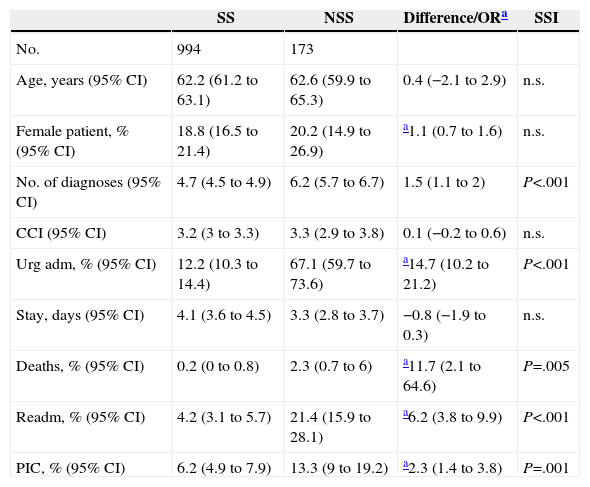
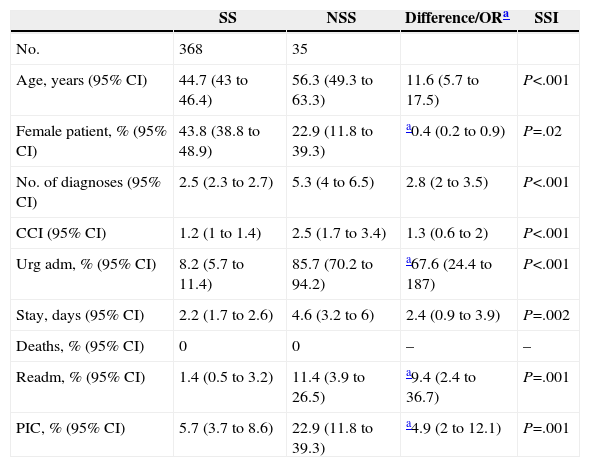
ResultsDuring 2010, the General and Digestive Surgery Department discharged 3301 patients ≥14 years old, of which 22.8% were NSS. The Gynaecology department discharged 1347 patients, of which 17.7% were NSS. The Urology department discharged 1167 patients, of which 14.8% were NSS, and ORL discharged 403 patients, of which 8.7% were NSS. The results obtained in each of these departments are shown in Tables 1–4.
Results: General and Digestive Surgery.
| SS | NSS | Difference/ORa | SSI | |
|---|---|---|---|---|
| No. | 2549 | 752 | ||
| Age, years (95% CI) | 52.9 (52.1 to 53.6) | 62.8 (61.5 to 64.2) | 9.9 (8.5 to 11.5) | P<.001 |
| Female patient, % (95% CI) | 45.9 (44 to 47.9) | 45.3 (41.8 to 48.9) | a1 (0.8 to 1.2) | n.s. |
| No. of diagnoses (95% CI) | 3.6 (3.5 to 3.7) | 4.8 (4.6 to 5) | 1.2 (0.9 to 1.4) | P<.001 |
| CCI (95% CI) | 2.2 (2.1 to 2.3) | 3.1 (2.9 to 3.4) | 0.9 (0.7 to 1.2) | P<.001 |
| Urg adm, % (95% CI) | 35.4 (33.6 to 37.3) | 87.4 (84.8 to 90.2) | a12.6 (10 to 15.9) | P<.001 |
| Stay, days (95% CI) | 6.6 (6.2 to 7) | 6.6 (6.1 to 6.9) | 0 (−1 to 0.7) | n.s. |
| Deaths, % (95% CI) | 1.2 (0.7 to 1.6) | 2.9 (1.9 to 4.4) | a2.5 (1.5 to 4.4) | P=.001 |
| Readm, % (95% CI) | 3.1 (2.5 to 3.8) | 14.5 (12.1 to 17.2) | a5.2 (3.9 to 7.1) | P<.001 |
| PIC, % (95% CI) | 11.3 (10.1 to 12.6) | 16 (13.5 to 18.7) | a1.5 (1.2 to 1.9) | P=.001 |
95% CI: 95% confidence interval; CCI: Charlson comorbidity index; Urg adm: urgent admissions; n.s.: not significant; NSS: not submitted to surgery patients; PIC: interdepartmental referrals; Readm: readmissions; SS: submitted to surgery patients; SSI: statistical significance.
Results: Gynaecology.
| SS | NSS | Difference/ORa | SSI | |
|---|---|---|---|---|
| No. | 1108 | 239 | ||
| Age, years (95% CI) | 44.6 (43.7 to 45.5) | 36.9 (35.2 to 38.7) | −7.7 (−9.8 to −5.6) | P<.001 |
| Female patient, % (95% CI) | 100 | 100 | – | – |
| No. of diagnoses (95% CI) | 2.9 (2.8 to 3.1) | 2.8 (2.5 to 3.1) | −0.1 (−0.5 to 0.2) | n.s. |
| CCI (95% CI) | 1.5 (1.3 to 1.6) | 0.9 (0.6 to 1.2) | −0.6 (−1 to −0.3) | P=.001 |
| Urg adm, % (95% CI) | 37.9 (35.1 to 40.8) | 95.8 (92.4 to 97.8) | a37.5 (19.7 to 71.5) | P<.001 |
| Stay, days (95% CI) | 2.9 (2.6 to 3.1) | 2.8 (2.4 to 3.1) | −0.1 (−0.7 to 0.5) | n.s. |
| Deaths, % (95% CI) | 0.3 (0.05 to 0.8) | 0.8 (0.03 to 0.3) | a3.1 (0.5 to 18.7) | n.s. |
| Readm, % (95% CI) | 2.2 (1.4 to 3.2) | 8.8 (5.8 to 13.1) | a4.3 (2.4 to 7.9) | P<.001 |
| PIC, % (95% CI) | 2.4 (1.7 to 3.5) | 5 (2.8 to 8.7) | a2.1 (1.1 to 4.2) | P=.03 |
95% CI: 95% confidence interval; CCI: Charlson comorbidity index; Urg adm: urgent admissions; n.s.: not significant; NSS: not submitted to surgery patients; PIC: interdepartmental referrals; Readm: readmissions; SS: submitted to surgery patients; SSI: statistical significance.
Results: Urology.
| SS | NSS | Difference/ORa | SSI | |
|---|---|---|---|---|
| No. | 994 | 173 | ||
| Age, years (95% CI) | 62.2 (61.2 to 63.1) | 62.6 (59.9 to 65.3) | 0.4 (−2.1 to 2.9) | n.s. |
| Female patient, % (95% CI) | 18.8 (16.5 to 21.4) | 20.2 (14.9 to 26.9) | a1.1 (0.7 to 1.6) | n.s. |
| No. of diagnoses (95% CI) | 4.7 (4.5 to 4.9) | 6.2 (5.7 to 6.7) | 1.5 (1.1 to 2) | P<.001 |
| CCI (95% CI) | 3.2 (3 to 3.3) | 3.3 (2.9 to 3.8) | 0.1 (−0.2 to 0.6) | n.s. |
| Urg adm, % (95% CI) | 12.2 (10.3 to 14.4) | 67.1 (59.7 to 73.6) | a14.7 (10.2 to 21.2) | P<.001 |
| Stay, days (95% CI) | 4.1 (3.6 to 4.5) | 3.3 (2.8 to 3.7) | −0.8 (−1.9 to 0.3) | n.s. |
| Deaths, % (95% CI) | 0.2 (0 to 0.8) | 2.3 (0.7 to 6) | a11.7 (2.1 to 64.6) | P=.005 |
| Readm, % (95% CI) | 4.2 (3.1 to 5.7) | 21.4 (15.9 to 28.1) | a6.2 (3.8 to 9.9) | P<.001 |
| PIC, % (95% CI) | 6.2 (4.9 to 7.9) | 13.3 (9 to 19.2) | a2.3 (1.4 to 3.8) | P=.001 |
95% CI: 95% confidence interval; CCI: Charlson comorbidity index; Urg adm: urgent admissions; n.s.: not significant; NSS: not submitted to surgery patients; PIC: interdepartmental referrals; Readm: readmissions; SS: submitted to surgery patients; SSI: statistical significance.
Results: Otolaryngology.
| SS | NSS | Difference/ORa | SSI | |
|---|---|---|---|---|
| No. | 368 | 35 | ||
| Age, years (95% CI) | 44.7 (43 to 46.4) | 56.3 (49.3 to 63.3) | 11.6 (5.7 to 17.5) | P<.001 |
| Female patient, % (95% CI) | 43.8 (38.8 to 48.9) | 22.9 (11.8 to 39.3) | a0.4 (0.2 to 0.9) | P=.02 |
| No. of diagnoses (95% CI) | 2.5 (2.3 to 2.7) | 5.3 (4 to 6.5) | 2.8 (2 to 3.5) | P<.001 |
| CCI (95% CI) | 1.2 (1 to 1.4) | 2.5 (1.7 to 3.4) | 1.3 (0.6 to 2) | P<.001 |
| Urg adm, % (95% CI) | 8.2 (5.7 to 11.4) | 85.7 (70.2 to 94.2) | a67.6 (24.4 to 187) | P<.001 |
| Stay, days (95% CI) | 2.2 (1.7 to 2.6) | 4.6 (3.2 to 6) | 2.4 (0.9 to 3.9) | P=.002 |
| Deaths, % (95% CI) | 0 | 0 | – | – |
| Readm, % (95% CI) | 1.4 (0.5 to 3.2) | 11.4 (3.9 to 26.5) | a9.4 (2.4 to 36.7) | P=.001 |
| PIC, % (95% CI) | 5.7 (3.7 to 8.6) | 22.9 (11.8 to 39.3) | a4.9 (2 to 12.1) | P=.001 |
95% CI: 95% confidence interval; CCI: Charlson comorbidity index; Urg adm: urgent admissions; n.s.: not significant; NSS: not submitted to surgery patients; PIC: interdepartmental referrals; Readm: readmissions; SS: submitted to surgery patients; SSI: statistical significance.
Our results show increased mortality, more readmissions and more interdepartmental referral requests to the medical area in NSS patients than in operated patients. These findings could indicate that surgeons have more difficulty in treating these patients. To the extent of our knowledge, there are no publications analysing this particular group of patients.
The observed increased mortality may, at least partially, show that surgeons have a greater difficulty when treating these patients. Some patients with surgical indication may be considered “terminal” and may not be operated on because of this, which does not mean that it is more difficult to provide medical care. Other patients should have been operated on, but were not because of their clinical situation or complications that finally led to their death. In this case, it might have been more difficult to treat them. We should bear in mind that medical complications are involved in more than 80% of surgery-related deaths.6
A piece of information that we did not expect to find was a similar average stay in both groups, except for ORL. A possible explanation for this finding is that the stay of NSS patients may have been shortened due to early discharges, as evidenced by their increased number of readmissions. Another possible influencing factor is increased mortality, supported by the fact that, in ORL, the only department in which mortality was similar in both groups, there are differences regarding their corresponding stays.
No distinction was made between urgent and scheduled readmissions, and the department to which the patient was readmitted was not recorded either. If the patient was urgently readmitted within 15 days in a medical department, we believe that the main reason, in most of the cases, was the inadequate medical assessment and follow-up during the patient's admission to the surgical department. If the patient was urgently readmitted to the corresponding surgical department, the main reason in this case would be early discharge, which may also indicate insufficient medical care. If the patient was scheduled to be readmitted to the same surgical department, the reason probably was that the patient could not be operated on while admitted due to complications or breakthrough problems. In this case, there may also be other causes unrelated to medical difficulties, such as failure to operate due to logistic or surgical scheduling problems, among others, or when the patient is admitted for the diagnostic test and is rapidly scheduled to be operated on. These cases are very uncommon, since most NSS patients are emergency admissions. We consider that the early readmission indicates treatment problems during the previous admission in most of the cases.
The 4 studied departments request more interdepartmental referrals for NSS patients than for operated patients. This clearly shows that they have more difficulty in treating the former. This finding has a considerable practical significance because most of the interdepartmental referrals are requested in a delayed manner, when the complication has been fully determined, which leads to a more difficult treatment in the future.7
Though we have found statistically significant differences regarding age, in one way or another, in 3 of the 4 studied departments, we consider that this is not an influencing factor, since the average age is below 65 years. Sex is probably not an influencing factor either, since differences present in only one department, ORL, may have been due to the comorbidities specific of that speciality. In this case, comorbidity is more common in male patients.
Except for the Gynaecology department, probably due to the young age of the patients and their specific disease, the differences observed regarding the number of diagnoses and CCI help to explain why surgeons find it more difficult to treat NSS patients. Both parameters8 make it possible to assess the complexity and the medical comorbidity in the case of CCI, which are clearly higher in NSS patients.
Emergency admissions may also be related to surgical difficulties, since admissions are much higher in number in NSS patients, as observed in the 4 analysed departments. It is widely known that patients requiring urgent surgery have more complications and a worse prognosis than patients with scheduled surgery,6,9 which, in turn, may prevent patients from undergoing scheduled interventions. In this sense, the placement of internists in the Orthopaedic Surgery and Traumatology department reduced the number of NSS patients mainly at the expense of emergency admissions.3
The current organisation of many surgical departments makes it difficult to carry out the follow-up of patients as surgeons would want to. Besides, surgeons are increasingly subspecialising, which leads to a greater need for support from the internist during the surgical admission.10 All of this, together with the idiosyncrasy of surgical specialists, who feel much more comfortable during the surgical process because of their usually well-defined circumstances and times, and less comfortable with the “medical” patient, helps to explain the difficulties that may arise when treating NSS patients.
This study has several limitations. It was conducted in only one hospital, so its results and conclusions may not be applicable to other centres. This is a retrospective study with implicit limitations, in which data were obtained from administrative databases, although these databases largely seem to coincide with clinical records.11 This study only assesses interdepartmental referrals requested during working hours, excluding those made to on-call doctors. However, the characteristics and nature of interdepartmental referrals seem to be similar in both cases.12,13 Due to the methodology used and to the fact that data were obtained from the hospital MBSD for this study, we could not determine which NSS patients should have been operated and which ones were not, nor the reasons why they did not undergo surgery.
In conclusion, non-operated patients admitted to surgical departments have an increased mortality, more readmissions and more interdepartmental referral requests than operated patients. All of this probably results from a greater medical complexity and the urgency of the admission. This seems to indicate that surgeons find their treatment to be more difficult. As a result, we could suggest that these patients should be referred to medical departments or, what seems more adequate, should remain in the corresponding surgical departments but with the co-management of the Internal Medicine department.
Conflict of InterestThe authors declare that there are no conflicts of interests.
Please cite this article as: Montero Ruiz E, Barbero Allende JM, Melgar Molero V, Rebollar Merino Á, García Sánchez M, López Álvarez J. ¿Tienen los cirujanos más dificultades en la atención de los pacientes hospitalizados no intervenidos respecto a los intervenidos? Cir Esp. 2015;93:334–338.
