


Titanium dioxide (TiO2) was synthesized by microwave assisted sol–gel. The effect of the acid type used as catalyst on the phase transformation of TiO2 was investigated (hydrochloric or acetic acid). The samples obtained were characterized by scanning electron microscopy (SEM), this micrographs showed particles with irregular shapes. The results of Fourier transform-infrared spectroscopy (FT-IR) and X-ray photoelectron spectroscopy (XPS) showed present signals of O and Ti. When hydrochloric acid was used as catalyst, three titania polymorphs were detected by X-ray diffraction (XRD), anatase, rutile and brookite, where the crystallite size was in the range of 9 and 16nm. On the other hand, a single anatase phase was formed when acetic acid was used after only 15min of reaction time. The anatase average crystallite size was obtained between 11 and 22nm.
El dióxido de titanio (TiO2) se sintetizó mediante sol-gel asistido por microondas. Se investigó el efecto del tipo ácido utilizado como catalizador en la transformación de fase del TiO2 usando ácido clorhídrico o ácido acético. Las muestras se caracterizaron por microscopía electrónica de barrido (SEM), estas micrografías mostraron partículas de formas irregulares. Los resultados de la espectroscopia infrarroja de transformada de Fourier (FT-IR) y la espectroscopia de fotoelectrones de rayos X (XPS) mostraron signos de O y Ti. Cuando se usó ácido clorhídrico como catalizador, se detectaron tres polimorfos de titania por difracción de rayos X (XRD), anatasa, rutilo y brookita y el tamaño del cristalito estaba dentro del intervalo de 9 y 16nm. Por otro lado, se formó una sola fase de anatasa cuando se usó ácido acético después de solo 15min de tiempo de reacción. El tamaño de cristalito promedio de anatasa estaba dentro de 11-22nm.
Titanium dioxide (TiO2) is commonly used for photocatalytic purification of water with pollutants, due to its characteristics of physical and chemical stability, non-toxicity and its large band gap energy (3.2eV for anatase) [1–3]. Numerous authors have studied different synthesis methods for finding the anatase and rutile phases, reducing reaction times and nanometric particles sizes have been obtained [4,5]. The sol–gel method allows the formation of nanostructured materials with controlled porosity and shape as either powders or films. This process provides excellent chemical homogeneity and the possibility of deriving unique metastable structures at low reaction temperatures [6,7]. Mahshid et al., used the sol–gel method to produce titanium oxide with two different polymorphs, reported that water/titanium molar ratio (r) has been employed to control the hydrolysis and condensation of titanium isopropoxide in solution [8].
The synthesis of microwaves posse as the advantages that is carried out in a short period of reaction time and that small particles can be obtained, with a narrow size distribution and high purity [9,10].
The microwave method application be showing an effective way to improve crystallinity of TiO2 in rutile phase [11].
Also, the effect of the acid catalyst increase in crystal size as the acid concentration increases and the addition of H2SO4, during the synthesis exerts an inductor-agent effect in the formation of the anatase phase. Ding et al. obtained anatase nanocrystals of TiO2 with uniform size and shape via microwave-assisted route, this method presents some advantages: the process is fast and simple, the size of nanocrystals can be easily controlled [12,13].
The sol–gel technique was combined with the microwave method for the synthesis of metal oxide nanoparticles. This route of synthesis is clean, inexpensive, reduces energy consumption, is eco-friendly, fast and it uses a conventional method of heating. Singh et al., reported low synthesis temperatures for nanocrystalline zirconium dioxide using a microwave assisted method [14].
Simonsen et al. obtained TiO2 films by microwave assisted sol–gel technique, and studied the influence of OH groups on the photocatalytic activity of TiO2. Their investigation showed that this technique produces highly homogeneous TiO2 thin films, without the need of a heat treatment at high temperature for crystallization [15].
Cui et al. synthesized anatase TiO2 nanotubes using microwave-assisted hydrothermal method, the conventional hydrothermal synthesis method exhibit long reaction time and large energy consumption, while microwave-assisted method offers more rapid heating, higher yield and better reproducibility of products [16]. The use of microwave energy to carry out chemical reactions have significant attracted owing to it a facile, highly efficient and environmentally friendly method [17].
The object of this work is obtain TiO2 by microwave-assisted sol–gel method, studying the effect of the catalysts (hydrochloric or acetic acid) on the formation the crystalline phases of TiO2. These materials are potential candidates as photocatalytic materials used in purification of water or disinfection.
Materials and methodsMaterialsFor the TiO2 synthesis, the precursor used was a titanium (IV) isopropoxide 97% (Aldrich). The solvent was 2-propanol (99%, J.T. Baker), distilled water was used to perform the alkoxide hydrolysis and either acetic acid (99%, J.T. Baker) or hydrochloride acid (99%, Malinckrodt Chemicals) were used as catalysts.
Preparation of TiO2A solution of 2mL of titanium (IV) isopropoxide, 30mL of 2-propanol and 2mL of either acetic acid pH 3 or hydrochloric acid 3M pH 1.3 was added to a Teflon vessel of a Mars digestion microwave equipment. This equipment was programmed at 400W of power at a temperature of 80°C. Three different reaction times were used: 15, 30 and 60min. The obtained sol was kept at room temperature for 24h. Then, 8mL of water were added to form a gel which was dried at 100°C for 24h. This gel was calcined at 400°C for 3h. The agglomerates obtained were ground and sieved through a 325 mesh.
The materials synthesized were identified as THMW and TAMW according to the catalyst used, hydrochloric acid or acetic acid glacial, respectively.
Characterization of TiO2Materials were characterized using the following techniques: thermogravimetric analysis (TGA, DL402 DC), X-ray powder diffraction (XRD, Philips® Mod. X’Pert PW3040) using a current of 30mA and a voltage of 40kV in a 2θ range from 10° to 80°, infrared spectroscopy (FT-IR, Thermo Scientific Nicolet iS5), scanning electron microscopy (SEM, Phillips XL30), energy dispersive spectroscopy (EDS) and BET specific surface area (NOVA 2000e Quantachrome Instruments). XPS analysis was performed using a K-ALPHA spectrophotometer (Thermo Scientific) with a monochromatic X-ray source with binding energy of 0–1350eV and a depth of 400μm.
Results and discussionsThermogravimetric analysis are shown in Fig. 1(a). Sample THMW showed a weight loss of 9wt% from room temperature up to 100°C, which is associated to the solvent and the evaporation of absorbed water. A second weight loss of 8wt% was observed from 100 up to 400°C, which can be attributed to the organic compounds and water evaporation. This is in agreement with the results reported by Zhu et al., that they synthesized TiO2 by a conventional sol–gel method. They observed a weight loss of 11wt% in the range of 200 to 320°C, using the TiCl4 as precursor [18]. Three weight losses can be observed in the sample TAMW, the first loss from room temperature to 100°C, which corresponds to water evaporation, and the second (100–300°C) and third losses (300–400°C) to the remaining organic compounds evaporation [19]. Fig. 1(b) shows the DTA results for both materials, TAMW and THMW as observed they show similar behavior. In the DTA analysis corresponding to TAMW, the one endothermic peak at 86°C can be attributed to desorption of water, while the two exothermic peaks at 350°C and 800°C, the first peak associated to the formation anatase phase and the second peak indicated the formation of the rutile phase. The THMW material exhibits one endothermic peak 79°C which associated to water evaporation. This observation is supported by the weight loss of about 9% observed in the TGA. Two exothermic peaks at 386°C corresponding to the formation anatase and 900°C showed the formation of the rutile phase.

Fig. 2 shows the XRD patterns of the materials synthesized with hydrochloric acid (THMW) at different reaction times. The planes (101), (004), (200), (211) associated to 2θ=25.3°, 38°, 48° and 54°, respectively correspond to the anatase phase (JCPDS 21-1272) with a percentage of phase 40–45%, a peak at 2θ=27.6, matching to the (110) plane, corresponds to rutile (JCPDS 21-1276) with a percentage of phase 7–14% and finally, a peak assigned to brookite phase at 2θ=30 (121) is also observed with a percentage of phase 44–51%. These phases were observed in all the samples synthesized at different reaction times. The crystallite size was determined using the Scherrer equation [20] and values of 9–16nm were obtained, and the cell parameters were a=b 3.79Å and c=9.35Å. Nikkanen et al., reported the effect of the addition of different HNO3 solutions during the synthesis of TiO2 by sol–gel method only detecting the presence of anatase and rutile phases [21].
.")
Fig. 3 shows the XRD patterns of the powders corresponding to TAMW. All the diffraction peaks are assigned to anatase TiO2 (JCPDS 21-1272) in all samples 100% anatase was obtained. The planes (101), (004), (200), (211) are associated to 2θ=25.3°, 37.8°, 48° and 53.8°, respectively. The crystallite size was presented the range of 11 and 22nm and the cell parameters were a=b 3.79Å, c=9.51Å, corresponding of the tetragonal anatase. Mohammadi et al., reported the synthesis of TiO2 by sol–gel method, obtained powders which presented a mixture of anatase and rutile using a reaction time of 2h [22]. In this work, the anatase phase was obtained after only 15min, this reaction time is considerably shorter than that required when using the conventional sol–gel method. Moreover, the formation of rutile and anatase phases is determined by pH of reaction, Yambi et al. investigated the crystal phase control for titanium dioxide films by sol–gel method, they found that the formation the rutile phase was obtained at 0.5–1.3 pH and anatase phase at 2–3 pH [23]. As mentioned above, the pH obtained in this work when using hydrochloric acid was 1.3.
.")
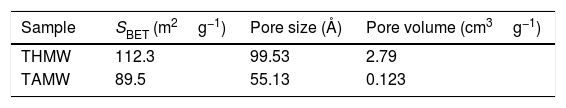
The surface area of the THMW and TAMW samples measured by BET method (SBET) are shown in Table 1. As observed, when hydrochloric acid was used (THMW), the measured surface area was 112.3m2g−1; a smaller value, 89.5m2g−1, obtained when acetic acid was applied as a catalyst (TAMW). These values are higher than those published by Santana et al., who reported surface area values of 80m2g−1 when using hydrochloric acid in a conventional sol–gel method [24]. This indicates that materials with larger surface area are obtained, by the microwave assisted sol–gel method. The pore volume distribution demonstrates that the microwave assisted using hydrochloric acid (THMW) produce materials with pores larger (2.79cm3g−1) that obtained conventionally (0.32cm3g−1) [25]
The FT-IR spectra are shown in Fig. 4. In all of them can be observed, a band within the range of 409 and 420cm−1 that corresponds to the O–Ti–O bond. The absorption bands of the stretching vibration of the O–H (3224cm−1) and the peak at 1630cm−1 indicate the absorption of water in all the samples apart from that corresponding to TAMW-60 due to the long reaction time used in this case. Hema et al., who used a conventional sol–gel method, observed a peak at 412cm−1, that corresponds to Ti–O vibrations [26].
 THMW and (b) TAMW. Expressed as arbitrary units (a.u.).")
Fig. 5 shows SEM images at low magnifications of synthesized materials. Particles of irregular shapes and different sizes can be observed for both samples (THMW and TAMW). These morphologies are in agreement with those reported by Prasad et al. in their investigation on the effect of ultrasound amplitude on the morphological properties of titanium dioxide [27].
 TAMW and (b) THMW.")
The SEM images the TiO2 samples obtained at higher magnifications are shown in Fig. 6. It can be observed for both samples the presence of agglomerates due to the high surface area. These morphologies are similar to those reported by Thangavelu et al., who found that titania powders tend to agglomerate [28]. The corresponding EDS spectra show the presence of only titanium and oxygen. Moreover, the semi-quantitative analysis was 51.49wt%, Ti and 48.51wt% O2 (Fig. 7b), 35.78wt% Ti and 64.22wt% (Fig. 7d) which indicates the purity of materials [29].
 THMW-60, (c, d) TAMW-60.")

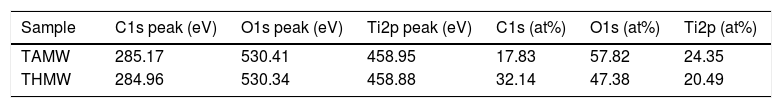
In Fig. 7, XPS spectra for the sample TAMW are shown. In this spectra, the signals of C1s at 285.17eV, O1s at 530.41 and Ti2p at 458.95eV. Jiaguo et al. (2000) have reported that during the synthesis of TiO2 thin films with different surface structures prepared from alkoxide solutions containing polyethylene glycol via the sol–gel, analogous XPS signals were obtained to those presented in this work, for C1s (284eV) and O1s (531eV) and a weak signal for Ti2p at 458eV, but the reaction times were longer [30].
Additionally, Choi et al. (2005), obtained spectra with similar signals corresponding to of photoemitted electrons of TiO2. They prepared TiO2 films mesoporous by sol–gel and TiO2/Al2O3 composite membranes for environmental applications. Compared to our work, where the route to prepare the compounds is more complicated and in our study only requires a one step [31].
Compared with conventional heater, the microwave sol gel process is a good alternative method, which does not generate reaction by products and avoids the generation of waste.
The XPS spectra for the sample THMW are present in Fig. 8. The signals obtained were in at 284.94, 530.34 and 458.88eV for the C1s, 1O1s and Ti2p. Which is in accordance with the film thin of TiO2 synthesized with hydrochloric acid reported by Jingo et al. [32].

In Table 2, signals of photoemitted electrons from indicated atoms corresponding to the peaks and the atomic percentages of the sample TAMW and THMW.
Characteristic signals of photoemitted electrons from indicated atoms for analyzed samples by XPS and their respective atomic percentages.
| Sample | C1s peak (eV) | O1s peak (eV) | Ti2p peak (eV) | C1s (at%) | O1s (at%) | Ti2p (at%) |
|---|---|---|---|---|---|---|
| TAMW | 285.17 | 530.41 | 458.95 | 17.83 | 57.82 | 24.35 |
| THMW | 284.96 | 530.34 | 458.88 | 32.14 | 47.38 | 20.49 |
eV: electronvolts.
A TiO2 synthesis method was developed by microwave assisted sol–gel technique. Synthesis was performed under acidic conditions using either hydrochloric or acetic acid. Single anatase phase was formed after a reaction time of only 15min, when used acetic acid as catalyst. This period of time is considerably shorter than that required for the conventional sol–gel method. On the other hand, when hydrochloric acid was used as catalyst three titania polymorphs were detected: anatase, rutile and brookite.
The authors kindly acknowledge the scholarship (387368) provided by CONACYT-Mexico.

