


Crystals formed during glost firing provide an attractive appearance to the product and also increasing the competitiveness of it. However, crystal formation is not only related to glaze composition but also related to the substrate that the glaze was applied and the firing parameters that the product fired. In this study, the effect of firing process as well as glaze and body composition were studied. The parameters related the body such as porosity, density and thickness and as well as the parameters related the glaze such as density and thickness were keeped constant values. Glazes that contained Fe2O3, CoO and CuO were applied on the substrates have two different compositions. The samples were fired at two different heating cycles. The glazes were investigated by hot stage microscopy and DTA analysis. The phases formed on the glaze surface and in the bodies were determined by XRD analysis. Microstructural evaluations were performed by SEM and EDX analysis. The results were scrutinised according to the body and glaze composition and firing cycle parameters.
Los cristales formados en la cocción del esmalte proporcionan un aspecto atractivo al producto, y también aumentan la competitividad del producto. Sin embargo, la formación de cristales no solo está relacionada con la composición del esmalte, sino también con los parámetros sobre el proceso de cuerpo y cocción. En este estudio, se estudiaron los efectos del proceso de cocción y la composición del esmalte y del cuerpo. Para eliminar los efectos de los parámetros como la temperatura de cocción, la porosidad, la densidad y el grosor de cuerpo, y como la densidad y el grosor del esmalte el estudio se ha realizado proporcionando valores constantes. Sobre los cuerpos con dos composiciones diferentes se aplicaron los esmaltes que contenían Fe2O3, CoO y CuO. Las muestras fueron cocidas a dos ciclos de calentamiento diferentes. Los esmaltes se investigaron mediante microscopía de calefacción y análisis DTA. Las fases formadas en la superficie del esmalte y en los cuerpos se determinaron mediante análisis por XRD. Las evaluaciones microestructurales se realizaron mediante análisis SEM y EDX. Los resultados se examinaron de acuerdo con la composición del cuerpo y el esmalte, y los parámetros del ciclo de cocción.
Glazes are used to form a vitreous coating to a certain extent and usually prepared from fused silicate mixtures with fusion-bonded to ceramic surface. Generally, the glaze is composed of an amorphous phase, closed bubbles and some amount of crystalline phases [1]. There are many types of glazes, designed for a variety of applications and for firing at different temperature ranges. Glazes classified as crystalline are those in which individual crystals can be distinguished between the glaze surface and the glassy matrix. Macro-crystalline glaze is a devitrified glaze which consists of crystalline phases produced during cooling nucleation and growth process. Crystalline effected glazes are used for whiteware products to enhance the surface aesthetic properties.
Crystallisation of the glaze depends on the composition of the glaze, dwelling temperature, time and cooling process of the firing cycle. Diffusion plays an important role in the formation of individual crystals in the melt, and rests on the time, temperature and viscosity conditions only. When a silicate or mixture of silicate melt cools, the thermal motion of their atoms or aggregations diminishes, because of crowding together of these units, the strengthening of the bonds, thermal contractions and an increase in viscosity [2]. Tamman has shown that the formation of visible crystals depends upon three conditions: the number of nuclei formed, the rate of growth of crystals, and the viscosity of the melt [3]. The separation of crystals from a melt or glaze involves two processes. First, the nuclei or the seed upon which crystals grow must be formed. This occurs when a certain number of ions collects or aggregates. After these centres or nuclei have been formed, the second stage, crystal growth, can proceed. As the melt begins to cool down, the number and the rate of nuclei formation increases until it reaches its maximum level. As the nuclei grows, they become crystallites and their rate of growth is equal to the rate of crystallisation. The factors, which influence crystallisation of the solution, are: (1) the number of phases separated, (2) the type and concentrations of impurities (3) viscosity, (4) type of nuclei (5) diffusion coefficients and (6) time–temperature relations [2]. Zinc-based glaze systems generally tend to form either fine-crystalline zinc aluminate (gahnite) ZnOAl2O3 or large crystalline zinc silicate (willemite) 2ZnOSiO2[4–6]. Titania is often used in the glaze recipe, as seed. Titanium is an important element in glass technology as one of the most efficient nucleating agent used for the fabrication of glass–ceramics. A nucleating agent can promote nucleation by accelerating phase separation or by lowering the energy barrier of nucleation [7,8].
Addition of coloured elements found in a particular section of the Periodic Table known as the transition element's oxide forms such as iron, copper and cobalt oxides can generate crystalline effects in glazes [9]. There are two main mechanisms for colouring in glazes: (1) inclusions or mixtures of macroscopic coloured solid particles of pigments or stains and (2) colour development in the integral part of the glass matrix, but not necessarily part of the fundamental silicate structure. The latter can be subdivided into two types: (a) those in which the colour is derived from soluble coloured ions forming the part of the fundamental silicate structure and (b) those which are colloids distributed throughout the glass. Therefore, there are two types of coloured glasses, without added pigments, the “solution” or ionic type and the “nucleated colloid” type [2]. Cobalt is a powerful colourant and as little as 0.02% of CoO produces a noticeable level of tint in transparent glaze. Copper is another strong colouring element, giving a wide range of colours from blue to green and in special circumstances “red” depending upon the composition and the firing atmosphere. Iron compounds are present in all ceramic raw materials. As a colourant, iron reacts on a wide variety of ways depending on the glaze composition and the atmosphere in which it is fired [7].
Once a liquid phase is formed through the heat treatment process, the glaze melts and the capillaries towards the pores of the substrate become strongly diffused. At this stage, chemical reactions take place between the glaze and the substrate and an interface layer is formed. The parameters that determine the formation process of the interface layer are (1) glaze viscosity and surface tension (2) substrate composition and porosity [10,11]. The reaction at the interface must be sufficient to hold the glaze to the body. The amount of glaze penetration also affects glaze fit. The amount of penetration can vary drastically and depends chiefly on the glaze composition and the character of the body. These intermediate compositions can be expected to have different viscosities and surface tensions and consequently have different powers to release bubbles. The same glaze fired on a variety of bodies can give quite different surface qualities because of this factor [12,13].
In this study, two substrates with different chemical compositions were glazed with the ZnO and CoO, CuO and Fe2O3 based glazes and parameters related to interface layer affecting the process of crystal formation on the glaze surface were investigated.
ExperimentalThe chemical analysis results of the compositions of the substrates are given in Table 1. Substrates were shaped by Dorst isostatic press with a pressure of 260 bars. Samples were bisque fired at 900°C. Open porosity of the samples were measured by Archimedes principle (ISO 10545-3).
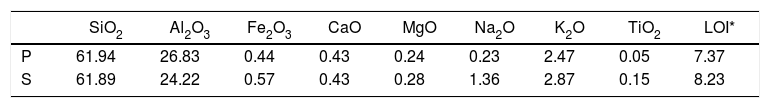
Chemical analysis results of the substrates wt.% (P: porcelain body, S: stoneware body).
| SiO2 | Al2O3 | Fe2O3 | CaO | MgO | Na2O | K2O | TiO2 | LOI* | |
|---|---|---|---|---|---|---|---|---|---|
| P | 61.94 | 26.83 | 0.44 | 0.43 | 0.24 | 0.23 | 2.47 | 0.05 | 7.37 |
| S | 61.89 | 24.22 | 0.57 | 0.43 | 0.28 | 1.36 | 2.87 | 0.15 | 8.23 |
The glaze recipes (G1, G2 and G3) were determined after a series of trials. The initial points of the recipes were determined according to a literature review [2,3,9,13–16]. Results of the experimented recipes were systematically evaluated. Thus, some raw materials were removed and new ones were added. Evaluated results show that G coded glaze was both suitable for S (stoneware) and P(porcelain) bodies from the perspective of thermal expansion coefficient. Thermal expansion coefficient (CTE) results of the bodies and the glazes were determined by dilatometer (Netzsch PC 402). The same basic glaze recipe as coded G was used for CuO, CoO and Fe2O3 based glazes.
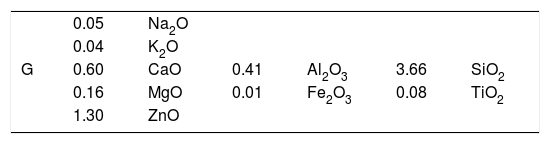
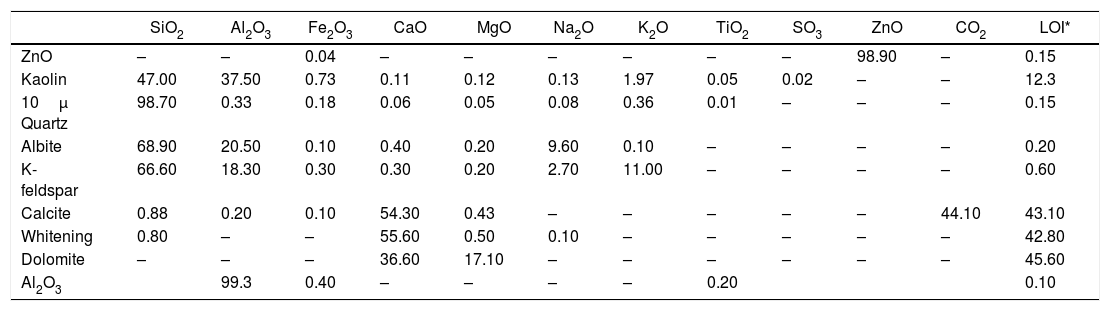
The seger analysis of G is given in Table 2. For the CuO based glaze, crystallisation was not observed until TiO2 was added. The amount of TiO2 was determined after a series of trials by increasing the amount of TiO2 from 0.2 to 2%. The experimental results show that crystals were formed when 2% of TiO2 was added to G glaze. Quartz, albite, K-feldspar, whiting, dolomite, kaolin, ZnO, TiO2, CuO, CoO and Fe2O3 were used to produce G glaze. Chemical analysis results of the raw materials used in the compositions are given in Table 3. After accurate weighing of all raw materials, carboxyl methyl cellulose (CMC), sodium tripolyphosphate (STPP) and water were mixed in a jet mill for 15min.
Chemical analysis of raw materials in the glaze recipes (wt.%).
| SiO2 | Al2O3 | Fe2O3 | CaO | MgO | Na2O | K2O | TiO2 | SO3 | ZnO | CO2 | LOI* | |
|---|---|---|---|---|---|---|---|---|---|---|---|---|
| ZnO | – | – | 0.04 | – | – | – | – | – | – | 98.90 | – | 0.15 |
| Kaolin | 47.00 | 37.50 | 0.73 | 0.11 | 0.12 | 0.13 | 1.97 | 0.05 | 0.02 | – | – | 12.3 |
| 10μ Quartz | 98.70 | 0.33 | 0.18 | 0.06 | 0.05 | 0.08 | 0.36 | 0.01 | – | – | – | 0.15 |
| Albite | 68.90 | 20.50 | 0.10 | 0.40 | 0.20 | 9.60 | 0.10 | – | – | – | – | 0.20 |
| K-feldspar | 66.60 | 18.30 | 0.30 | 0.30 | 0.20 | 2.70 | 11.00 | – | – | – | – | 0.60 |
| Calcite | 0.88 | 0.20 | 0.10 | 54.30 | 0.43 | – | – | – | – | – | 44.10 | 43.10 |
| Whitening | 0.80 | – | – | 55.60 | 0.50 | 0.10 | – | – | – | – | – | 42.80 |
| Dolomite | – | – | – | 36.60 | 17.10 | – | – | – | – | – | – | 45.60 |
| Al2O3 | 99.3 | 0.40 | – | – | – | – | 0.20 | 0.10 |
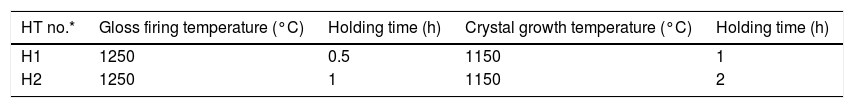
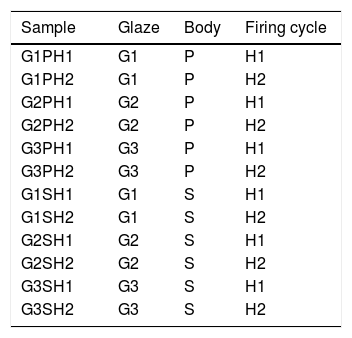
Glazes were applied onto biscuit fired bodies by spray gun at the density of 1.50–1.51g/cm3. The thickness of the raw glazes were ∼500μm. The thickness of the glazes was measured by pocked pen microscope before glost firing (E.J. Payne Ceramic, X50, MIC050). Samples were gloss fired in laboratory type Forno kiln by two different firing cycles. Heat treatment parameters are given in Table 4. Gloss firing temperature and the crystallisation temperature during cooling were the same but the holding times were different. The surfaces of the samples were photographed by Universal Clip type LED Cellphone Microscope (60×). Heat microscopy analyzes of the prepared glazes were investigated using Misura 3.32-ODHT-HSM 1600/80 (Expert System Solutions) brand and model using a dual-cam contactless optical dilatometer. The measurement was carried out at a temperature of 1400°C for a period of 30min and at a total firing time of 180min. The glass transition (Tg) and crystallisation temperatures (Tp) of the raw glaze sample was determined using a simultaneous thermal analyzer (STA Setaram Labsyevo). The measurement was carried out at a temperature of 1400°C by 10.0K/min in air atmosphere. The detection of the phases formed in the fired product was carried out with a Rigaku Rint 2000 XRD device. For microstructural examinations, secondary electron images were taken with scattered electron microscopy (SEM. Zeiss Supra 50 VP) at the fractured surfaces of the samples. Since the number of the variables in the study was too much, the coding system was created as indicated in Table 5.
Experimental heat treatment parameters.
| HT no.* | Gloss firing temperature (°C) | Holding time (h) | Crystal growth temperature (°C) | Holding time (h) |
|---|---|---|---|---|
| H1 | 1250 | 0.5 | 1150 | 1 |
| H2 | 1250 | 1 | 1150 | 2 |
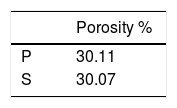
Porosity results of the bodies after biscuit firing at 900°C were given in Table 6. In this study, although the substrates had different compositions, they had almost the same porosity after fired at 900°C. Kaolin (Al2O3·2SiO2·2H2O), the major raw material of porcelain composition undergoes dehydroxylation at around 550°C and forms metakaolin (Al2O3·2SiO2). Then, in the temperature range 950–1000° C, metakaolin decomposes into spinal type phases with the liberation of amorphous silica. In this temperature range feldspar reacts with silica to form eutectic. After 900°C, density slightly rises up by surface diffusion mechanism [19]. Although two different whiteware body compositions were used, the porosity were almost the same because densification not started at the biscuit firing temperature at 900°C.
The developed phases in the bodies of P and S at the firing cycle of H1 were determined corresponding to XRD patterns exhibited in Fig. 1. Quartz and mullite were the phases in the S body whereas quartz, mullite, corundum and cristobalite are the phases in the P body. A fired porcelain consists predominantly of mullite, glass and undissolved quartz [20]. Corundum was caused by the presence of Al2O3 in the body composition. Crystobalite is a high temperature silica polymorph stable in the temperature range of 1470–1705°C but it also develops at T≤1000°C from SiO2 glass. While cooling, β-cristoballite turns into its tetragonal α phase at 270°C, not being able to overcome the activation energy barrier to change into the stable silica phase [21].
Optic microscope images of the samples
Microscope images of the samples of G1PH1, G1PH2, G1SH1 and G1SH2 (60×) are shown in Fig. 2. G1SH1 notations were introduced as glaze–body and heating treatment respectively. The sample of G1PH1, a smooth glaze surface was formed and no crystals or air bubbles were observed. However, when this sample was fired at H2 (G1PH2), numerous air bubbles in the glaze surface were observed. The presence of bubbles tends to reduce the physical strength of glazes and make them more susceptible to physical damage by abrasion in service. Bubbles also reduce the resistance of glazes to attack or corrosion by chemicals and detergents. It was found that the substation of alumina for silica in the body was an effective means for reducing the bubble count in fired glazes [2]. On the sample of G1SH1, round-shaped crystals were observed whereas, the flower like crystals were observed on the surface of G1SH2.
: (a) G1PH1, (b) G1PH2, (c) G1SH1, and (d) G1SH2.")
The microscopy images of the samples G2PH1, G2PH2, G2SH1 and G2SH2 are given in Fig. 3. Amount of the crystals in the sample of G2PH1 was higher than that of the sample of G2PH2 due to the long dwelling time of H2. For the samples of G2SH1 and G2SH2 no crystals were observed by optic microscopy.
: (a) G2PH1, (b) G2PH2, (c) G2SH1, and (d) G2SH2.")
The microscopy images of the samples G3PH1, G3PH2, G3SH1 and G3SH2 are given in Fig. 4. On the samples of G3PH1, G3PH2, G3SH1 and G3SH2, attractive dark blue coloured crystals were observed. But the amount of the crystals changes according to the body and/or heating treatment.
: (a) G3PH1, (b) G3PH1, (c) G3SH1, and (d) G3SH2.")
Factors that cause or inhibit crystal formation in the samples were discussed in more detail in the “XRD analysis” section.
XRD analysisThe phases developed on the surfaces samples of G1PH1, G1PH2, G1SH1 and G1SH2 were determined corresponding to XRD patterns exhibited in Fig. 5. The main phases in the G1SH1 were willemite and anatase. But for G1SH2, when the holding time at the gloss firing temperature increased from 0.5h to 1h and at the crystallisation temperature from 1h to 2h, anatase crystals were not detected. This probably due to the dissolution of the anatase crystals because of the increasing of holding time at the gloss firing temperature. Moreno et al. indicated that the addition of anatase in glaze in small percentages (3%) lead to a noticeable increase in the bluish colour due to the separation of immiscible liquid phases that occurred as a result of the total dissolution of anatase during firing [22]. When the intensities of the willemite peaks are compared for both samples, the intensity of the willemite peak in the sample exposed to the long holding time at crystallisation temperature was more intense. Therefore, it can be indicating that the amount of willemite was more. Depending on the content in the chemical composition into material, ZnO could be a flux, opaque factor and/or promote crystallisation of zinc orthosilicate (willemite crystals – Zn2SiO4) [23]. The crystallisation of a glass, consists of a nucleation stage, in which small seeds or nuclei develop within the glass, followed by heating to a higher temperature (a crystal growth step), which facilitates the enlargement of crystals until they reach the desired size [24]. Therefore, long holding time at crystallisation temperature was the factor that increases the amount of willemite crystals for the samples of G1SH2.

For the samples of G1PH1 and G1PH2, no peak as crystalline phase was detected. Though these samples have the same glaze and heat treatment parameters like G1SH1 and G1SH2, the substrates were different. Absence of crystal phase formation of the G1PH1 and G1PH2 can be explained by the fact that the chemical and phase structures of the substrates of P and S were different. Thomas et al., stated that the body is dissolved by the glaze and the glaze penetrates into the body and the rate of solution of body by glaze varies according to the body and glaze composition [11]. Therefore, the crystal formation is not only determining by the glaze composition but also determining by the body composition. The main difference between the chemical compositions of P and S were the amount of SiO2 and Al2O3. As the amount of both oxides increased in the melt by way of the glaze penetration to the body, the viscosity of the melt at the interlayer was more increased than at the interlayers of G1SH1 and G1SH2. The interlayer composition formed at the end of the diffusion process between G1 and P has higher viscosity at the crystallisation temperature than the interlayer between G1 and S because of the higher Al2O3 content of P. As a result of high viscosity of interlayer, surface tension of the melt increased and crystallisation has not been achieved.
The XRD patterns of the samples of G2PH1 and G2PH2 were given in Fig. 6. While the crystalline phases were Iron (III) oxide gamma and cristoballite for the sample of G2PH1, Iron (III) oxide gamma was the only crystalline phase for the sample of G2PH2. Dissolution rate of quartz in glass matrix is a function of firing cycle [25–27]. This probably due to the dissolution of crystoballite in the glassy phase because as holding time at maximum temperature increased, viscosity of the glassy phase reduced. When the peak intensities of the phases detected in the XRD analysis were compared, Iron (III) oxide gamma peak intensities were higher on the sample of G2PH1 than that of G2PH2. This also probably due to the dissolution of Iron (III) oxide gamma in the glassy phase as the holding time at gloss firing temperature increased.

Unlike the samples applied on the body P, no crystalline phase was detected for the samples of G2SH1 and G2SH2. The changed parameter of these samples was only the body. In this case, the cause of the lack of crystal can be correlated with the glaze–body interaction. Once a liquid phase forms, attack on the body begins, leading to the formation of intermediate compositions, which could be either vitreous or crystalline. The mechanism of this corrosion is similar to acid-base reactions in aqueous solution. There is subsequent diffusion of chemical species from the body and into the glaze and from the glaze into the body. Once the zone is formed, the reactions slow down [13]. As the amount of Al2O3 increases in the composition, the viscosity of the glassy phase increases [28]. In the composition of P, the amount of Al2O3 was higher than in the composition of S. Therefore, the viscosity of interlayer between G2 and S was lower than the interlayer between G2 and P. For this reason, although the crystals formed during the firing process in the samples of G3SH1 and G3SH2, as the process go on, they were dissolved. At this point, it is important to note that the formation of willemite crystals accelerates with low viscosity of the interlayer but the Iron (III) oxide gamma crystals tend to dissolve by the effect of the reduced viscosity of the interlayer.
The XRD patterns of the G3PH1, G3PH2, G3SH1 and G3SH2 are given in Fig. 7. The crystal phase in the samples of G3PH1, G3PH2, G3SH1 and G3SH2 was willemite, only. However as observed in the results of optic microscopy (Fig. 4) and XRD (Fig. 7), the amount and size of the crystals were different for the whole samples. Willemite peak intensity was highest on the sample of G3SH2 and least on the sample of G3PH1. The increase in willemite formation is related to the (1) dwelling time at crystallisation temperature and (2) viscosity of the glassy phase between the glaze and the body. The viscosity of the glassy phase increased as the amount of Al2O3 in it increased. The source of Al2O3 came from the body of P. This is the reason why a few amount of willemite was detected in the samples of G3PH1 and G3PH2.

Although the base glaze recipe was the same for all glazes (for the same firing cycle and the same substrate that glazes were applied), the additives were different such as CuO, TiO2, Fe2O3 and CoO. One of the important determinants of crystal formation was the type of additive. In the studies, when CuO added to the glaze, G, no crystal formation was seen by optical microscope. However, when CuO was added along with TiO2, it was found that crystals were formed and XRD analysis results showed that these crystals were willemite. Soliman and Kashif indicated that, in lithium borate glasses, the addition of CuO only began to form crystals after the addition of 25% mol and the structure was amorphous until 25% mol was obtained [29]. However, unlike CuO, when CoO added to the glaze recipe, crystal formation was achieved without the need for a nucleator such as TiO2. In this case, we can indicate that ability to form crystals for CoO is greater than CuO. Thakur at all indicated that addition of CoO (1%) in the composition of glass was decreased the glass transition and crystallization temperature [30]. When Fe2O3 was added to the glaze, Iron (III) oxide gamma was observed and willemite crystals were not formed. For the formation of willemite crystals, effect of nucleator such as TiO2 on the formation of willemite crystals can be studied in the further studies. The reason for the formation of Iron (III) oxide gamma was related to the addition of Fe2O3.
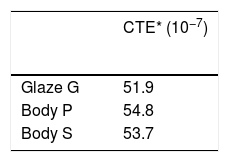
Thermal analysisThermal expansion results of the samples were given in Table 7. When the glaze has a higher coefficient of thermal expansion then the body, a result called crazing can occur. Crazing occurs because the glaze wants to contract more than the body during cooling; it is therefore placed in tension, causing cracks, crazing in the glaze [17]. If the thermal expansion coefficient of the glaze is lower than the body, glaze is places in too much compression and shivering can occur [18]. After firing, shivering or crazing was not observed for any samples.
Thermal expansion results of the glaze and bodies.
| CTE* (10−7) | |
|---|---|
| Glaze G | 51.9 |
| Body P | 54.8 |
| Body S | 53.7 |
The hot stage microscopy analysis for the glazes are given in Fig. 8. For the glaze “G1”, the softening of the glaze starts at around 1185°C and half sphere at around 1286°C as shown in Fig. 8a. The curve: between 1140 and 1170°C shows a plateau and this means that a crystallisation takes place inside the material. The crystallisation effect was also determined in the DTA analysis results. The DTA analysis results for the glaze G1 was given in Fig. 9. Glass transition occurs at 872°C and the glaze exhibits a wide exothermic peak at 1145°C, referring to willemite crystallisation and the melting starts at 1262°C. It is reported that willemite crystals are formed during isothermal holding at the crystallisation temperature [5,13]. The reason of the difference between DTA and heat microscopy results for the melting point of the glaze is related to the speed of heating of the instruments. The DTA and Hot Stage Microscopy analysis results showed that glass transition occurred before sintering and softening of the glaze started before crystallisation. Above the glass transition, temperature (Tg) particles sinter together and viscosity decreases rapidly. Depending on the firing cycle or chemical composition either crystallisation or a viscous liquid state might occur [5].
 G1, (b) G2, and (c) G3.")

The hot stage microscopy analysis results for the glaze G2 was given in Fig. 8b. The softening point was about at 1197°C and half sphere was about at 1300°C. There was a narrow plateau between 1175 and 1185°C for the glaze G2. XRD analysis results also indicated that willemite crystals was not determined for the samples of G2. As indicated in Table 4, holding time at the crystallisation temperature for H1 and H2 were 1150°C. For the glazes of G1and G3 plateau temperature ranges were approximately the same as the firing cycles of H1 and H2. The plateau that indicates the formation of the crystals for G2 glaze was between 1175 and 1185°C. If the dwelling time was increased from 1150°C to 1170–1180°C, a few willemite crystals could been formed in the samples glazed by G2. But this theory must be proved in the further studies.
The hot stage microscopy analysis results for the glaze G3 was given in Fig. 8c. The softening point was 1135°C, half sphere was 1215°C, and there was a plateau between 1110 and 1145°C. Also according to XRD results, it indicates the willemite crystallisation in the glaze.
SEM and EDX analysisThe SEM results of G1PH1, G1PH2, G1SH1 and G1SH2 were given in Fig. 10. As obtained by naked eye, there were not any crystals obtained on the surface of the sample G1PH1. A few and small crystals were obtained at the interlayer between the glaze and the body. In addition, there were not any crystals determined in the G1PH2 but as obtained by optic microscopy, so many bubbles were determined by SEM. The crystals were obtained at the interlayer between the glaze and body. These crystals were determined by EDX and the results were given in Fig. 11. Al and Zn are the main elements obtained from these crystals. According to this result, most likely, these are small gahnite crystals. Spheroid crystals were obtained in the G1SH1 and flower and snow like crystals were obtained in the G1SH2. When these crystals were analysed by EDX, it was determined that the major components of the rounded crystals include Si and Zn elements. In this case, it can be clearly stated that these crystals are willemite. In the case of snowflake and/or flower-like crystals in the sample of stoneware body (S) fired at H2, Al element was detected in major content and the other elements which were detected are Zn and Si. But according to XRD analysis results, gahnite was not determined. Therefore, it is not possible to say that these are gahnite crystals, but the origin of the formation of gahnite crystals can be mentioned. Due to the long dwelling time of the H2 firing process, the glaze interacted more with Al in the body and initiated the crystal formation process. In the study of Karasu and Turan, it was stated that the rod like crystals are willemite and the ones snow-like are gahnite [9]. The SEM images of the G3SH1 and G3SH2 from the section of the samples were given in Fig. 12. As the holding time at crystallisation temperature increased, the amount of crystals in the samples of G3SH1 and G3SH2 increased.
 G1PH1, (b) G1PH2, (c) G1SH1, and (d) G1SH2 from cross section (500×, 15kV).")
 G1SH1 and (b) G1SH2 (spot of EDX analysis was pointed as “X”).")
 G3PH1, (b) G3PH2 (500×, 15kV).")
The crystals of the sample G3PH2 were determined by EDX and as indicated in Fig. 13 detected elements were Si and Zn and also indicated by the XRD results, these are willemite crystals.
Conclusion
Although CuO, TiO2, CoO and Fe2O3 were added into the glaze that has the same composition, crystallisation effect of these oxides in the glaze completely different from each other.
For the CuO based glaze, there were not any crystal was formed until nucleating agent added such as TiO2. It was determined by XRD analysis that the formed crystals were willemite and anatase. But nucleating agent was not only determiner of the type and the amount of the crystals. The body composition that the glaze was applied was also the determiner of the crystallisation. While there were no crystals were determined in the samples that applied on body P, crystals were determined in the glaze applied on S.
For the glaze with CoO, willemite crystals were formed without nucleating agent. But the amount of the crystals in the sample that applied on the body S were more than the sample that applied on the body P.
For the glaze with Fe2O3, willemite crystals were not formed. Iron (III) oxide gamma crystals were obtained in the sample applied on the body P. Amount of the crystals were decreased as the holding time at maximum temperature was increased These crystals were not obtained in the sample applied on the body S.
While the amount of the willemite crystals tended to increase as the holding time at gloss temperature and at the crystallisation temperature increased, the Iron (III) oxide gamma and anatase crystals tended to dissolve.
Except the added oxide type and nucleating agent, other effective parameters of the crystal formation were related to the viscosity of the interlayer during firing process. The main parameter effects the viscosity of interlayer was the solubility of the body by the glaze. Effective parameters of the solubility were (1) composition of the body (2) composition of the glaze (3) holding time at maximum temperature and (4) holding time at the crystallisation temperature during cooling.
The authors are grateful to Mr. İlker PATIR for performing XRF and DTA measurements.

