


The reaction between chamotte and active carbon at high temperature and low oxygen partial pressure conditions has been investigated. Both components react at temperatures above 1400°C where cristobalite is reduced by the carbon while increases the mullite content. At 1600°C mullite tends to disappear due to the reduction reaction leading to the formation of alumina. The reaction between chamotte and active carbon in these conditions produces the reduction of silica and mullite. This process increases with the reaction time although not all the active carbon is consumed. The graphite nanodomain size of the active carbon tends to decrease with respect to the original size with both the temperature and the reaction time. The microstructures of the obtained materials present a glassy phase due to the inherent presence of impurities in chamotte, and where small particles, pores and mullite needles are also observed. The presence of this glassy phase becomes more pronounced with the treating temperature while solid particles and pores tend to disappear, moreover, the formation of the glassy phase occurs in a less extent due to the higher concentration of active carbon. The presence of the liquid glassy phase also favours the formation of the long-needle like mullite crystals.
Se ha estudiado la reacción que ocurre entre chamota y carbono activo a alta temperatura y en atmósfera con baja presión parcial de oxígeno. Ambos compuestos reaccionan a temperaturas superiores a los 1.400°C y ocurren con la reacción de reducción de la cristobalita y aumento del contenido en mullita. A 1.600°C la mullita tiende a desaparecer por reducción, lo que conlleva la aparición de alúmina. La reacción de chamota y carbono activo en estas condiciones produce la reducción de la sílice y la reducción de la mullita. Este proceso aumenta con el tiempo de reacción, aunque no se consume todo el carbón activo. El tamaño de los nanodominios de carbono tiende a disminuir con respecto a su tamaño original tanto con la temperatura como con el tiempo de reacción. La microestructura de los materiales obtenidos presenta una fase vítrea originada por las impurezas de la chamota y donde también se pueden observar pequeñas partículas, poros y agujas de mullita. La presencia de esta fase vítrea es más pronunciada con la temperatura de tratamiento mientras que las partículas y los poros tienden a desaparecer. Además, la formación de esta matriz vítrea es menor cuando aumenta el contenido en carbono. La presencia de la fase líquida de vidrio favorece la formación de agujas de mullita.
There exist different types of refractory bricks and probably the most used are those containing Al2O3 and SiO2 in their chemical composition. These aluminosilicate (Al2O3–SiO2) refractory bricks are widely used in blast furnaces, kilns, etc., and in particular, the metallurgical industry uses more that 60% of the total production of the Al2O3–SiO2 refractories [1]. Due to the need of avoiding contamination and achieving a precise chemical composition in the produced metals, the Al2O3–SiO2 refractories must present high resistance to chemical corrosion, excellent thermal shock and high mechanical properties at the highest temperatures [2,3]. For this purpose, conventional Al2O3–SiO2 refractories are often reinforced with SiC and/or C leading to an improvement in the above mentioned refractory needs [4]. It is known that SiC presents excellent mechanical resistance, high thermal conductivity and low thermal expansion coefficient, and since C is not wetted by melted metal, it has both high chemical resistance and high thermal conductivity. Chan et al., showed that the presence of both C and SiC in the refractory composition prevent the slag attack and increase the wear resistance, respectively [5]. In this sense, Al2O3–SiO2–SiC–C refractories present superior properties than conventional alumina silicate counterparts [6].
Al2O3–SiO2 refractories are mainly manufactured by chamotte agglomerated by a binder similar or selected from raw clay or ball-clay and, and in where chamotte is obtained from raw materials such as pirofilite, kaolinite, sillimanite, etc. [4]. The effect of the clays is to act as a binder and to develop plastic behaviour to the mixture for moulding the final brick. However, upon heating, clays undergo different structural transformations and chemical reactions being the first ones these transformations related to the elimination of the H2O and hydroxyls, and the second ones are related to the formation of high temperature stable compounds, which also act as refractory materials. The relative concentrations of Al2O3, SiO2 and the newly formed refractory compounds will determine the maximum temperatures and the potential applications of the produced Al2O3–SiO2 refractories [4].
One of the most used fire clays is that of the kaolinite group which contains kaolinite (Al2O3·2SiO2·2H2O) along with micas and quartz [7]. Although the use of kaolin in the production of refractory bricks is appropriate due to the plasticity and binder properties, during drying and firing, the elimination of H2O in the first place and, the chemical reactions occurring afterwards, lead to the formation of mullite (3Al2O3–2SiO2) and produce the shrinkage of the brick and the formation of cracks in the obtained bricks [8]. In order to avoid or minimize the formation of cracks, some part of the clays can be replaced by their calcined form which is known as fired refractory clay or chamotte (CH).
Al2O3–SiO2–SiC–C refractories can then be prepared by employing kaolinitic clays, CH or a mixture of both. The high temperature chemical reactions between carbon and kaolinitic clays are yet established [9] while those related to the reaction with CH are not well known. It is the purpose of this work to study these reactions and analyse the microstructures of the materials finally obtained.
2Materials and experimental procedure2.1Raw materials and experimental procedureThe CH used in this study was a calcined kaolin powder treated for 2h at 1350°C and finely sieved. The ceramic company of Guelma (Algeria) markets this CH in raw form. As it will be shown later at this temperature the main crystalline phases were mullite (70wt%) and cristobalite (30wt%) [10,11]. The chemical composition of kaolin was (in wt%): SiO2 (39.87%), Al2O3 (38.36%), Fe2O3 (1.14%), CaO (0.78%), Na2O (0.48%), P2O3 (0.02%), TiO2 (0.02%), CrO3 (0.01%), loss on ignition (17.27%). It is observed that the impurities content is about 2.45% of kaolin composition, being this data considered when analysing the experimental results.
CH was grinded with alumina balls until obtaining a powder of 42μm mean particle size distribution (PSD). This CH powder was mixed with a mixture of active carbon and kaolin agglomerates, (AC, Sigma–Aldrich, PSD<5μm) using alumina balls (diameter of 3mm) and a powder/ball ratio of 50:100 (wt%) for 24h. The obtained mixture was a homogeneous powder with a PSD whose 90% was less than 25μm (Horiba Granulometry Tech.). Two CH–AC mixtures were prepared containing 10% and 15% (wt%) of AC and these samples were then named as 90/10 and 85/15, respectively. The CH–AC powders were mixed with an organic binder and then uniaxially pressed at 130MPa in cylindrical plates for obtaining pellets of 13mm in diameter and 12mm in height. These pellets were then sintered in a Vecstar furnace in a reduced O2 partial pressure. To achieve this atmosphere during the thermal treatment, the CH–AC pellets were put into alumina crucibles filled with graphite powder and then, they were subsequently heat treated at temperatures between 1300 and 1600°C for 2 and 10h and with a heating rate of 5°C/min.
2.2Characterization techniquesThe evolution of the structural parameters of CH–AC samples, they were analysed by different techniques. The crystalline phase analysis was carried out by X-ray diffraction (XRD) using a diffractometer (Bruker AXS D8-Advance) with CuKα radiation (λ=0.154184nm with a Ni filter, 30kV, 25mA). The scanning angle was 2θ=5–80° with a recording step of 0.05° and an exposure time of 0.08s/step. The microstructure of the samples was analysed by Raman spectroscopy (Renishaw, in Via) by using a laser of 514nm. The analysis range was 100–3000cm−1 and 10 accumulations were carried out for each sample. Their microstructural evolution was also analysed by electron microscopy using a Hitachi 4700S Field Emission Scanning Electronic Microscope (FEM).
3Results and discussion3.1X-ray diffraction analysisIn order to characterize the raw materials and verify the possible formation of new phases by mechanosynthesis after the 24h mixing process, we have collected the X-ray patterns of these materials (Fig. 1). The diffractogram of AC corresponds to amorphous carbon while in the XRD pattern of CH it is detected the peaks attributed to the presence of cristobalite and mullite, which are the materials formed after the kaolin calcination [12] and there also appears a low intensity peak assigned to free quartz at 2θ=20.45. The diffractogram of the CH–AC mixture reveals the only presence of cristobalite and mullite, proving that no reaction has been initiated during mixing of the CH and AC.

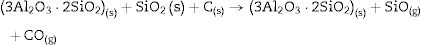
Fig. 2 shows the X-ray diffractograms of the 90/10 CH–AC samples after 2h of sintering at different temperatures. At 1300°C, the diffractogram is similar to that of the as prepared mixture and shown in Fig. 1 where only the peaks related to cristobalite and mullite are present. This fact evidences that no reaction has taken place at 1300°C. Indeed, at this temperature, the cristobalite and the mullite are very stable. After treating at 1400°C, the cristobalite peaks progressively disappear indicating that the silica phase is reduced in accordance with the following reaction

.")
It is reported that he crystalline structure of cristobalite would persist at 1400°C and is completely reduced above 1500°C [13,14], but the advance of the transformation temperature proves that the addition of carbon accelerates the reduction of cristobalite. On the contrary, mullite peaks become fine and intense showing that the mullite particles are as needle-like crystals, typical of the presence of a liquid phase. At 1500°C cristobalite is completely reduced. The intensity of the mullite peaks also decreases significantly and those corresponding to Al2O3 start to develop. This transformation accelerates at the treating temperature of 1600°C, where is observed an important increase of the intensities of alumina peaks indicating that alumina is formed at the expense of mullite in accordance with the following reaction
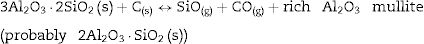

Here, it should be noticed that AC is added in excess and, after the reaction, some C is still found after the thermal treatment, as we will show later in the Raman analysis. The above presented observation suggests that AC reacts with the silica phase in two clearly differentiated steps leading to the removal of SiO2 in the form of SiO(g). During the first step, the AC reduces the residual cristobalite thus producing CO(g) and SiO(g). This reaction is frequently encountered at the silica carbon interfaces [15–17]. Once the residual silica is consumed, the AC will reduce, in the second stage, the silica component of mullite and releases alumina in accordance with the above reaction. This explains the appearance of the alumina peaks at the expense of the mullite ones. It seems that the temperature and the pressure of the gas activate the reduction of the silica by the carbon. In the temperature range of 1300–1600°C the alumina phase is more stable and does not react with AC, a result that is accordance with Ellingham diagrams that show that Al2O3 needs temperatures higher than 1700°C in strong reducing conditions to be reduced.
Fig. 3 shows the diffractograms of the 85/15 CH–AC samples after sintering for 2h at different temperatures. These diffractograms confirm the reactions discussed for the 10% carbon mixture. However, the peaks corresponding to the appearance of the alumina are more intense and begin to appear at lower temperatures than for the 10% carbon mixture. This proves that the addition of AC activates the reduction of both silica and mullite. The latter is justified by the high extinction of the mullite peaks between 1500 and 1600°C. At 1500°C, the high intensity of the peaks of the 85/15 CH–AC samples can be explained by the coalescence of the mullite needles [10,18,19]. These reactions are activated by a large amount of carbon which favours the reaction on the one hand and by the softening of the silica phase which also increases the reaction with the highly reducing CO atmosphere [20].
.")
Since the pressure of CO becomes more important the sintering takes place in a very rich carbon atmosphere. The mullite formed from the CH presents a needle-like microstructure thus increasing the reactivity of CO with solid SiO2 and the decomposition of mullite [13].
Fig. 4 shows the diffractograms of the 15% sintered carbon CH mixture for 10h at different temperatures.
.")
Different authors [17,20–24] have reported the reactions between solid silica and carbon. At low PO2 SiO2 is more sensitive than mullite to the reduction reaction so, at high temperature, the silica can be selectively reduced to gaseous SiO and CO(g). The Ellingham diagram predicts that at PO2 below the stability limit of mullite, Al2O3 began to crystallize in form of corundum [25]. Therefore, according to the obtained results we can write the reactions occurring at the different temperatures as follows.
At 1300°C and 1400°C, the free silica is in form of the stable crystalline cristobalite. No significant reaction can take place:
At high temperature (1600°C) and in the presence of carbon and in a carbon monoxide rich atmosphere, the reactions may be rewritten as:
We must note that as the sintering time and/or temperature increase, the amount of silicon carbide increases where all the thermodynamic conditions concur. Moreover, in all the reactions, some C(s) are still present after the thermal treatment takes place.
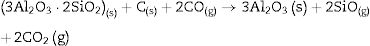
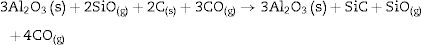
At 1600°C, and after the dissolution of all the SiO2 component, the general reaction becomes:
and since CO2 is not stable at these temperatures, thenresulting in the total reaction as follows [26]:


This general reaction does not exclude the partial reactions leading to the formation of CO(g) or SiO(g) as it has been previously reported by some other authors [27]. In fact, the reaction becomes thermally activated so as to form the silicon carbide.
3.2Raman analysisFig. 5 shows the Raman spectra of the AC and CH used in this study. The AC presents the characteristic carbon peaks located at 1343 and 1589cm−1, being the first one assigned to the disorder in the graphitic lattice (D or defect band) while, the second one is assigned to the vibration of carbon atoms against each other's in the layer planes (G or graphitic band) [28,29]. Close to 2700cm−1 it appears a low intensity and broad band attributed to the first overtone of the D band (called 2D band). The Raman spectrum of CH also presents two bands close to 700 and 1050cm−1 which can be assigned to non-well crystallized mullite and cristobalite, respectively. The position of these bands depend on the thermal treatment applied to the samples [30].

Figs. 6–8 show the Raman spectra of the different CH–AC proportions after being treated between 1300 and 1600°C. In all the cases, the main bands appearing between 1300 and 3300cm−1 correspond to AC, although some broad and low intensity bands appearing below 1100cm−1 can be assigned to CH or other compounds formed during the thermal treatment. These later bands are especially distinguished in the samples containing 15% of AC suggesting that the reaction between CH and AC increases with AC concentration in the samples.


Fig. 6 shows the Raman spectra for the 90/10 CH–AC samples heat treated for 2h at different temperatures. It can only be observed the peaks corresponding to AC located at 1343 and 1589 and 2700cm−1 assigned to the D, G and 2D carbon bands, respectively. In this Fig. 6, bands of mullite, cristobalite or alumina are barely observed indicating that the remaining AC overlaps those materials.
Fig. 7 shows the Raman spectra for the 85/15 CH–AC samples heat treated for 2h between 1300 and 1600°C. In this case, all spectra show several bands located at 1347, 1590 and 2700cm−1 and corresponding to the AC and two new bands at 792 and 1090cm−1 which can be assigned to SiC [31] and SiO2 glass [32] may be also observed. In these spectra, there are a couple of features that must be taken into account, being one the absence of the 200–600cm−1 band due to pure silica glass and, the other is the broad band occurring around 1100cm−1 and typical of multicomponent silica glasses. These characteristics indicate that in the CH–AC treated samples the silica phase contains different elements other than Si, i.e. a silicoaluminate based glass [33]. This silicoaluminate glass can be formed from the impurities of kaolin as it was reported through its chemical composition. Moreover, it is observed that a new band at 792cm−1, which may be assigned to the 6H–SiC polytype [34] only appears in the sample heated at 1600°C. As it has been discussed by means of the XRD analysis shown in Fig. 3, this result confirms the reaction of AC with silica to form SiC.
Finally, Fig. 8 shows the Raman spectra corresponding to the 85/15 CH–AC samples treated for 10h at different temperatures. These spectra are very similar to those of Fig. 7 as correspond to samples with similar compositions and similar treating temperatures, however when the treating time is 10h the peak of vitreous based silica at 1100cm−1 presents low intensity while the one of SiC is of high intensity and begins to be visible at 1400°C. These results indicate that when the treating time is the higher, the reaction of CO(g) with SiO2(s) also increases. It must be taken into account that the presence of both AC(s) and CO(g) could lead to the formation of SiC(s) through a solid–liquid–vapour process, as it will be discussed below.
The above Raman spectra for all the AC–CH treated samples allow the analysis occurring with the AC during the reactions. This can be followed by analysing the D and G peaks of the Raman spectra. It is well-known that carbon nanodomain size (La) can be determined from the intensities or integrated areas of the D and G carbon bands. Tuinstra and Koenig [35] proposed that the ratio ID/IG is inversely proportional to the in-plane graphite crystallite size, La (in nm), such as:
where C1=4.4 for a laser excitation of 515.5nm.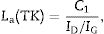
However, several authors showed that although this equation is valid for graphite it is not for amorphous carbon [36–38]. In such case, Ferrari and Robertson proposed a new equation for La of amorphous carbon [38]:
where C2=0.055 for a laser excitation of 514nm.
For activated carbon fibres, Roh (Rh) found a correlation for La when is determined from both XRD and micro-Raman spectroscopy techniques [39]. The equation is
where C3=2 for a laser excitation of 514nm and a laser spot of 2μm of diameter. It can be observed that the Roh equation is similar to that TK but with a lower value of the constant C.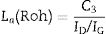
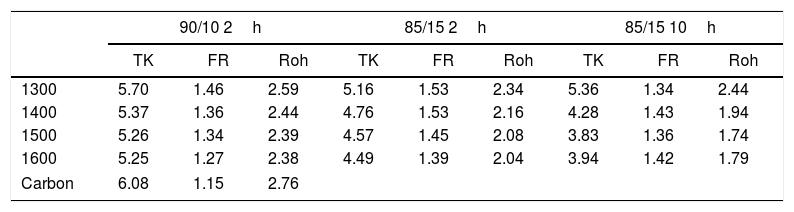
The D and G Raman bands of the above spectra were deconvoluted assuming Lorentzian-shaped bands. From these deconvolutions the positions, intensities, full width at half maximum (FWHM) and integrated areas were obtained. Table 1 gives the corresponding results for all the studied samples, and Table 2 gives the corresponding La values calculated for the three equations. In both Tables they are included the results corresponding to the AC used before preparing the samples.
Parameters of the D and G bands of the studied samples.
| 90/10 2h | 85/15 2h | 85/15 10h | ||||||||||
|---|---|---|---|---|---|---|---|---|---|---|---|---|
| D | G | D | G | D | G | |||||||
| Position | FWHM | Position | FWHM | Position | FWHM | Position | FWHM | Position | FWHM | Position | FWHM | |
| 1300 | 1345 | 96.85 | 1589 | 69.52 | 1344 | 89.25 | 1596 | 67.53 | 1346 | 85.10 | 1592 | 71.16 |
| 1400 | 1346 | 88.92 | 1594 | 69.22 | 1348 | 89.25 | 1596 | 66.38 | 1348 | 77.61 | 1594 | 71.14 |
| 1500 | 1350 | 79.23 | 1591 | 64.55 | 1344 | 82.91 | 1586 | 66.38 | 1342 | 65.27 | 1590 | 67.53 |
| 1600 | 1351 | 79.22 | 1589 | 65.14 | 1342 | 82.91 | 1588 | 66.38 | 1340 | 64.37 | 1584 | 67.50 |
| Carbon | 1341 | 126.29 | 1598 | 58.09 | ||||||||
Carbon nanodomain sizes (La) in nm calculated from different equations.
| 90/10 2h | 85/15 2h | 85/15 10h | |||||||
|---|---|---|---|---|---|---|---|---|---|
| TK | FR | Roh | TK | FR | Roh | TK | FR | Roh | |
| 1300 | 5.70 | 1.46 | 2.59 | 5.16 | 1.53 | 2.34 | 5.36 | 1.34 | 2.44 |
| 1400 | 5.37 | 1.36 | 2.44 | 4.76 | 1.53 | 2.16 | 4.28 | 1.43 | 1.94 |
| 1500 | 5.26 | 1.34 | 2.39 | 4.57 | 1.45 | 2.08 | 3.83 | 1.36 | 1.74 |
| 1600 | 5.25 | 1.27 | 2.38 | 4.49 | 1.39 | 2.04 | 3.94 | 1.42 | 1.79 |
| Carbon | 6.08 | 1.15 | 2.76 | ||||||
Results of Table 1 show that heat treating the samples at high temperature produces significant changes in the D and G bands of AC. In all the cases, the AC that still remains in the samples after the treatment present narrower D bands than the one of AC, but at the same time, a width increase of the G band was observed. This result suggests that the defects present in the AC particles are the first reacting with the chamotte particles, i.e. they are the more reactive sites. From Table 1, it is also noticed that FWHM of the D bands decrease with the treating temperature indicating that the reaction of the AC with the CH keeps going with the temperature. The detected amount of AC in the samples after the treatment induces just slight variations in the widths of the D bands, being the main change observed in the width of the G bands when the treating time increases from 2h to 10h as corresponds with a higher extension of the reaction between AC and CH.
The calculated La values are different depending on the equation used that is why we will comment on their trends rather than their exact values. It is observed that while the TK and Roh equations give La values lower than that of the AC, the calculation using the FR equations throws higher domain sizes. In this context, Schwan et al. [40] demonstrated that the La size varies with both the G width and ID/IG ratio. This author showed that La values of about to 3–5nm, the width of the G band was around 0–70cm−1 and the ID/IG ratios were close to 1. According to our calculations of La values shown in Table 1 and obtained from the TK and Roh equations, the actual size of the carbon domains is very close to 3–5nm. Our interpretation of the observed discrepancies is that probably those obtained from TK equation are a little overestimated while those from the Roh one are a underestimated. Roh proposed his equations for activated carbon fibres where the D and G bands presented widths of 140cm−1 and 65cm−1, respectively [39], and these values are some different from those of Table 1, which might be the reason for the underestimation of thee La values obtained from Roh equation. Results of Table 2 also show that the La values are lower than the one of AC showing that the AC has reacted with the CH particles and the sizes of the nanodomains have decreased after reaction. The La values present a decrease with the both treating temperature and time and corresponding to a higher extension of the reaction of AC with the CH particles.
3.3SEM microstructural analysisFig. 9 shows the fracture surface FEM photographs of the 90/10 CH–AC samples heat treated at different temperatures. In these images, it is possible to distinguish three differentiated zones, being one characterized by clear particles of different sizes, the other corresponding to the glassy matrix which covers and joins the particles and the third feature is the presence of several pores widespread all over the sample. As the temperature increases, the glass matrix becomes more predominant while the particles and pores progressively disappear in size although these later ones increase their mean diameter. Fig. 9a shows the presence of coarse particles which must correspond to the mullite initially present in the chamotte and that has not yet reacted. The matrix must correspond to the part which was rich in cristobalite and other impurities and both have reacted with the carbon. At 1300°C, the pores remain fine and random because the silica-carbon reaction is little activated. By increasing the temperature (Fig. 9b–d) the CH–AC reaction takes place and the mullite phase of the CH tends to disappear while the glassy matrix phase cover most part of the particles in the material.

The morphologies of the sample CH–AC 85–15 treated during 2h at different temperatures are shown in Fig. 10a–d. Due to the high quantity of AC respect to the CH–AC 90/10 samples, the formation of the glassy phase decreases as a consequence of a less concentration of chamotte and therefore less concentration of impurities forming such phase. This phase can be only observed in the sample heat treated at 1600°C (Fig. 10d). It is also observed that at this high temperature glassy phase is not continuous because of its low concentration and pores of high diameter separate the glassy zones. At temperatures comprised between 1300 and 1500°C, irregular and spheroidal particles of different sizes start to develop indicating impurities lead to the softening of the matrix prior to the formation of the glassy phase. Pores with different sizes are also present is all the samples.

Fig. 11 shows the morphologies of the sample CH–AC 85–15 heat treated at different temperatures for a period of 10h. In this case, it is noticed that despite the similar amount of AC in these samples and those presented in Fig. 10, increasing the heating time favours the formation of the glassy phase. This effect is more evident when comparing the pictures of the sample heat treated at 1500°C for 2 and 10h (Fig. 10c and Fig. 11c). At 1300 and 1400°C it can be also observed the presence of spherical particles as a previous step to form the glassy phase. The largest presence of pores is observed at 1500°C while at 1600°C such pores increase in size, as occurred for the samples of 10 and 15% of AC at low treating times (Figs 9 and 10) but not in number. At high AC concentration and high treating temperatures, the appearance of mullite needles is also observed (Fig. 12). These microstructures are shown with a better profusion in the samples heat treated for longer periods of time and at high temperature. This study confirms that needle-like crystals are the stable form of mullite in presence of liquid. In summary, the observation of different size grains at low temperatures and needle-like crystals at high temperatures indicates the presence of bimodal size distribution where primary mullite is present as coarse grains due to the kaolin calcination and, the formation of needle-like mullite crystals appear when the presence of a liquid phase is formed at high temperature.


As a natural material, chamotte presents some other minor constituents which may affect the crystallization kinetics of the SiC. The presence of these impurities leads to the formation of a liquid phase which is surrounded with solid AC particles and a gas phase, a result that could indicate that the formation of SiC takes place by the well-known solid-liquid-vapour process as shown in Fig. 12. The values of the activation energy of crystallization, E, and the crystallization mechanism are usually characterized by n and m values which can calculated by using different kinetic equations. In a previous work, we concluded that the glass transition temperatures and activation energies for the rate controlling relaxation processes are independent of the minor constituents [41]. In our studies, we appreciated that minor constituents favour the crystallization of the glass at lower temperatures increasing both the viscosity of the glass and the activation energy for crystallization. Such minor constituents also modify the n and m values corresponding to the glass crystallization mechanism. In future, we will study the effect of these minor constituents in the crystallization mechanism, either both surface or bulk crystallization. We consider that point worth to be studied. The effect of the minor constituents in chamotte in the crystallization mechanism and dissolution process of the mullite must be the scope of future works.
4ConclusionsThe reaction between a chamotte material prepared from calcined kaolin and 10 or 15% of active carbon has been studied. Chamotte is mainly formed by mullite and cristobalite and it is observed that after treating at 1400°C cristobalite disappears and remains due to its reduction reaction with CO(g). This result proves that the addition of the active carbon accelerates the elimination of cristobalite. On the other hand, mullite tends towards its stable state of equilibrium and its form becomes increasingly coarse. At 1600°C, there is observed an important increase of crystalline alumina at the expense of mullite even for the reactions carried out with 10% of active carbon. This proves that the addition of active carbon activates the reduction of cristobalite and mullite as well. For 10h of treating time, corundum appears as the main crystalline phase. As the sintering time and/or temperature increase, the amount of silicon carbide increases while not all the active carbon is consumed in the reactions. The graphite nanodomain size of the active carbon is close to 6nm and it decreases to values of 5nm for samples reacted at 1300°C and to values close to 4nm for samples reacted at 1600°C. Both the temperature and time lead to a reduction of the graphite nanodomain size. Through increasing the temperature and, because of the presence of impurities in kaolin, it is produced the formation of a glassy matrix phase and where solid particles and pores are also observed. As the reaction temperature evolves, the presence of liquid phase, mullite evolution is from coarse grains to needle-like grains which are better observed as the amount of glassy phase increases. The reaction of mullite in a reduction process in the presence of a liquid phase follows a similar patron respect to the microstructural evolution, from coarse/equiaxial grains to very y long needle-like crystals. This glassy phase is lesser observed in the samples containing 15% of active carbon than in those with 10% carbon. At the reduction conditions and temperatures studied, the active carbon reduces the mullite phase in different steps, and alumina is obtained when all silica is reduced.

