


In this study, porous carbon has been prepared through potassium hydroxide (KOH) activation of coconut fiber (CF) and subsequent carbonization in the presence of an inert gas. The activated carbons (AC) were prepared via carbonization of the precursor at different temperatures. Subsequently, their electromagnetic wave absorption (EMWA) performance was investigated at X-band frequency. The phase crystallinity, porous features, and degree of graphitization of the activated carbons were studied using XRD, nitrogen adsorption/desorption isotherm, and Raman spectroscopy, respectively. Using the BET method, the activated carbon prepared at 750°C displayed a high specific surface area of 602.9m2g−1 and an average pore size of 6nm, which confirms the extant of mesopores. The EMWA was studied using COMSOL Multiphysics software based on the finite element method. Results show that the activated carbon prepared at 750°C attained an optimal reflection loss of −45.6dB at 10.96GHz with a corresponding effective bandwidth of 3.5GHz at a thickness of 3.0mm. In conclusion, this study interestingly shows that porous carbon obtained from coconut fiber has great potential for attenuating electromagnetic waves.
En este estudio, el carbono poroso se ha preparado mediante la activación con hidróxido de potasio (KOH) de la fibra de coco (CF) y la posterior carbonización en presencia de un gas inerte. Los carbones activados (AC) se prepararon mediante carbonización del precursor a diferentes temperaturas. Posteriormente, se investigó su rendimiento de absorción de ondas electromagnéticas (EMWA) en la frecuencia de banda X. La cristalinidad de fase, las características porosas y el grado de grafitización de los carbones activados se estudiaron utilizando XRD, isoterma de adsorción/desorción de nitrógeno y espectroscopia Raman, respectivamente. Empleando el método BET, el carbón activado preparado a 750°C mostró una alta superficie específica de 602,9m2g−1 y un tamaño de poro medio de 6nm, lo que confirma la existencia de mesoporos. La EMWA se estudió utilizando el software COMSOL Multiphysics basado en el método de elementos finitos. Los resultados muestran que el carbón activado preparado a 750°C alcanzó una pérdida de reflexión óptima de −45,6dB a 10,96GHz con un ancho de banda efectivo correspondiente de 3,5GHz con un grosor de 3,0mm. En conclusión, este estudio muestra de manera interesante que el carbono poroso obtenido de la fibra de coco tiene un gran potencial para atenuar las ondas electromagnéticas.
Researchers have shown considerable attention toward the development of efficient microwave absorbing materials (MAMs) due to the increasing electromagnetic (EM) wave applications in electronic equipment and digital systems [1,2]. The excessive usage of electronics has made EM radiation and interference the main source of EM pollution. Therefore, a low cost and lightweight functional absorber that can successfully attenuate EM is highly required [3]. Magnetic materials and its oxides such as Co3O4[4], Fe3O4[5], Ni0.5Cu0.5Fe2O4[6] and Ni(OH)2[7] have shown remarkable microwave absorption performance (MAP). However, certain drawbacks such as poor chemical stability and complex synthesis method limit their potential application as low-cost absorbers. Recent studies have shown that carbons obtained from agro-wastes are good candidates for microwave absorption due to their lightweight, favorable physiochemical stability, low cost, abundance, and tunable dielectric loss [8–10]. The use of carbon nanotubes (CNTs), graphene, and carbon fibers [11,12] has brought a great development to the fabrication of effective microwave absorbers due to their distinct electrical conductivity and super nanostructures [13,14]. However, the limitations of these absorbents include expensive precursors and rigorous synthesis methods that often involve the use of enormous energy and time-consuming approach [15,16]. Activated carbon (AC) from agro-waste are characterized with large surface area, good conductivity, and nano-porosity which makes them being widely used for several applications such as supercapacitors [17,18], lithium batteries [19–21], environmental protection [22,23], and EM wave absorption [24]. Thus, the use of agro-waste for the fabrication of MAMs has opened a new route toward the development of a sustainable environment and effective waste management strategy [25].
In this regard, some researchers have reported the preparation of MAMs from various agro-wastes. For instance, Wu et al. [26] successfully produced a hierarchically porous carbon (HPC) from spinach stems at different carbonization temperatures. The HPC produced at 600°C displayed a high surface area of 345.3m2g−1 and exhibited an optimum reflection loss (RL) of −62dB at a thickness of 2.50mm with corresponding effective absorption bandwidth (EAB) of 7.3GHz. Qui et al. [27] also fabricated porous AC using walnut shells and KOH as an activating agent. The resulting porous carbon prepared at 600°C shows a surface area of 746.2m2g−1 and a good porous architecture compared to the non-activated carbon at 600°C with surface area 435m2g−1. A minimum RL value of −42.4dB was attained with 2.0mm thickness sample. The favorable porosity and increased dielectric properties were reported to promote microwave absorption performance. In addition, Zhao et al. [28] prepared an AC using wheat flour as a starting material. An increase in the activation temperature greatly influences the surface area (1486.8m2g−1). A −51dB minimum RL was reached at 1.8mm with an ultralow filler content of 8% and EAB of 6GHz. To achieve excellent MAP, the properties of carbon materials are tuned to support good impedance matching and successful attenuation of EM wave [8]. A change in the activation temperature, choice of activating agent, and impregnation ratio can regulate the dielectric properties of the AC [29]. In general, AC can be fabricated by physical or chemical activation method [30]. The former approach involves initial heating of precursors in a furnace at high temperature followed by activation of the carbonized material with steam (H2O) or carbon dioxide (CO2). Whereas in the latter method, the starting materials are impregnated with an activating agent (such as H2SO4, NaOH, ZnCl2, K2CO3, H3PO4, and KOH) followed by heating at high temperature in an inert environment. Substantially, studies have shown that AC produced via chemical activation often possess a relatively higher specific surface area and more micro-scale pores than those produced by physical activation [31–35]. KOH has been widely used in the preparation of AC due to the well-developed pores and large surface area of obtained samples [31,34,35]. An increase in carbonization temperature often results in increased carbon content, surface area, pore volume, and pore sizes of the ACs [36]. The carbonization temperature during the preparation of the chemically AC plays a significant role in its EM wave absorption performances. The pores (microscale) enhances multi-reflection and scattering of the EM waves, reduces bulk density, and improves impedance matching [37]. The large specific surface area is also beneficial for the successful attenuation of EM wave thereby enhancing microwave absorption performance [38].
In this work, porous carbon has been prepared using coconut fiber as an agro-waste precursor. The coconut fiber was impregnated by KOH as an activating agent and the slurry was carbonized at different temperatures in an inert atmosphere. COMSOL Multiphysics was employed to study the EM wave absorption of coconut fiber-derived porous activated carbon (CFAC). Results show that the CFAC prepared at 750°C achieved minimum RL peak value of ˗45.6dB at 10.96GHz frequency with a corresponding sample thickness of 3.0mm and EAB of 3.5GHz. The findings adequately affirm porous carbon from agro-waste as potential MAMs at X-band frequency.
ExperimentalPreparation of activated carbonCoconut husks were collected from local markets and the coconut fibers (CF) were extracted from the husk. The CFs were rinsed using deionized (DI) water, sun-dried for 8h, and subsequently dried overnight at 75°C. The sun-dried sample was grounded into powder using a mechanical grinding process. To prepare KOH solution, 20g of KOH pellet were dissolved in 50mL DI water. The ground CF was then impregnated in the KOH solution by adding 20g of CF powder in 50mL KOH solution and continuously stirred for 6h at a temperature of 65°C. The slurry was allowed to age for 6h and dried overnight in an oven at a temperature of 80°C. 20g of pretreated CF samples were then carbonized in a tube furnace at 550°C, 650°C, and 750°C for 2h at 5°Cmin−1 under N2 atmosphere. The samples were labeled CFAC@550, CFAC@650, and CFAC@750, respectively. The resulting samples were purified several times with 0.1M HCl and deionized water until a pH of 7 is attained. The washed AC samples were subsequently oven dried for 8h at 100°C, left to cool to room temperature, and finally transferred into a closed sample holder to prevent pore blockage that could arise from atmospheric gasses adsorption.
CharacterizationThe phase crystallinities were characterized using an X-ray diffraction spectrometer (Cu Kα radiation source, 40.0mA, λ=0.15406nm, 45kV). To study the kind of carbon in the samples, Raman spectra were also studied using the Renishaw Invia Raman spectrometer (λ=514nm). Carbon, Hydrogen, Nitrogen, Sulphur, and Oxygen (CHNSO) Elemental Analyzer was used to study the Elemental composition. Micrometrics ASAP 2020 was used to study the Brunauer Emmett and Teller (BET) surface and pore analysis. The BET technique uses the adsorption/desorption of N2 gas on the surface of the samples to determine their surface area and pore characteristics. Mercury porosimetry was further used to analyze the pore size and the pore volume of the samples. A four-point-probe technique was used to determine the electrical conductivity of the CFAC Samples. 50wt% of the CFAC samples were homogenously mixed in paraffin wax solution for EM measurement. The EM properties were measured at X-band frequency with Keysight (E5071C) vector network analyzer using the rectangular waveguide method. The measured properties were used in COMSOL Multiphysics for study of the microwave absorption properties at X-band frequency.
Finite element method (FEM)The scattering parameters of the CFAC samples filled in rectangular waveguide were simulated with COMSOL Multiphysics software based on FEM. The WR 90 rectangular waveguide was modeled in three-dimension geometry with schematic illustrated in Fig. 1.

In geometry modeling, the waveguide was partitioned into three domains. The first and third domains were air-filled. The second region was filled with measured material properties. The rectangular waveguide boundaries were treated as perfect electric conductor (PEC), aside two boundaries of wave excitation denoted as port 1 and port 2. Then, a mesh consisting of triangles is created with the number of triangles increasing with the density of the material properties as can be seen in Fig. 1. Next, port boundary of the RF module was employed for wave excitation and the transverse electric TE10 mode was made to propagate through the WR 90 waveguide.
Based on Maxwell's equation, the wave equation for electric field “E” propagating through the waveguide is as given in Eq. (1):
where ɛr is the relative complex permittivity, σ is the conductivity, ω is the angular velocity; 2πf (f=frequency), μr is the relative complex permeability, ɛo is free space permittivity and k is the wave vector. Following FEM modulation, the electric field in the simulated waveguide is discretized via tetrahedron meshes [16,17]. Thus, the EM field within individual elements is interpolated from each node value with the first-order polynomial given below in Eq. (2):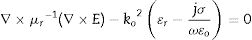

The equation for the electric field (Ee) in the rectangular waveguide based on FEM is given in Eq. (3) as follows:
where Nie=1,2,3⋯6 are the complex parameters of the electric field E-Field which correlates with the elements six edges. The Eie(x,y,z) is a vector function that relates to the ith point of an element. The integral over one element volume by applying boundary conditions is given in (4):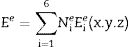
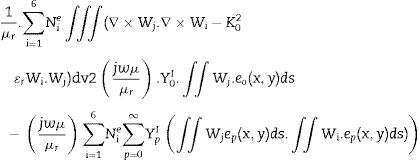
Simplification of Eq. (4) gives the matrix equation as written below in Eq. (5):
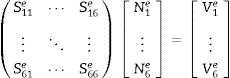
The elements of the above matrices are expressed below in Eqs. (6) and (7).
where V is derived via boundary conditions. The element matrices are amassed over all tetrahedron elements of the segment filled with CFAC sample to obtain the final matrix equation as shown in Eq. (8):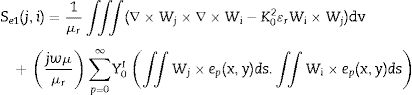
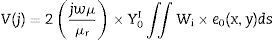

At this point, the software uses the solution obtained from Eq. (8) to evaluate the reflection and transmission coefficient of the CFAC samples.
Results and discussionPhase crystallinityThe XRD patterns of all the CFAC samples is as presented in Fig. 2. All samples display two peaks centered at 24.5° and 44.1° and these peaks correspond to the (002) and (100) crystal planes of graphite [9]. This affirms the formation of graphite like structure of amorphous carbon in the CFAC samples.
Raman spectra
To further investigate the type of carbon present in the samples. Fig. 3 shows the Raman spectra obtained for CFAC samples at different temperatures. All samples exhibit two conspicuous peaks located at 1349cm−1 and 1594cm−1 which corresponds to the disordered carbon (D-band) and in plane of sp2 hybridized carbon atom (G-band) band, respectively. The D-bands represent the out of plane sp3 hybridized vibration of carbon atom, whereas the G-band indicates the characteristic in-plane vibration of sp2 hybridized carbon atom [39]. The degree of graphitization (ID/IG) is studied to evaluate the defect ratio and extent of graphitization of the carbonaceous materials [40]. It was observed that the ID/IG increases with increasing temperature. This is due to the improved crystallinity as the temperature increases. The ID/IG ratio of CFAC@550, CFAC@650, and CFAC@750 are evaluated as 0.84, 0.86 and 0.87, respectively. CFAC@750 has higher graphitization degree that indicates that the sample contains more defects which is beneficial for a rapid attenuation of EMW.
Pore size distribution
The porous nature and pore size distribution of the CFAC absorbers are analyzed by measuring the N2 adsorption/desorption isotherm. Fig. 4a–c displays open-ended type II with hysteresis curve within 0.5–1.0 relative pressure range and Fig. 4d displays the plots of mercury porosimetry of the CFAC samples. The low-adsorption at lower relative pressure in all the samples and openings in Fig. 4a and b have been reported to arise from incomplete combustion in the carbonization process resulting in pore reduction [41]. This shows that micropores are predominant within the samples [42]. The adsorption shows that a strong interaction exists between the sample surface and adsorbate. The rapid rise in nitrogen uptake at a low relative pressure (0.0–0.9) indicates micropore adsorption [27]. KOH activation has been known to produce abundant pore networks in CFAC samples. Etching of carbon precursor with KOH through redox reaction leads to formation of copious micro/mesopores based on the following reactions between 400°C and 500°C. The KOH reacts with the carbon precursors to produce H2 and K2CO3 as the product of the reaction as given in Eq. (9):


 N2 adsorption–desorption isotherm curves of CFAC samples and (d) plot of mercury porosimetry of the CFAC samples.")
KOH is completely consumed when the temperature is increased close to 600°C. The K2CO3 produced from Eq. (9), then decompose at temperatures higher than 600°C to produce CO2 and K2O as shown in Eq. (10). The formation of CO2 and H2 through the activation activity also promotes the development and distribution of pores because of the carbon (C) gasification. At a temperature above 700°C, the resulting CO2 is reduced by C to form CO as depicted in Eq. (11). Subsequently, K2CO3 and K2O also reduce by C to produce metallic K as shown in Eqs. (12) and (13). The metallic K forms effective intercalation into the carbon lattice creating an expansion in the carbon lattice [43]. During neutralization, the metallic K is washed away, and then the carbon surface and interior cavity get eroded. This induces an irreversible expansion to the lattice of the AC produced, thereby generating highly developed pores and large surface area [43]. The pores can effectively trap EM waves, resulting in accumulation of charges at the interface causing interfacial polarization which will enhance EM absorption.
Table 1 reveals pore size distribution of the CFAC for nitrogen adsorption and mercury porosimetry analyses. The BET surface area, total pore volume and pore size of the samples shows that the carbonization temperature has an impact on the porous network and surface area of the CFAC samples. The SBET increases with an increase in temperature likewise the pore sizes also increase. Liu et al.[44] reported that the surface area and pore size can influence the scattering parameter in EM absorption. The large surface area of CFAC@750 is expected to have abundant charges which would favor the rapid attenuation of EM wave more than the CFAC@650 and CFAC@550. The high pore size and pore volume in CFAC@750 would also enhances multireflection and scattering of the EM waves which will enhance microwave absorption performance [44–46]. Mercury porosimetry uses air as the wetting fluid and mercury as the nonwetting fluid. Mercury is forced into the pores of the CFAC samples incrementally. The variation between the pore radius of the samples and the cumulative pore volume (mercury porosimetry) is as displayed in Fig. 4d. The relatively high total pore volume (TPVMe) of CFAC@750 indicates the presence of mesopores during heat treatment of the chemically activated samples. The mercury density decreases with increasing temperature, which is consistent with an increase in the development of porosity in the carbons [47]. Like the observation from Nitrogen adsorption analysis, the mercury porosimetry also showed increased pore size with increase in carbonatization temperature for the CFAC samples.
Surface BET, pore volume and pore size of CFAC samples at different temperature.
| Samples | N2 adsorption | Mercury porosimetry | ||||
|---|---|---|---|---|---|---|
| SBET (m2g−1) | TPVN2 (cm3g−1) | Pore size (nm) | TPVMe (mm3g−1) | TPVMe (cm3g−1) | Pore size (nm) | |
| CFAC@550 | 260.25 | 0.056 | 5.3 | 52.98 | 0.053 | 7.27 |
| CFAC@650 | 323.78 | 0.041 | 5.5 | 68.63 | 0.069 | 9.03 |
| CFAC@750 | 602.87 | 0.104 | 6.6 | 84.27 | 0.084 | 12.39 |
TPV: total pore volume; N2: nitrogen; Me: mercury; nm: nanometer; SBET: surface Braunauer Emmert Teller.
The elemental composition of CFAC samples was affected by the carbonization temperature as displayed in Fig. 5. Carbon yield (%) increases with an increase in the pyrolysis temperature whereas, the low nitrogen content and oxygen are due to a decrease in defects [48]. Therefore, at high temperatures, a large number of free conduction electrons are present which in turn drives out heteroatoms from the carbon atoms [49]. The resulting C–C interacts, thereby resulting in improved conductivity which favors the absorption of EM wave [50].
Surface morphology percentage of CFAC.")
The FESEM images presented in Fig. 6 show the surface morphology of the CFAC samples. The surface morphology of CFAC@550 in Fig. 6a–c reveals the presence of poorly developed and sparsely distributed pores with deformed surface and cracked wall. Fig. 6d reveals the estimated pore size and surface area of CFAC@550 measured with FESEM. The poor porosity of CFAC@550 can be ascribed to relatively low activation temperature and pore blockage from impurities [51]. Whereas CFAC@650 reveals the presence numerous well-developed pores as observed in Fig. 6e–h. CFAC@750 shows a well-developed pore size as observed in Fig. 6i–l. The well-developed pores in both CFAC@650 and CFAC@750 can be ascribed to etching of the CFAC samples with KOH and carbonization at relatively high temperature compared to CFAC@550. This indicates that at higher temperature, the porosity of the sample increased. CFAC@650 shows irregular pores randomly distributed on the surface of the sample. Also, the presence of cracks in the carbon matrix of CFAC@650 can be ascribed to thermal stress [52]. Likewise, CFAC@750 also contains small irregular pores randomly distributed on the surface of the sample. The presence of numerous pores in CFAC@650 and CFAC@750 samples will allow multi-reflection and scattering of EM waves within the samples thereby promoting enhanced EM wave absorption.
Electrical conductivity CFAC@550, (e–h) CFAC@650 and (i–l) CFAC@750.")
The intrinsic electrical conductivity (σ) is an essential parameter that can influence the EMWA ability of MAMs. In carbon materials, the nature of electron transport is proportional to the degree of crystallinity [53]. As shown in Fig. 7, the values of electrical conductivity exhibit certain regularity with respect to the carbonization temperature of the CFAC samples. The σ value increases stepwise as the carbonization temperature increases. This indirectly verifies that the crystalline volume fraction has been enlarged through chemical activation of the CFAC before carbonization [54]. For CFAC@750, the σ was measured as 18.23Scm−1, which was superior to the CFAC@650 and CFAC@550. Therefore, the σ values indicates that CFAC samples have good electrical conductivity thereby creating an efficient electrical relaxation route for the incoming EM waves which results in deterioration of the EM waves [55] within the CFAC samples.
Electromagnetic wave absorption properties
Using the simulated reflection coefficients and according to the transmission line theory [56], absorption coefficients generally regarded as RL of the samples were evaluated from Eqs. (14)–(16):
where Zo is the free space impedance, f represents the microwave frequency, ɛr denotes the relative permittivity, μr is the complex permeability, d symbolizes the absorber thickness, c represents the velocity of EM wave propagation in vacuum, Zin indicates absorbers impedance, and Г represents the reflection coefficient. The absorption curves of CFAC samples at absorber thicknesses ranging from 2.0 to 5.5mm at X-band frequency is as shown in Fig. 8. The microwave absorption properties of the samples were enhanced with the increase in carbonization temperature. Fig. 8a (CFAC@550) displayed a minimum RL peak value of −41.8dB at 10.8GHz with a matching thickness of 5.5mm and EAB of 2.5GHz. At 5.0mm matching thickness, the sample achieved an optimal RL value of −53.55dB with a narrow bandwidth of 0.8GHz, which does not meet the requirement of an ideal absorber. CFAC@650 achieved a minimum RL value of −41.6dB at 10.56GHz with a matching thickness of 4.0mm and relatively broad EAB of 4.0GHz (Fig. 8b). For CFAC@750 presented in Fig. 8c, a minimum RL peak value of −45.6dB was obtained at 10.96GHz at a reduced thickness of 3.0mm with EAB of 3.5GHz.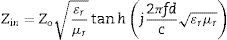

 CFAC@550, (b) CFAC@650, and (c) CFAC@750.")
Table 2 presents the MAP of porous carbon absorber derived from agro-waste reported in the literature. It was observed that the porous carbon reported in this study exhibit good microwave absorbing properties as compared with the literature. The improved absorption of CFAC@650 and CFAC@750 could be ascribed to the increased number of pores and surface areas which improve multiple reflection and attenuation of EMW.
Microwave absorption properties of some porous carbon absorbers derived from biomass in recent years.
| Absorbers | Loading (%) | Frequency(GHz) | Minimum RL (dB) | EAB(GHz) | Thickness(mm) | Ref. |
|---|---|---|---|---|---|---|
| Walnut shell NPC | 30% | 8.2 | −36.9 | 6.3 | 3.5 | [27] |
| Walnut shell NPC | 30% | 8.8 | −42.4 | 1.7 | 2.0 | [9] |
| WPC 600 | 50% | 7.4 | −33.6 | 1.7 | NA | [57] |
| Wheat flour AC | 8% | 15.8 | −43.0 | 4.8 | 2.7 | [28] |
| Spinach stem HPC 600°C | 30% | 7.3 | −62.2 | 7.3 | 2.7 | [26] |
| Spinach leaf HPC 700°C | 50% | 7.3 | −22.6 | 7.8 | 2.5 | [26] |
| Cabbage stem | 50% | NA | −52.8 | 5.1 | 2.4 | |
| Cabbage leaf | 30% | NA | −41.4 | 5.1 | 2.5 | [26] |
| Coconut fiber | 50% | 10.96 | −45.6 | 3.59 | 3.0 | This study |
NA: not available; EAB: effective absorption bandwidth; RL: reflection loss; WPC: walnut porous carbon; NPC: nano porous carbon; AC: activated carbon; HPC: hierarchically porous carbons.
The microwave absorption of the CFAC samples were studied. The precursor was prepared via chemical activation with KOH and carbonized at 550°C, 650°C, and 750°C. The resulting AC showed distinct porosity and large surface area with CFAC@750 having the highest pore size and largest surface area. The MAP was studied with COMSOL Multiphysics based on FEM. The variation in the carbonization temperature was found to regulate the MAP of CFAC absorbers. CFAC carbonized at 750°C showed excellent microwave absorption performance with a minimum RL peak value of −45.6dB at 10.96GHz with a 3.0mm thickness. The good absorption performance of CFAC at elevated temperature can be attributed to good conduction loss and interfacial polarization. The numerous numbers of pores also induce multiple reflections of microwave through high conductivity. Therefore, it is reasonable to conclude that CFAC sample can be a good candidate for effective absorption of EM wave at X band frequency.
Competing interestThe authors declare that they have no known competing financial interests or personal relationships that could have appeared to influence the work reported in this paper.
The authors wish to acknowledge the project funding: YUTP research grant 015LC0-143 and Universiti Teknologi PETRONAS Malaysia for providing financial support through the Graduate Assistant (GA) scheme.

