


The structure, microstructure, thermal and mechanical properties of glasses and glass-ceramics in the LMAS (Li2O, MgO, Al2O3, SiO2) system and the effect of P2O5 and Al2O3 additives have been studied. The transition temperatures of both glasses and glass-ceramics increase with the P2O5 and Al2O3 concentration, but at high temperatures the melt viscosity decreases. The main crystalline phases formed are lithium aluminium silicate, enstatite and β-spodumene, being the growth of β-spodumene favoured by fluorine ions, P2O5 and the heat treatment temperature as well. Raman and FT-IR spectroscopies have shown the formation a silica-rich glass phase which acts as a matrix of the crystallites containing Al2O3 and P2O5 in its composition. The shape and aspect ratio of the crystallites depend on the Al2O3 concentration. For low Al2O3 concentration a variety of tubular, granular and plate-like crystals appear, while for high Al2O3 concentration the main shape of the crystals is spherical or globular. Hv, E and CTE properties are related to the crystalline phases formed during the crystallization treatment, and their variations are in accordance with the increase of the crystal aspect ratio. The CTE values of the GCs decrease as the P2O5 content increases up to 3%, while for the Al2O3 concentration of 16% the minimum CTE value is obtained. Hv and E values of the GCs are higher than those corresponding to their respective parent glasses. According to these values, these glasses and glass-ceramics are not appropriate for machining.
En este trabajo se ha estudiado el efecto del contenido en P2O5 y Al2O3 en vidrios y vitrocerámicos del sistema LMAS (Li2O, MgO, Al2O3, SiO2) en su estructura, microestructura y propiedades térmicas y mecánicas. La adición de estos dos óxidos produce el aumento de las temperaturas de transición tanto de los vidrios como de los vitrocerámicos correspondientes, sin embargo, la viscosidad a alta temperatura decrece. Las fases cristalinas que se forman son fundamentalmente silicato de litio-aluminio, enstatita y β-espodumena, donde el crecimiento de β-espodumena está favorecido por la presencia de iones F, P2O5 así como por la temperatura de tratamiento. Las espectroscopias Raman y FTIR han permitido detectar la formación de una fase vítrea rica en sílice que actúa como matriz de los cristales que contienen Al2O3 y P2O5 en su composición. La microestructura cristalina depende de la concentración de y Al2O3 en los vidrios. Para bajas concentraciones de Al2O3 se originan cristales con formas tubulares o con formas mientras que para altas concentraciones de Al2O3 los cristales tienen forma esférica o globular fundamentalmente. Los valores de HV, E y CTE están relacionados con las fases cristalinas formadas durante el tratamiento de cristalización, y sus variaciones están relacionados con el factor de forma de los cristales. Los valores de CTE de los vitrocerámicos disminuyen a medida que el contenido de P2O5 aumenta hasta un 3%, mientras que para la concentración de Al2O3 del 16% se obtiene el valor mínimo de CTE. Los valores Hv y E de los GC son más altos que los correspondientes a sus respectivos vidrios principales. Estos valores indican que estos materiales, tanto vidrios como vitrocerámicos, no son apropiados para ser mecanizados.
Glass-ceramics (GCs) are polycrystalline solids formed through the controlled crystallization of glasses. Crystallization is accomplished by subjecting appropriate glasses to a carefully regulated heat treatment schedule resulting in the nucleation and growth of crystal phases within the glass [1,2]. GCs are particularly interesting in several applications, such as thermal, chemical and mechanical, since they offer great possibilities for manipulating their properties such as transparency, strength and coefficient of thermal expansion (CTE) by modifying the composition and the heat treatment schedules [3]. Among the different GC, the most successful systems from the commercial point of view are the Li2O–Al2O3–SiO2 (Lithium-aluminosilicate system, LAS), and the MgO–Al2O3–SiO2 (Magnesium-aluminosilicate system, MAS). Over the past three decades, much attention has been paid to the crystal phases and properties of LAS system due to its excellent thermo-physical properties [4] whereas the MAS system is attractive because of its good mechanical properties [4,5]. The major development of this system is hindered due to the high cost and high melting temperature. The addition of MgO to the LAS system, thus forming a Li2O–MgO–Al2O3–SiO2 (LMAS) system, helps to decrease the crystallization temperature and reduces the cost of the batch material but it has been rarely studied [6].
Different nucleating agents are normally employed highlighting TiO2, ZrO2, F and P2O5 as the most frequently used to increase the crystalline phases in GC systems. The mixture of the nucleating agents TiO2, ZrO2 and F exerts a synergistic effect on the crystallization mechanism of spodumene-willemite-diopside glasses [7]. It is also known that additions of P2O5 to certain silicate glass compositions promote volume nucleation and GC formation and markedly increases the crystal nucleation rate [8]. Bao et al. [9] have reported that the addition of B2O3 or P2O5 could promote the phase separation of glass, increase the size of the spherical phase separation droplet and decrease the crystallization temperature. Furthermore, the presence of fluorine in the parent glass enhances phase separation, reduces the crystallization temperature, refines the microstructure and improves the physical and mechanical properties of the GCs [10]. The fluorine content variation has a significant influence on the crystallization kinetics as well as the crystal morphology [10]. In addition to that, small amounts of Al2O3 will reduce the immiscibility in alkali silicate systems [11].
According to Bao et al. [9] the main crystalline phase in a LMAS glass-ceramic prepared by the solid state method are β-quartz solid solution (Li2Al2Si3O10), lithium silicate (Li2SiO3) and forsterite (M2P-16ASiO4). Li et al. [12] also reported that the addition of MgO facilitates the phase transformation from β-quartz to β-spodumene in the LAS system. However, despite the wide use of MgO, its role on the crystallization reactions of LAS is not well understood. Zhang et al. [13] reported that with the increase of MgO content in Li2O–ZnO–Al2O3–SiO2 glass-ceramics, the glass transition temperature is barely modified whereas the crystallization temperature decreases in a great extent, a fact which may be related with the effect of M2P-16A+ ion on the glass structure. According to Shi et Hou [14], the increase of MgO content in CaO–MgO–Al2O3–SiO2 (CMAS) glass-ceramics made the vibration frequency of infrared spectrum shift to the low frequency which increases the average length of SiOSi bonds and causes the transformation of the crystal phase from wollastonite to pyroxene.
The presence of the different crystalline phases in LAS and LMAS GC systems causes a wide variation in the thermal and mechanical properties of the obtained materials [15]. In this sense, GC with coefficient of thermal expansion (CTE) from negative to positive values (−3.78 to 18.3×10⁻⁶°C−1) can be obtained [16,17]. Moreover, LMAS GC materials can present microhardness values ranging from 4.8GPa to 8.5GPa [18]) and elastic modulus (E) between 75 and 100GPa [19].
Although these materials are reported since long, scarce studies have been carried to discern the structure of these GC materials and the effect of the different crystalline phases. Previously [2] we have studied the effect of P2O5 and Al2O3 on the crystallization of LMAS GC materials and we have obtained the corresponding kinetic parameters. It was reported that increased amounts of P2O5 or high Al2O3 concentrations improve the glass stability and increase the crystallization temperature. In the present work we study the sintering and crystallization processes of LMAS GC containing TiO2, ZrO2, F and P2O5 by means of X-ray diffraction (XRD), Raman and Infrared spectroscopies (FTIR) and their correlations with the microstructure, thermal and mechanical properties. We will compare the behavior of a glass containing a high Al2O3 content with the remainder glasses containing the nucleating agents.
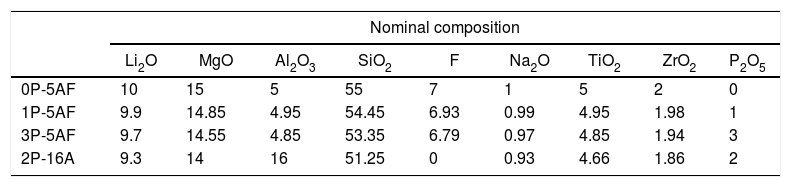
ExperimentalPreparation of glasses and glass ceramicsThe glasses used in this study were prepared as described in a previous work [2]. Four glass batches (80g) with SiO2, Al2O3, MgCO3 (98.5%), Li2CO3, cryolite (Na3AlF6), TiO2, Na2CO3, ZrSiO4 and P2O5 as raw materials were prepared. The function of fluorine and P2O5 is to serve as nucleation agents. The amount of fluorine was maintained practically constant whereas P2O5 was added in increased concentrations of 0, 1.0, 2.0 and 3.0mol%. Additionally, in order to study the effect of the Al2O3, another glass composition now containing 16mol% of Al2O3 and without F was also prepared. The nominal composition of the prepared glasses is given in Table 1. The chemical composition, as analyzed by elemental analysis was also given in the above mentioned work and we have also included here just for comparison purposes [2]. All the elements except Li were determined by XRF (XRF, Philips, Magic Pro, USA). Li content was determined by ICP-EOS. In the case of fluorine determination, a special curve for the quantitative analysis of F was also used.
Nominal and chemical compositions (as determined by XRF) of the prepared glasses. All the compositions are given in mol%.
| Nominal composition | |||||||||
|---|---|---|---|---|---|---|---|---|---|
| Li2O | MgO | Al2O3 | SiO2 | F | Na2O | TiO2 | ZrO2 | P2O5 | |
| 0P-5AF | 10 | 15 | 5 | 55 | 7 | 1 | 5 | 2 | 0 |
| 1P-5AF | 9.9 | 14.85 | 4.95 | 54.45 | 6.93 | 0.99 | 4.95 | 1.98 | 1 |
| 3P-5AF | 9.7 | 14.55 | 4.85 | 53.35 | 6.79 | 0.97 | 4.85 | 1.94 | 3 |
| 2P-16A | 9.3 | 14 | 16 | 51.25 | 0 | 0.93 | 4.66 | 1.86 | 2 |
| Chemical composition | ||||||||||
|---|---|---|---|---|---|---|---|---|---|---|
| Li2O | MgO | Al2O3 | SiO2 | CaO | Na2O | TiO2 | ZrO2 | P2O5 | F | |
| 0P-5AF | 10.95 | 15.16 | 5.32 | 58.21 | 0.34 | 1.51 | 5.40 | 2.20 | 0.00 | 0.86 |
| 1P-5AF | 11.28 | 15.00 | 5.31 | 57.41 | 0.33 | 1.82 | 5.37 | 2.13 | 0.81 | 0.46 |
| 3P-5AF | 11.91 | 14.71 | 5.20 | 55.42 | 0.34 | 1.52 | 5.15 | 2.07 | 3.12 | 0.51 |
| 2P-16A | 9.28 | 13.40 | 16.32 | 50.56 | 0.30 | 1.39 | 4.79 | 1.98 | 1.87 | 0 |
Different batches of glass samples were well mixed and calcined in a platinum crucible at 900°C for 2h, then melted at 1600°C and held from 2 to 3h (air atmosphere) in an electric furnace. The melt was poured onto a preheated metal plate and allowed to cool down at ambient temperature. To ensure homogeneity, the poured glasses were ground and re-melted at the same conditions for two additional hours and immediately annealed at 575°C (near to transition temperature), for 4h. The glasses were then slowly cooled inside the furnace with the aim to eliminate thermal residual stresses.
For obtaining GC materials, the annealed glass blocks were cut into pieces of about 2mm thickness with a cutting machine (Buehler-Beta Grinder/Polisher) and then they were polished gradually using silicon carbide abrasive paper and finally with a 3μ diamond disk. The samples were cleaned with rinsed water and ultrasonic cleaning. The samples were heat treated at 650, 700, 750, 800 and 840°C for 1h to obtain the GC materials whose corresponding main crystallization peak determined by Differential Thermal Analysis (DTA) [2].
CharacterizationGlass transition temperatures (Tg: 1012.3 Pa.s), dilatometric softening temperature (TDS) and the thermal expansion coefficients (CTE) for both glasses and glass ceramics were measured in a dilatometer (Bahr Thermo Analyze DIL 801L, Hüllhorst, Germany) in dry air at a heating rate of 5°C/min in the range of 25–1000°C. For CTE determinations, sample pieces of 5mm×5mm×10mm were used with Al2O3 as reference material. The characteristic temperatures were determined by using a Hot Stage Microscopy instrument (HSM, EM201 Leica) equipped with a CCD camera. The temperatures corresponding to the characteristic viscosity points (TIS: initial shrinkage – 109Pas; TES: end of shrinkage – 107.2Pas; TD: Deformation-softening – 105.1Pas; TS: sphere – 104.4Pas; THS: half sphere – 103.6Pas and TF: flow – 103.1Pas) were obtained from the photographs taken during the HSM experiment and following Scholze's definition [1].
The crystalline phases developed in heat treated samples were determined by X-ray diffraction (XRD, Brucker D8-Advance, Germany) using Cu Kα radiation (λ=0.154059nm) with 2θ range of 10–70°, a scanning rate of 2°min−1 and a 2θ interval of 0.01°. The developed phases were identified by JCPDS numbers (ICDD-PDF database).
The infrared spectra were obtained by using a Fourier-Transform Infrared Spectrophotometer (FT-IR, Perkin-Elmer Spectrum X) in the range 4000–400cm−1 and a resolution of 2cm−1. Sample powders were mixed with KBr and pressed to get a transparent pellet. 16 scans were used to obtain a sample spectrum and background was subtracted every time. Raman spectra were measured in a Renishaw (In-Via, UK) spectrometer with a laser source of 514nm. Raman spectra were recorded in the 1500–200cm−1 range and at least 10 scans were used for each spectrum.
The microstructure of the crystalline phases developed after heat treatment was examined by Field Emission Scanning Electron Microscopy (FE-SEM, Hitachi 4700-S) operating at 20kV. Fractured surfaces were etched, with HF solution (3%) for 15s in order to eliminate the glass phase and after drying they were gold coated.
The Vickers hardness, Hv, was measured using a nano-indentation instrument (UMT-2, Bruker, Germany). Polished surfaces of the glass and glass-ceramic samples were indented with a load (P) of 500mN for 15s. In all cases at least 10 indentations were made in order to get an error of ±0.2GPa. The equations used for Hv determination was
where d is the mean of the diagonal lengths of the indentation finger in mm. From the Hv (Eq. (1)) the value the machinability parameter m and the cutting energy μ1 were calculated according to [20]:


Elastic modulus was obtained from the unloading curve of the indentation displacement using the Oliver–Pharr method [21].
Results and discussionChemical compositionThe nominal and chemical composition of the different glasses is given in Table 1. All of them did not presented any crystalline peaks in the XRD (as it will be shown later) indicating a vitreous structure. The chemical composition of these glasses can be also found in a previous work published by our group [2]. It was observed that the amount of fluorine incorporated into the glass structure is significantly lower than the nominal values and this amount is even lower at the highest amounts of the other nucleating agent, P2O5.
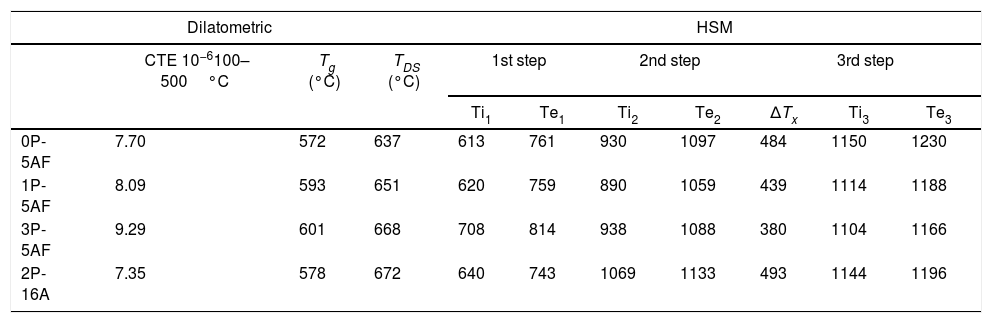
Thermal characterization of glasses: dilatometry and HSMFig. 1a shows the thermal expansion curves for the prepared glasses. In the low-temperature region, between 100 and 500°C, all the curves show a linear behaviour from where the CTE has been calculated. Above 500°C, it is observed a change in the slope of the curves part until they reached the maximum dL/L0 which corresponds to the dilatometric softening point (TDS). The Tg value is calculated from the intersection of the two linear parts with different slopes. The calculated Tg, TDS and CTE values in the different glasses are collected in Table 2. In general, by maintaining the Al2O3 concentration constant, the addition of P2O5 to the glass composition leads to an increase in both Tg and TDS temperatures and an increase in the CTE. However, when Al2O3 amount is increased, the opposite behaviour was observed, with an increase in the two characteristic temperatures and a decrease in CTE. In phosphate-bearing glasses, it is expected that a decrease of the polymerization degree of the glassy phase would produce a decrease in the Tg value and an increase of the CTE [22]. The observed increase in of both the Tg and CTE with the phosphate content has been already observed by some other authors in devitrified glasses and attributed this behaviour to a phase separation and the obtaining of a composite CTE [23]. In the absence of a phase separation, the most plausible explanation for the observed behaviour is the decrease of the bond strength further enhanced by the formation of CaF+ structural units that provide a minor crosslinking degree in the glass network [23,24].
 Dilatometric curves and (b) HSM curves for the prepared glasses.")
Characteristic temperatures and CTE for the as-prepared glasses. ΔTx=Ti1−Te2.
| Dilatometric | HSM | |||||||||
|---|---|---|---|---|---|---|---|---|---|---|
| CTE 10−6100–500°C | Tg (°C) | TDS (°C) | 1st step | 2nd step | 3rd step | |||||
| Ti1 | Te1 | Ti2 | Te2 | ΔTx | Ti3 | Te3 | ||||
| 0P-5AF | 7.70 | 572 | 637 | 613 | 761 | 930 | 1097 | 484 | 1150 | 1230 |
| 1P-5AF | 8.09 | 593 | 651 | 620 | 759 | 890 | 1059 | 439 | 1114 | 1188 |
| 3P-5AF | 9.29 | 601 | 668 | 708 | 814 | 938 | 1088 | 380 | 1104 | 1166 |
| 2P-16A | 7.35 | 578 | 672 | 640 | 743 | 1069 | 1133 | 493 | 1144 | 1196 |
Fig. 1b presents the corresponding HSM curves for the prepared glasses. As it can be observed, several steps are revealed which correspond to the different thermal stages occurring during sample heating. The optical images of HSM (not shown here) allow determining the temperatures at where the different events take place. Table 2 collects the characteristic temperatures determined from the HSM curves. From HSM, we could determine that the start of the shrinkage corresponds to the beginning of the first step while its end corresponds to the end of the second step. The third step corresponds to softening and flowing processes. The presence of two steps during shrinkage is an indication of crystallization processes during heating. The presence of the crystalline phases was already observed in another work [2] and their occurrence reduces or avoids the shrinkage process until they are formed. The two shrinkage steps take place at the temperature range comprised between 600°C and 1100°C, whereas the DTA peaks only appear between 700°C and 850°C, i.e. after the first step of the HSM curves. We can observe in Table 2 that the addition of P2O5 or Al2O3 to the glass composition increases the shrinkage temperature while the end of shrinkage is only affected by the Al2O3 concentration. We also the give the ΔTx=ΔTIS−ΔTES values in Table 2 that correspond to the temperature differences between the start and the end of the shrinkage process i.e. between first and second steps of the HSM curves. There, it is now observed that the temperature range of the shrinkage process decreases with the P2O5 addition but increases with the Al2O3. This indicates that the formation of crystalline phases occurs in a low temperature interval as the P2O3 concentration increases.
From HSM and thermal expansion curves the characteristic temperatures can be determined. In accordance to the pioneer paper published by Scholze [25], each temperature can be assigned to a given fixed point of viscosity. Fig. 2 shows the evolution of the fixed points of viscosity for the prepared glasses. The glasses prepared by Toplis and Dingweel [26] with Na/(Na+Al)<0.6 showed that the addition of P to a glass gives an increase in the viscosity until a concentration of P2O5 about 7% mol. As occurs in our materials, all the glasses containing equivalent amounts of Al2O3 present Tg values very close to each other but a small increase with the P2O5 concentration was determined. Besides, these glasses with similar Al2O3 concentration also show a temperature corresponding to the beginning of the shrinkage very close however, the glass labeled 2P-16A, that contains a high quantity of Al2O3, shifts the TIS to the high temperature. The presence of Al2O3 thus slows down particle sintering.
.")
From TIS1 to TES2, all the glasses present a wide temperature span (about 300°C), a result that is directly related to the formation of crystalline phases [2]. In the high temperature range (above 1000°C), it is observed that both the viscosity and the TF fixed point (corresponding to a η value of 103.4) decrease with the increase of P2O5 content (Fig. 2). Several authors have found similar results for Na/Al<1 (see Table 1), and they have assigned this behavior to the ability of P2O5 for the formation of different structural units (monomers, dimers, extensive chains) with Na2O and Al2O3[26–28].
X-ray diffractionIn order to study the crystalline phases present in the 650–850°C temperature range, several heat treatments for 1h were also carried out. The crystallization temperatures, as determined by DTA were 755°C for 0P-5AF, 760°C for 1P-5AF, 837°C for 3P-5AF and 764°C for 2P-16A [2]. Fig. 3 shows the corresponding XRD patterns. Here is observed that all the as prepared glasses present a typical glass structure without diffractions peaks, although in the case of 3P-5AF and 2P-16A glasses, a small peak that does not increase with the heating treatment could be attributed to an impurity of a pseudo phase of magnesium aluminum zirconium oxide (Mg5Al2.4Zr1.7O12).

At 700°C, all the glasses excepting the one labeled 2P-16A present incipient crystallization of hexagonal lithium aluminum silicate (LAS, code 00-040-0073). A similar LAS phase was reported by Xingzhong et al. [28] in glasses containing 18 Al2O3–68 SiO2–4 Li2O (mol %) with different nucleating agents at a heating at temperatures between 790 and of 830°C and by Ananthanarayan et al. in glasses of 14 Al2O3–72 SiO2–14 Li2O (mol%) with 1.1 (mol %) P2O5 as nucleating agent at temperatures comprised between 600 to 925°C [18]. At 750°C the LAS phase is now observed in the 2P-16A glass and in the remainder glasses with an increase of the intensity of the crystallization peaks as the temperature increases. The main crystalline phases are β-spodumene (LiAlSi2O6, code 00-035-0797) and enstatite (MgSiO3, code 00-022-0714). The formation of β-spodumene has been reported in numerous works in a wide range of compositions and for multiple nucleating agents. When TiO2 is used, β-spodumene appears at temperatures as high as 820°C [29] but the addition of P2O5 seems to delay the formation this phase, as occurs in our materials [30].
In the 2P-16A glass, which was prepared without F as nucleating agent, LAS is the main crystalline phase with a very small amount of β-spodumene, suggesting that F is necessary for the β-spodumene crystallization. Guo et al. demonstrated that little fluorine concentration in glasses improves the crystallization of β-spodumene decreasing the crystallization temperature about 110°C with respect to the fluorine-free glass [31], being this crystallization even more promoted in the presence of both P2O5 and fluorine [32]. The above commented results imply that fluorine and P2O5 are nucleating agents that favor the formation of β-spodumene while P2O5 mainly favors the formation of the LAS phase.
RamanThe evolution of the glass structure after heat treatment between 650°C and 850°C for 1h was further confirmed by Raman spectroscopy (Fig. 4). The spectra of the glasses 0P-5AF and 1P-5AF are typical of aluminum-silicate glasses with broad bands located close to 950cm−1 and 800cm−1 suggesting a quite disordered structure [33]. Silica glasses present the main bands are at 460, 800 and 1100cm−1 due to the SiOSi bonds in Q4 units [34]. Glass modifiers ions such as alkaline or alkaline-earth oxides induce the breakage of the SiOSi bonds leading to a decrease in the 460cm−1 band and an increase of the 1100cm−1 band [35]. The low intensity of the 200–500cm−1 region indicates a large amount of broken SiO− units because of the alkaline ions used in the glass composition (Li+ and Na+). At the same time the incorporation of high field-strength cations (Al3+, Zr4+, Ti4+) leads to a redshift of the 1100cm−1 band indicating that these cations are forming part of a three-dimensional network in a four-fold coordination, probably acting as network formers [36,37]. The variation of the TOT angle (were T represents tetrahedrally coordinated network-forming cations such as Si, Al, Zr and/or Ti) in the glass is the responsible of the disorder and the corresponding broadening of the Raman bands. Moreover, the presence of Li+ in the glasses causes an increase in the intensity of the bands in the 900–1200cm−1 spectral region due to the formation of non-bridging oxygens (NBO) in the silicate network [34,35].

Similarly, as occurred in the XRD patterns, the Raman spectra of the 0P-5AF and 1P-5AF glasses heat treated at 650°C are similar to those of the as-prepared ones, despite the treatment temperature is above Tg. By increasing the temperature to 700°C the Raman bands becomes broader and some small bands also appear. Motion of Si and O atoms in SiOSi bonds is shown in the spectra at 800cm−1 and the band tends to decrease with the depolymerization of the network i.e. with the formation of NBO (i.e. SiO bonds) [34]. In Fig. 4 we observe an increase of this band due to the formation of new SiOSi, SiOAl, SiOZr or SiOTi bonds in new crystalline phases. When silicate glasses are treated above their Tg, the spectral region 1000–1200cm−1 increase in intensity and width forming an unique band as it is observed for the glasses treated at 800 and 850°C [38]. The broadening of the above mentioned bands is clearer in 1P-5AF glass than in 0P-5AF, indicating that the addition of low P2O5 concentrations to the LMAS composition leads to a delay the formation of crystalline phases, as previously observed by XRD [30]. At 850°C these glasses present well defined Raman bands located at 440, 500, 610, 650 and 685 and 950cm−1 while those at 260, 340, 780 and 850cm−1 are broad. All of these peaks must be assigned to the formation of different polymorphs of spodumene such as γ, β and α types [37] but their low intensities suggest that the obtained GC materials still present an important glass phase that is not totally crystallized. In the spectra, the band at 500cm−1 is attributed to β-spodumene [37] and the bands at 650 and 680cm−1 also can be assigned to pyroxene minerals such as enstatite (MgSiO3) [33]. The broad band around 1360cm−1 appearing in the 1P-5AF treated at 650°C could be assigned to the PO stretching vibration [39] and is the only band that could be attributed to the PO bands because of its overlapping with SiOSi [40]. The asymmetric and symmetric stretching of POP would appear at 620 and 1260cm−1, respectively whereas the symmetric stretching of a non-bridging oxygen at 1170cm−1. The characteristic symmetric stretching of the orthophosphate groups is normally found around 960cm−1[41]. The LiO and NaO vibrational modes are also difficult to detect because of the disorder at the Li and Na sites [42].
The incorporation of more than 4% of P2O5 in 3P-5AF produces important changes in the Raman spectra. Three broad and low intensity bands appear at 400, 600 and 800cm−1 and another three high intensity and broad bands at 970, 1030 and 1100cm−1 are attributed to PO bonds [39]. In the low-frequency region the three bands be assigned to the presence of P2O5 in the glass structure by forming TOP bonds (were T=Si, Al, Zr or Ti) [39]. The presence of SiOSi and SiOM (M=Al, Mg, Zr and Ti) can influence the intensity of these bands [35,43]. Near 970cm−1, P2O5-bearing glasses such as Na2O-P2O5-SiO2 glasses present a Raman band assigned to the symmetric stretching vibration of PO and POSi tetrahedral bonds [44], while in orthophosphate and pyrophosphate glasses this band is split in two at 957cm−1 and 1010cm−1[45]. Zirconium phosphates [46] and aluminous glasses [47] also present the split band but it tends to convert to a single band the P2O5 concentration increases indicating that at this Raman shift it can be present the P atoms in different environments (Si, Al, Zr, Ti). Upon heat treatment, XRD diffractograms (Fig. 3) showed small crystallization peaks at 750°C. Raman spectroscopy does not detect any structural change suggesting that the samples contain a high quantity of glass phase. By increasing the temperature to 800 and 840°C, the 3P-5AF GC present several bands at 300, 340, 430, 600 and 640cm−1 previously assigned to different γ, β and α spodumene polymorphs [37] and enstatite [33]. The sharp peak at 957cm−1 involves PO43− ions and can be assigned to γ-Li3PO4[48]. The broad band between 1000 and 1270cm−1 indicates that a glass network has been formed as it occurred in the 0P-5AF and 1P-5AF glasses. In the 3P-5AF glass this band is not present because of the higher concentration of P2O5[38].
The three main peaks at 970, 1030 and 1100cm−1 are maintained in 2P-16A glass and involve the participation of Al3+ cations in the glass or glass-ceramic structures forming Si-O(Al) silicate tetrahedral [47]. Because of the relatively low concentration of PO bonds, it is quite difficult to distinguish these structures on the tail at the right of the 1100cm−1 band. Nevertheless, the 957cm−1 band, which is also found in the Raman spectra of orthophosphate and pyrophosphate species is assigned to the vibration of nonbridging O (PO) or orthophosphate tetrahedral [45].
FT-IRThe structure of the glass and glass-ceramic samples has been also studied by FTIR spectroscopy. Fig. 5 shows the normalized FTIR absorption spectra of the as-prepared and heat treated LMAS glasses. The stretching bands of SiO4 and PO4 tetrahedra [49] results in a broad and high intensity band whose maximum is shifts from 1022 to 1064cm−1 as the P2O5 concentration increases from 0 to 3, respectively. By increasing the Al2O3 content, this band is presented at lower wavenumber (1018cm−1). The high molecular weight of Al2O3 respect to SiO2 and the high field-strength of Al3+ origins this shift thus confirming that Al is bonded to Si through Si-O-Al bonds. The presence of SiOZr and SiOTi bonds which give IR symmetric stretching bands between 950–975cm−1 and 930–950cm−1, and anti-symmetric stretching appear between 1050 and 1200cm−1 respectively, may enhance the broadness and intensity of the band [50]. In this spectral region and, specifically between 850 and 1000cm−1 also appear the vibration of the SiO bands, i.e. the NBO formed by the alkaline ions (Li+ and Na+) [51]. The SiO and PO stretching vibrations appear as a non-symmetric band which starts at about 660cm−1 and presents a maximum at 790cm−1 which is independent of the P2O5 amount but shifts to 725cm−1 for the 2P-16A. In this later glass, the presence of SiOAl bonds leads to a decrease of this band, moreover, the shoulder close to 790cm−1 suggest the coexistence of SiO bonds. Near 470cm−1, all the glasses present the bending vibrations of OSiO and SiOSi bonds. The 3P-5AF glass also shows shoulder at 580cm−1 due to the high concentration of P2O5 and assigned to OPO and POSi bonds [40].
 0P-5AF, (B) 1P-5AF, (C) 2P-16A and (D) 3P-5AF glass-ceramic.")
No significant changes were observed in the spectra of the glasses heat treated at 650°C, however, after heating at temperatures beyond 700°C several changes occur. The band centered around 1000cm−1 presents now several peaks. At 1080cm−1, the 0P-5AF presents a maximum which shifts to 1090cm−1 in 3P-5AF because of the symmetric stretching of SiOSi bonds. This band decreases in intensity when the Al2O3 amount increases. By increasing the temperature of the treatment, the peak appearing at about 1017cm−1 shifts to lower wavenumber. This band is assigned to the formation of lithium aluminosilicates and β-spodumene [52]. It should be noticed also that this is the most intense band in the spectra of the 2P-16A glass ceramic. Close to 1210cm−1 for the 0P-5AF and 1P-5AF glass ceramics and to 1220cm−1 for the 3P-5AF GC a shoulder attributed to the anti-symmetric stretching of SiOSi bonds [35] indicates the release of some SiO2 during the formation of β-spodumene. A shoulder located at 920, 930 and 960cm−1 for the glasses containing 0, 1 and 3% of P2O5, respectively, and at 900cm−1 for the glass with 16% Al2O3 tends to the disappearance as the temperature increases. On its side, a new band appear at 850cm−1 for low P2O5 content and 880cm−1 for high P2O5 content which is attributed to the presence of this oxide. These shoulders could be associated to AlO6 octahedral with NBO as well to the formation of new SiOZr and SiOTi bonds because the SiO2 release after β-spodumene crystallization.
Between 740 and 780cm−1 it appears the Al-O covalent bond in AlO4 tetrahedron in aluminosilicates [53]. This band increases in intensity with both the P2O5 and Al2O3 concentrations in the glass and behaves similarly as the one located at 1010cm−1 indicating that both correspond to the same crystal phase. The peak at 680cm−1 is associated to the one at 560cm−1 and can also be assigned to the vibrations of silicon-oxygen rings in Na(Si2O5) phases [54]. In addition, the presence of two new peaks at 506cm−1 and 560cm−1 at low P2O5 concentration and assigned to AlO6 octahedral [55] indicates that the amount of this oxide influences the formation of crystalline phases such as lithium aluminosilicate or β-spodumene [30]. For P2O5 concentrations lower that 1% the formation of β-spodumene is favored, while for higher P2O5 concentrations the lithium aluminosilicate is the main crystalline phase formed as it was observed by XRD and Raman.
Microstructure developmentFig. 6 shows the SEM photographs of the polished and chemically etched surfaces of the 0P-5AF, 1P-5AF, 2P-16A and 3P-5AF glasses heated at 840°C for 1h. It is clearly observed that, when the Al2O3 is maintained constant in the composition, all the glasses presented the same microstructure independently of the P2O5 content. For the 0P-5AF, 1P-5AF and 3P-5AF the crystals present a wide variety of crystal shapes with tubular, granular and plate-like microstructures, while for the 1P-5AF5 the crystals are mainly globular or spherical-shaped crystals. The plate-like crystals of the GC with different P2O5 concentration are interlocked while the globular crystals are independent one to other.

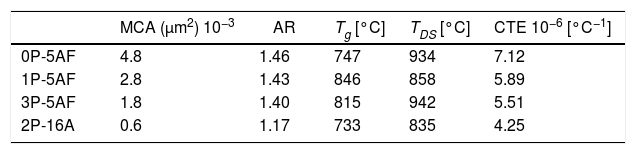
Imaging analysis methods have been used to calculate the area and shape of the crystals appearing in Fig. 6. In Fig. 7 we have represented the distribution of the crystal area for the different GCs. Mean crystal area (MCA) and aspect ratio (AR) are resumed in Table 3. AR was determined by fitting the shape of the crystals to and ellipse and, the AR values are the ration between the two axes in the ellipse. Here it is observed that MCA and AR values tend to decrease with the P2O5 concentration in the glass and also, in the case of the AR value, the decrease is more pronounced in the case of a high Al2O3 content. By increasing either the P2O5 or Al2O3 the crystals tend to acquire a spherical form thus decreasing the area. In addition to that, as we observe in Fig. 7 the obtained LMAS materials present a bimodal crystal size distribution, with a maximum located near the MCA and another maximum at higher crystal area.
Glass-ceramic propertiesCTE
After heat treatment of the glass materials at 860°C, LMAS GC were obtained. The CTE curves shown in Fig. 8 are typical of glass-ceramic materials where crystalline phases are embedded in a glass phase and thus, we can observe that Tg and TDS temperatures falls beyond the corresponding temperatures in their parent glasses (Fig. 1a). The calculated CTE values of the LMAS GC materials in the temperature range comprised between 100 and 500°C and the above mentioned characteristic temperatures are collected in Table 3. The presence of several crystalline phases in the 0P-5AF GC induced the appearance of at least two regions with different slope in the low temperature range (the one used for CTE calculation). The change at about 350°C can be assigned to a phase transition of α to β-cristobalite whereas at 525°C is indicative of a combination of an α- to β-quartz transformation and γ- to β-lithium aluminosilicates [56] Although quartz has not been detected by XRD diffractograms, we might assume its presence in a very slow amount taking into consideration that the peak and shoulder at 1080cm−1 and 1220cm−1, respectively, as well as the peak around 570cm−1 in the FTIR spectra (Fig. 5) suggest the formation of a phase mainly composed by SiOSi bonds, i.e. a silica-rich residual glass phase or, probably, nano-crystals of quartz.

By comparing the values collected in Tables 2 and 3, we can observe that the addition of P2O5 reduces the thermal expansion of the GC in a great manner with respect to the parent glass, and this reduction is more noticed by increasing 16% Al2O3. Tg and TDS increases in the LMAS GC. The observed results can be explained in terms of the crystalline phases detected in each LMAS GC material. Nevertheless, it must be taken into account that not only crystalline phases affect CTE but also the presence of the residual glass phase and its composition also influences in the structure of this residual glass [57].
Depending on the heat-treatment conditions, chemical composition, additives, type of crystalline phases present and their volume content in the GC, then CTE for lithium aluminosilicate glass-ceramics can be varied over a wide range [16,17,58–60]. The CTE values for the LMAS glass-ceramic materials obtained in this work and collected in Table 3 fits quite well with the bibliographic values. In general, the higher glass phase content in the GC material the higher CTE[59,60]. Besides, the type of crystals also influences in CTE values, thus authors which studied β-spodumene-virgilite GC, lithium silicate – lithium disilicate – quartz GC, lithium-magnesium-silicate-cristobalite GC and lithium-aluminosilicate – magnesium calcium silicate with ZrO2 reported values comprised between .4–5.2×10⁻⁶°C−1, 9.95–14.68×10⁻⁶°C−1, 8.5×10⁻⁶°C−1 and 2.2–2.7×10⁻⁶°C−1, respectively [59]. For a LAS GC the addition of P2O5 between 0 to 10% leads to an increase in CTE from 4.0 to 5.1×10⁻⁶°C−1[61]. The results of Table 3 show that the CTE of the LMAS GC decreases from 7.12 to 5.51×10⁻⁶°C−1 a result that must indicate that the crystallinity of the LMAS GC increases with P2O5 addition and therefore the concentration of the residual glass phase decreases but by increasing the Al2O3 concentration CTE decreases [58]. By comparing the CTEs values with the corresponding AR values we obtained good correlation coefficients (r2=0.85) and main crystal areas (r2=0.97), showing the possibility to change the CTE of the GCs materials by changing the shape and size of the crystals.
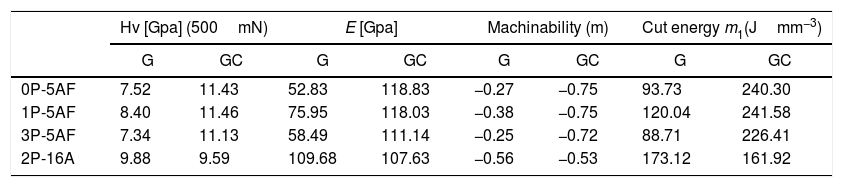
Mechanical propertiesThe calculated values of Hv, E, m and μ1 for the as-prepared glasses and their corresponding glass-ceramic materials are given in Table 4. Here, the presence of Si-O-Al bonds in the 2P-16A glass provides the highest Hv value [62] whereas no correlation with the P2O5 and the Hv value of the glasses has been found. In the case of the GC, the Hv values of the GC with the same 5% Al2O3 content are similar and in any case higher than the glass materials, probably due to the effect of annealing at temperatures lower than the Tg, which has been reported to cause an increase of the local strength of the GC intended for machining due to the elimination of uncontrollable distributions of the residual stress [63]. On contrary, annealing at temperatures above or around Tg may induce changes in the crystalline distribution, as deduced from the microplastic deformation observed in the mechanical testing [63]. The slight differences encountered in the prepared LMAS GC may outcome from their difference microstructures and the crystalline phases present (Fig. 6) [64]. Large crystal size and intertwined structures lead to high Hv values than globular microstructure of lower crystal size and independent of each other. Therefore, the 0P-5AF, 1P-5AF and 3P-5AF with high interlocking crystallinity lead to higher microhardness than the 2P-16A which presents non-interlocking crystallinity, i. e. the interlocking between crystals leads to a more rigid structure that corresponds to higher Hv values. Moreover, the Hv values are directly related to the shape or AR values of the crystals (cor.coef. 0.986), but the Hv increase is limited to a crystal size of 2.8μm2.
Microhardness of parent glass and glass-ceramic samples.
| Hv [Gpa] (500mN) | E [Gpa] | Machinability (m) | Cut energy m1(Jmm−3) | |||||
|---|---|---|---|---|---|---|---|---|
| G | GC | G | GC | G | GC | G | GC | |
| 0P-5AF | 7.52 | 11.43 | 52.83 | 118.83 | −0.27 | −0.75 | 93.73 | 240.30 |
| 1P-5AF | 8.40 | 11.46 | 75.95 | 118.03 | −0.38 | −0.75 | 120.04 | 241.58 |
| 3P-5AF | 7.34 | 11.13 | 58.49 | 111.14 | −0.25 | −0.72 | 88.71 | 226.41 |
| 2P-16A | 9.88 | 9.59 | 109.68 | 107.63 | −0.56 | −0.53 | 173.12 | 161.92 |
The same behavior as the one encountered in the Hv values is found in the case of E values. In general, for glass materials with a continuous microstructure, the elastic modulus is related to the chemical composition and their corresponding atomic bonding energy, packing density, network dimensionality and network topology (chains, rings, etc.) [65]. However, in the case of GC materials, the elastic modulus mostly depends on the microstructure and type of crystalline phases [64]. The globular structure of 2P-16A GC causes the decrease of the E value whereas the GC presenting a platelet-like crystallinity present higher E values. The delay in the formation of crystalline phases at the highest P2O5 concentration may be the responsible of the observed lower E value. In addition to that, E increases with AR but and E maximum value is obtained for crystal areas up to 2.8μm2, and higher crystal areas lead to a decrease in E.
The m and μ1 parameters1, calculated from Hv (Eqs. (2) and (3)) indicate that none of the prepared glasses and GC materials are appropriate for machining because of the negative m value and high μ1[34]. The m parameter is more negative in the GC materials than in the corresponding glasses and, at the same time, the μ1 value is also higher, a result that indicates that these GC materials get worse machinability than their corresponding glasses.
ConclusionsGlasses in the LMAS (Li2O, MgO, Al2O3, SiO2) system with F, CaO, ZrO2 and TiO2 in their compositions have been prepared and crystallized to form glass-ceramic materials. The main conclusions are the following:
- 1.
The characteristic Tg temperatures of both glasses and glass-ceramics increase with the P2O5 and Al2O3 concentrations. At high temperature the viscosity decreases with the Al2O3 concentration.
- 2.
The formation of crystalline phases occurs between 600 and 900°C, being the main phases β-spodumene, lithium aluminum silicate and a low concentration of enstatite. The P2O5 delays the formation of β-spodumene. F is necessary for the formation of β-spodumene and this crystalline phase is improved if both F- and P2O5 are present in the glass. β-spoduene tends to increase with heat treatment crystallization temperature.
- 3.
From Raman and IR spectroscopies has been observed the presence of a glass phase which forms the matrix where the crystalline phases grow. In this glass phase the Al, Ti and Zr cations probably acts as network formers while Li produces the formation of non-bridging oxygens. SiOSi, SiOAl, SiOZr and SiOTi bonds give different bands in the Raman spectra. Enstatite (MgSiO3) bands can be also observed. PO. OPO and SiOP bands are also observed mainly in those glasses with high P2O5 concentrations. The presence of β-spodumene and lithium aluminosilicate phases have been also observed by IR and Raman techniques and when these phases are formed a silica-rich glass phase is released and in it remains as a matrix where the crystals are embedded. The formation of these crystalline phases is favoured by the P2O5 addition.
- 4.
For low Al2O3 concentration the microstructure presents a wide variety of crystal phases with tubular, granular and plate-like shapes, while for high Al2O3 concentration a globular or spherical-like microstructure appears. The mean crystal area and aspect ratio decrease with both the P2O5 and Al2O3 concentrations.
- 5.
The silica rich glass phase is mainly constituted by SiO2, Al2O3 and P2O5. This leads to an increase in the transformation and softening dilatometric temperatures of the GC materials.
- 6.
The CTE values are in accordance with the crystalline phases present in the GCs but its variation is mainly due to the microstructure of the GCs. Because these GCs present the same type of crystal phases, the CTEs increase with both the decrease of the MCA and AR.
- 7.
Mechanical properties are also correlated with the crystalline microstructures presented in the GCs, but it is observed that while Hv increases with AR of the crystals but only increase up to 2.8mm2 of crystal area, higher values of crystal areas do not influence in HV. The same occurs for E property.
- 8.
The machinability parameter and cutting energy indicate that all of these glasses and GCs are not appropriate for machining and that both Al2O3 and P2O5 lead to a decrease in their machinability.
The present work was supported by the Algerian Ministry of Higher Education and Scientific Research (Algerian program P.N.E 2016-2017 scholarship fund) and with the collaboration of the Institute of Ceramic and Glass ICV-CSIC, Madrid, Spain supported by project MAT2016-78700-R financed by Spanish Research Agency and European Regional Development Fund (AEI/FEDER, UE). The authors are also grateful to C. Díaz Dorado for her help with FE-SEM images.

