


El éxito de la revolución verde ha propiciado que algunos analistas sugieran que ésta puede extenderse de manera generalizada a todos los agricultores pobres. Este trabajo sostiene que la presencia de condiciones naturales adecuadas es un prerrequisito importante para la agricultura de alto rendimiento. Al examinar las funciones de producción en China, se advierte que los resultados son altamente sensibles al clima. Por consiguiente, también las funciones de demanda de insumos son sensibles al clima. Los esfuerzos para intensificar la agricultura en regiones no desarrolladas deben centrarse en áreas con suelos y clima adecuados (en especial este último). Los resultados también sugieren que los agricultores modificarán parcialmente la intensidad de utilización de insumos para adaptarse al cambio climático.
The success of the green revolution has prompted some analysts to suggest it can be extended more broadly to all poor farmers. This paper argues that suitable natural endowments are an important precondition for high input farming. Examining production functions across China, we find that outcomes are very climate sensitive. It follows that we also find that input demand functions are climate sensitive. Efforts to intensify farming in undeveloped regions should focus on places with suitable soils and especially climate. The results also suggest that farmers will partially adapt to climate change by altering their input intensity.
In 1960, the yields per hectare of grains used to be quite similar in China and Africa. Currently, the yields in China are three times the yields in Africa. This is evident for both maize (Fig. 1) and rice (Fig. 2). This rapid growth in China and other Asian countries has been credited to the Green Revolution. Although the stimulus for this burst of productivity in Asia first came from advanced seed technology (hybrid varieties), the bulk of the increased production came from high intensity agriculture (Evenson and Gollin, 2003). The success of the green revolution in Asia has led to a call that it be used to help poor farmers around the world (World Bank, 2008).
.")
.")
This paper argues that the green revolution was dependent on favorable soils and climate. The regions in Asia that flourished from the green revolution had good natural endowments of soils and climates. The results suggest that high input agriculture would also work in other areas of the world with adequate natural endowments. However, many poor farmers live in places with inadequate soils and climate. In these places, high input agriculture cannot generate sufficient additional revenues to warrant the additional cost. Although some resource deficiencies can be readily overcome with more inputs, efforts to extend high input agriculture to low productivity sites will often be doomed to failure.
The paper begins with a theoretical model of a net revenue maximizing farmer. The paper argues that if climate and soils enter the production function for the farmer, they will also enter the input demand function. Clearly other constraints that would affect the production function would also affect the input demand function. We therefore test whether market access (Udry, 1995; Sachs et al., 2004; Goldstein and Udy, 2008) and knowledge also affect production. The intriguing prospect of these latter constraints is that policy could possibly free farmers from these limits.
We then conduct empirical analyses of Chinese agriculture. China is a good example of a country that benefited from the Green Revolution. We gather a sample of Chinese farmers from across the country to test whether climate, soil, market access, and knowledge played a role in the production functions for three products: rice, maize, and wheat. We find that climate and soils were very important to all three crops, even though the requirements for each crop were different. We then test whether the input demand function was also sensitive to climate and soils. We find that climate played an important role in the input demand functions as well. In fact, we find that these natural endowments played a larger role than both market access and knowledge in explaining outcomes across the country.
The results suggest that the Green Revolution was not equally beneficial to every farmer. Farmers with more suitable climate and soil conditions got a much larger productivity gain. These additional output gains made adding more inputs more profitable. As a result, farmers in more suitable climates were able to further intensify inputs. However, even in China, farmers with poor natural endowments tend to continue to rely on low input farming. There remain opportunities to intensify farming in undeveloped regions of the world. However, this opportunity is dependent on the underlying natural productivity of each region.
Finally, if the intensity of farm inputs is sensitive to climate, the results also have implications for climate change and adaptation. Climate change can alter the productivity of farmland. A great concern about climate change is that it might make large tracts of current farmland unproductive especially in low latitude semi-arid locations (IPCC, 2013). Farmers will likely change their input intensity in response to climate change. In places where climate makes land more productive, farmers should respond by adding more inputs. But in places where climate change makes land less productive, farmers may respond by adding even fewer inputs and thus causing yields to fall even further. Of course, if food becomes scarce globally, that will increase agricultural prices which will encourage more farm inputs globally.
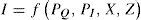
2TheoryWe begin with a theoretical model to shed light on the link between climate and other constraints on the choice of input intensity in farming. The production function determines yield, Q, (output per hectare) given variable inputs chosen by the farmer (I) (technology, capital, labor, and fertilizer), exogenous factors to a farmer that are subject to government policy (X) (market access [roads] and knowledge), and natural endowments (Z) (climate and soils):

The nonlinear nature of these productions functions imply that the derivative of output with respect to any chosen input in I, will likely depend on the exogenous variables, X and Z. The production function is crop specific so that a different function must be estimated for each crop. The functional form can vary although it is generally recognized that variable inputs have positive but declining marginal value and that some factors such as temperature may have a concave nonlinear shape.
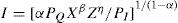
In general, research suggests that production functions tend to be multiplicative (not additive). For example, the following constant elasticity function is an example of a multiplicative production function:

Where α, β, and η are estimated coefficients. Such a function is usually estimated using logs:

The loglinear production function implies that inputs affect output in a proportional manner. For example, a 10% increase in fertilizer will increase output by α% rather than by a specific amount of kg/ha. This means that inputs will be more effective on land with advantageous natural endowments, Z, and with better market access, X. More productive land will encourage farmers to use more inputs.
Farmers utilize their production functions to maximize profits or net revenue (π):

Where PQ are output prices and PI are input prices. Net revenue is the gross revenue (yields multiplied by the market price of output) minus the cost of inputs. Farmers choose the variable inputs that maximize net revenue. Capital inputs must be annualized for this calculation.
Taking the derivative of (4) with respect to I yields:

The farmer equates the marginal productivity to the marginal cost of each input. Any increase in X or Z that increases productivity will increase input intensity. That is, an increase in education, experience, and extension will make purchased inputs more productive. An improvement in natural conditions makes inputs more productive. More favorable economic conditions (high output prices and low input prices) make technology and capital more productive. Property rights and stability give farmers more incentive to invest in long term productivity (capital and technology). As the exogenous variables improve, it is more profitable to use more inputs.
Using these first order conditions, one can deduce an input demand function given the exogenous variables facing each farmer. Solving for I yields an input demand function:
For example, the specific production function of (2) leads to the input demand function:
There are two key insights in (6) and (7). First, correcting market deficiencies (increasing X) is more effective on more productive (higher Z) sites. Second, more productive sites encourage higher levels of inputs. Farms use more inputs because they are more profitable. Specifically, input choice is likely to be sensitive to climate.
One can use the production function and the input demand function to test the relative importance of prices, natural conditions, and socioeconomic variables. There are two measures of the relative importance of each set of factors. One measure is the elasticity. In the specific production function above, the elasticity of inputs is α, the elasticity of the market conditions is β, and the elasticity of natural endowments is η. If an input is more elastic, it is more important. Another measure is the share of the variance across the landscape. How much of the observed variance of output across the landscape can be explained by each independent variable? The landscape, in this case, could be a country, a continent, or the entire data set (all the countries being compared).
Note that the theory does not determine which factor is more important. However, the theory is very clear that all the relevant factors can play an important role. In order to determine which factors are relatively more important, one must conduct empirical analyses.
3EstimationWe take two different approaches in this analysis. First we calculate a production function for key crops in each region. We specifically estimate production functions for rice, maize and wheat in China. We rely on a sample of over 8400 individual farms across China (Wang et al., 2009).
Using a cross sectional regression, we estimate a loglinear production function of (7). The weakness of cross-sectional studies is that they do not control for missing variables that may vary across space and influence yields. If these variables are measured and appropriately included in the analysis, there is no bias. But unmeasured variables or poorly specified equations can lead to biases in the analysis. The strength of the cross sectional studies, however, is that they capture the adjustments that farmers are likely to make in different conditions. For example, they specifically capture climate adaptations that farmers are already making.
We also estimate input demand functions for each farm using the cross sectional approach. Input demand functions determine the amount of capital, irrigation, and fertilizer each farmer chooses to apply given the independent variables. This can help explain why there is a range of inputs applied across the landscape.
By comparing the results of the yield functions and the input demand functions, one can get a rich explanation of why productivity varies across China. These studies attempt to isolate the value of natural endowment, knowledge, and market access.
Two measures of importance will be explored. One measure is the elasticity of each variable which reveals its direct influence on yields and inputs. The other measure of influence will be an analysis of variance. This will measure how much of the variation in yields and inputs can be explained by each set of independent variables.
For example, with the production function in (2), the variance of yields explained by all three factors is:

The share of this variance explained by I versus I, Z, and X is:
4Results4.1Production functions
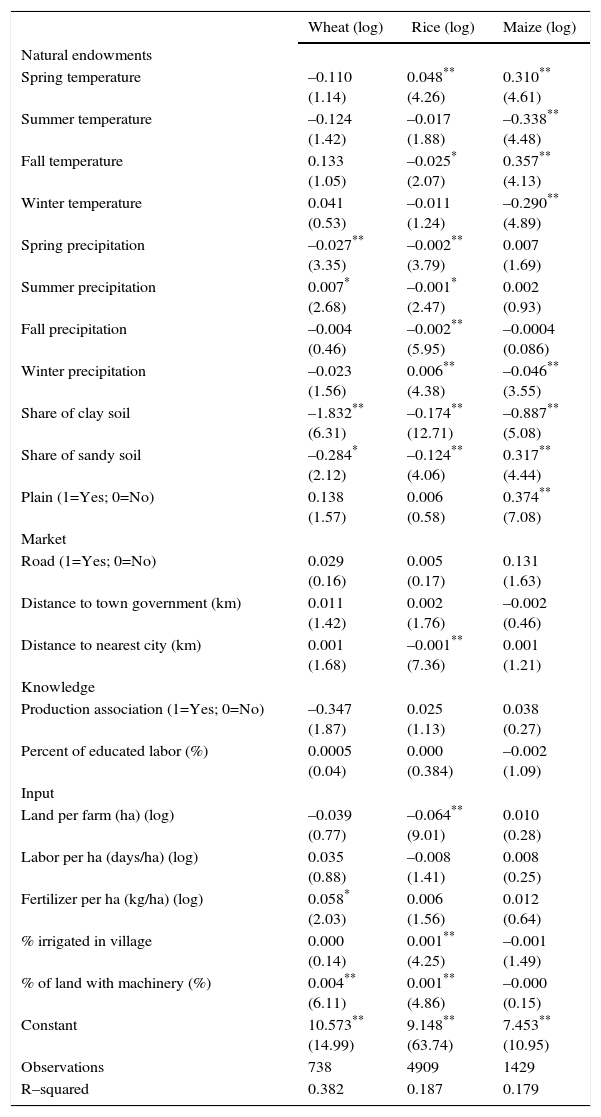
Table I presents production functions for rice, maize, and wheat in China. Output is measured in yield per ha. The size of the farm is also tested. There are three inputs that vary per ha: fertilizer, irrigation, and machinery. There are also three classes of exogenous variables: natural endowments (climate, soils, and geography), knowledge (education and membership in a production association), and market access (proximity to cities, roads, and other services).
Production function regressions in China.
| Wheat (log) | Rice (log) | Maize (log) | |
|---|---|---|---|
| Natural endowments | |||
| Spring temperature | –0.110 (1.14) | 0.048** (4.26) | 0.310** (4.61) |
| Summer temperature | –0.124 (1.42) | –0.017 (1.88) | –0.338** (4.48) |
| Fall temperature | 0.133 (1.05) | –0.025* (2.07) | 0.357** (4.13) |
| Winter temperature | 0.041 (0.53) | –0.011 (1.24) | –0.290** (4.89) |
| Spring precipitation | –0.027** (3.35) | –0.002** (3.79) | 0.007 (1.69) |
| Summer precipitation | 0.007* (2.68) | –0.001* (2.47) | 0.002 (0.93) |
| Fall precipitation | –0.004 (0.46) | –0.002** (5.95) | –0.0004 (0.086) |
| Winter precipitation | –0.023 (1.56) | 0.006** (4.38) | –0.046** (3.55) |
| Share of clay soil | –1.832** (6.31) | –0.174** (12.71) | –0.887** (5.08) |
| Share of sandy soil | –0.284* (2.12) | –0.124** (4.06) | 0.317** (4.44) |
| Plain (1=Yes; 0=No) | 0.138 (1.57) | 0.006 (0.58) | 0.374** (7.08) |
| Market | |||
| Road (1=Yes; 0=No) | 0.029 (0.16) | 0.005 (0.17) | 0.131 (1.63) |
| Distance to town government (km) | 0.011 (1.42) | 0.002 (1.76) | –0.002 (0.46) |
| Distance to nearest city (km) | 0.001 (1.68) | –0.001** (7.36) | 0.001 (1.21) |
| Knowledge | |||
| Production association (1=Yes; 0=No) | –0.347 (1.87) | 0.025 (1.13) | 0.038 (0.27) |
| Percent of educated labor (%) | 0.0005 (0.04) | 0.000 (0.384) | –0.002 (1.09) |
| Input | |||
| Land per farm (ha) (log) | –0.039 (0.77) | –0.064** (9.01) | 0.010 (0.28) |
| Labor per ha (days/ha) (log) | 0.035 (0.88) | –0.008 (1.41) | 0.008 (0.25) |
| Fertilizer per ha (kg/ha) (log) | 0.058* (2.03) | 0.006 (1.56) | 0.012 (0.64) |
| % irrigated in village | 0.000 (0.14) | 0.001** (4.25) | –0.001 (1.49) |
| % of land with machinery (%) | 0.004** (6.11) | 0.001** (4.86) | –0.000 (0.15) |
| Constant | 10.573** (14.99) | 9.148** (63.74) | 7.453** (10.95) |
| Observations | 738 | 4909 | 1429 |
| R–squared | 0.382 | 0.187 | 0.179 |
Absolute value of t-statistics in parentheses;
The elasticity of inputs is often insignificant in the production functions. Labor is not significant in any regression. Output per ha is higher in smaller rice farms but farm size otherwise does not matter. Fertilizer increases the productivity of only wheat. Irrigation significantly increases the productivity of rice. Machinery increases the productivity of both wheat and rice.
Knowledge has no effect on output per ha whether measured by education or membership in a production association. Market access is also generally insignificant. Distance to market reduces the productivity of only rice.
Soils are very significant and the elasticities are large. Clay soils reduce the productivity of every crop. Sandy soils reduce the productivity of wheat and rice but increase the productivity of maize. Being on a plain is very beneficial but only to maize.
However, the key coefficients in Table I concern the climate variables. Seasonal temperature has no effect on the productivity of wheat. However, lower spring precipitation and higher summer precipitation are beneficial to wheat. Higher spring and lower fall temperatures are beneficial to rice in China. Lower precipitation in spring, summer, and autumn and higher precipitation in winter all increase rice production. Higher spring and autumn temperatures, as well as lower summer and winter temperatures all increase maize production. Seasonal precipitation has no measurable effect on maize.
The signs of the climate results are tricky to interpret. The regression is linear for this sample but the overall sensitivity of most crops is nonlinear. Crop samples within a country can contain only a limited range of temperature and precipitation. The results can be sensitive to the mean sample climate. For example, if the crop is grown near its ideal climate, the marginal climate values can be zero. However, if the crop is grown in a place that is too wet (dry) or too hot (cold), the marginal effect can be negative (positive).
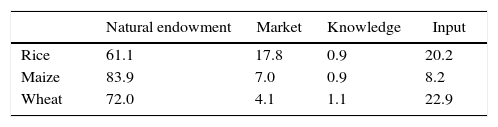
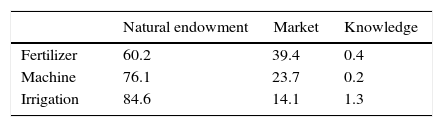
Another important measure of the importance of different factors concerns how much they explain the enormous variation in yields across the landscape. The analysis of China's production functions in Table II reveals that natural endowments (climate and soil) explain 84% of maize, 72% of wheat, and 61% of rice yields. Market factors explain another 18% of rice yields, and 7% of maize and 4% of wheat yields. Knowledge has no effect. In China, climate and soils explain a great deal of the observed range in yields.
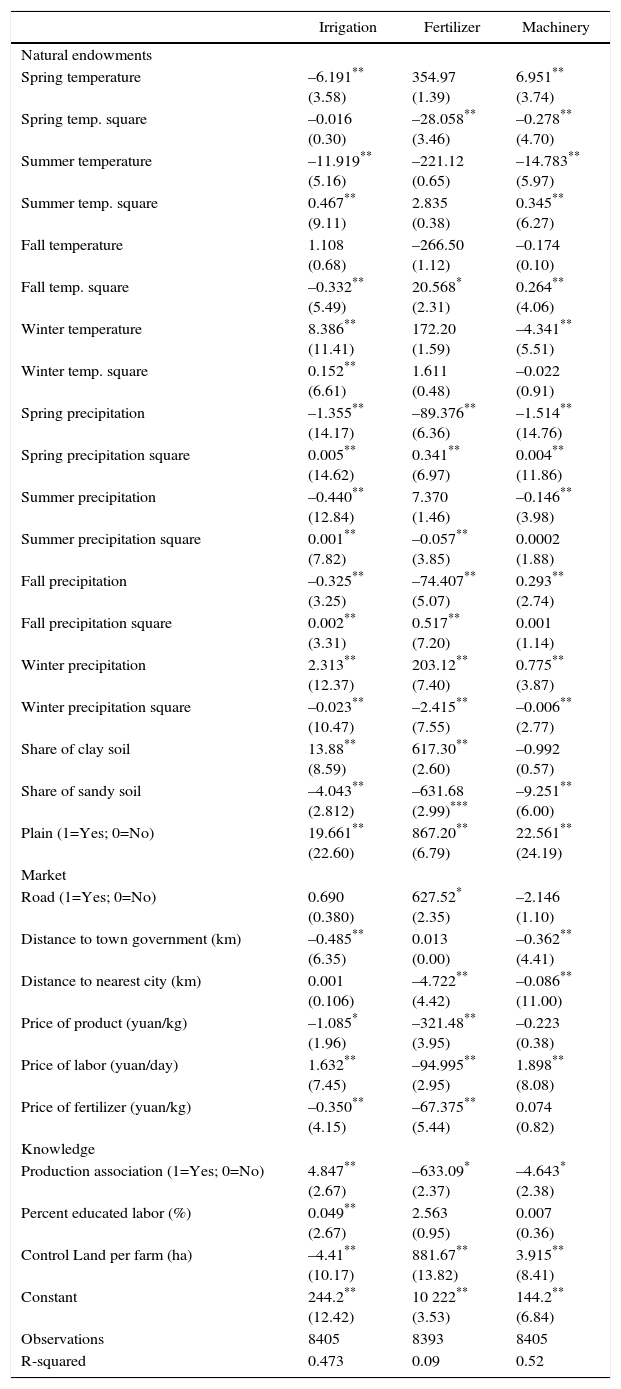
4.2Input demand functionsTable III tests the input demand hypothesis directly by estimating the input demand function of each farmer. The input demand function depends on the size of farm, knowledge, market access (including prices), soils, geography, and climate. Larger farms tend to use more fertilizer and machinery. However, smaller farms are more likely to be irrigated. Farms with access to production associations use more fertilizer and machinery but are less likely to be irrigated. In addition to providing information, production associations sometimes provide less expensive inputs. Higher output prices surprisingly lead to less inputs. This is not what theory would predict and suggests a missing variable associated with higher prices that is a constraint for farmers. Higher fertilizer prices reduce fertilizer use as expected. Looking at cross-price effects, higher fertilizer prices slightly reduce irrigation suggesting fertilizer and irrigation are complementary. Again looking at cross-price effects, higher wages reduce fertilizer use but increase irrigation and machinery use. It is obvious that machinery and labor are substitutes but it is less clear that labor and irrigation are substitutes. It is also not obvious that labor and fertilizer are complementary. Market access increases the use of fertilizer as expected whether measured by being on a road or distance to the nearest city. Greater distance to the nearest city also reduces machinery use. Distance to the nearest government center reduces both irrigation and machinery use. It is not clear whether access to the nearest government center reflects access to their assistance or whether the centers are proxies for markets.
Input regressions of Chinese farmers.
| Irrigation | Fertilizer | Machinery | |
|---|---|---|---|
| Natural endowments | |||
| Spring temperature | –6.191** (3.58) | 354.97 (1.39) | 6.951** (3.74) |
| Spring temp. square | –0.016 (0.30) | –28.058** (3.46) | –0.278** (4.70) |
| Summer temperature | –11.919** (5.16) | –221.12 (0.65) | –14.783** (5.97) |
| Summer temp. square | 0.467** (9.11) | 2.835 (0.38) | 0.345** (6.27) |
| Fall temperature | 1.108 (0.68) | –266.50 (1.12) | –0.174 (0.10) |
| Fall temp. square | –0.332** (5.49) | 20.568* (2.31) | 0.264** (4.06) |
| Winter temperature | 8.386** (11.41) | 172.20 (1.59) | –4.341** (5.51) |
| Winter temp. square | 0.152** (6.61) | 1.611 (0.48) | –0.022 (0.91) |
| Spring precipitation | –1.355** (14.17) | –89.376** (6.36) | –1.514** (14.76) |
| Spring precipitation square | 0.005** (14.62) | 0.341** (6.97) | 0.004** (11.86) |
| Summer precipitation | –0.440** (12.84) | 7.370 (1.46) | –0.146** (3.98) |
| Summer precipitation square | 0.001** (7.82) | –0.057** (3.85) | 0.0002 (1.88) |
| Fall precipitation | –0.325** (3.25) | –74.407** (5.07) | 0.293** (2.74) |
| Fall precipitation square | 0.002** (3.31) | 0.517** (7.20) | 0.001 (1.14) |
| Winter precipitation | 2.313** (12.37) | 203.12** (7.40) | 0.775** (3.87) |
| Winter precipitation square | –0.023** (10.47) | –2.415** (7.55) | –0.006** (2.77) |
| Share of clay soil | 13.88** (8.59) | 617.30** (2.60) | –0.992 (0.57) |
| Share of sandy soil | –4.043** (2.812) | –631.68 (2.99)*** | –9.251** (6.00) |
| Plain (1=Yes; 0=No) | 19.661** (22.60) | 867.20** (6.79) | 22.561** (24.19) |
| Market | |||
| Road (1=Yes; 0=No) | 0.690 (0.380) | 627.52* (2.35) | –2.146 (1.10) |
| Distance to town government (km) | –0.485** (6.35) | 0.013 (0.00) | –0.362** (4.41) |
| Distance to nearest city (km) | 0.001 (0.106) | –4.722** (4.42) | –0.086** (11.00) |
| Price of product (yuan/kg) | –1.085* (1.96) | –321.48** (3.95) | –0.223 (0.38) |
| Price of labor (yuan/day) | 1.632** (7.45) | –94.995** (2.95) | 1.898** (8.08) |
| Price of fertilizer (yuan/kg) | –0.350** (4.15) | –67.375** (5.44) | 0.074 (0.82) |
| Knowledge | |||
| Production association (1=Yes; 0=No) | 4.847** (2.67) | –633.09* (2.37) | –4.643* (2.38) |
| Percent educated labor (%) | 0.049** (2.67) | 2.563 (0.95) | 0.007 (0.36) |
| Control Land per farm (ha) | –4.41** (10.17) | 881.67** (13.82) | 3.915** (8.41) |
| Constant | 244.2** (12.42) | 10 222** (3.53) | 144.2** (6.84) |
| Observations | 8405 | 8393 | 8405 |
| R-squared | 0.473 | 0.09 | 0.52 |
Absolute value of t-statistics in parentheses;
Natural endowments have a large influence on inputs. Clay soils increase both irrigation use and fertilizer use. Sandy soils discourage all three inputs: irrigation, fertilizer, and machinery. Being on a plain is beneficial to all three inputs: irrigation, fertilizer, and machinery.
The key to Table III, however, lies in the climate coefficients. Temperature and precipitation are highly significant in the input demand functions. The effects are quite nonlinear as many of the coefficients of the seasonal squared terms are significant. The signs of the squared terms vary by season implying a concave shape when negative and a convex relationship when positive. For example, the spring temperature tends to have a concave effect on inputs whereas the summer, autumn, and winter temperatures tend to have a convex effect with some exceptions. Spring and autumn precipitation have a convex effect on inputs whereas winter precipitation has a concave effect. Summer precipitation has a convex effect on irrigation and a concave effect on fertilizer.
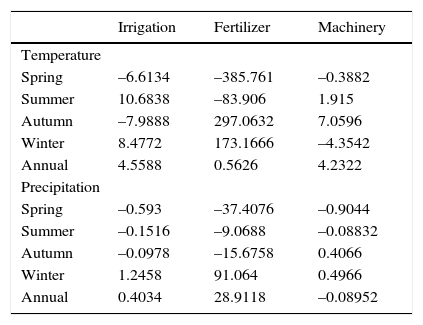
In order to interpret the combined linear and quadratic effects of climate on inputs, we calculate the marginal effect of each climate variable at the mean seasonal climate of the sample in Table IV. A slightly warmer spring and autumn reduce irrigation whereas a warmer summer and winter increase irrigation. A slightly warmer spring and summer reduce fertilizer whereas a warmer autumn and winter increase it. A warmer autumn increases the use of machinery whereas a warmer winter decreases it. More precipitation in spring reduces irrigation whereas more precipitation in winter increases it. The winter effect could have more to do with the supply of water than the demand for it. More precipitation in the spring and autumn decreases fertilizer demand but more winter precipitation increases it. The winter precipitation is helpful because it means the soil is moist when the seeds are first introduced. More spring precipitation reduces machinery use but more rain in the autumn and winter increase it.
Marginal effect of Climate on inputs.
| Irrigation | Fertilizer | Machinery | |
|---|---|---|---|
| Temperature | |||
| Spring | –6.6134 | –385.761 | –0.3882 |
| Summer | 10.6838 | –83.906 | 1.915 |
| Autumn | –7.9888 | 297.0632 | 7.0596 |
| Winter | 8.4772 | 173.1666 | –4.3542 |
| Annual | 4.5588 | 0.5626 | 4.2322 |
| Precipitation | |||
| Spring | –0.593 | –37.4076 | –0.9044 |
| Summer | –0.1516 | –9.0688 | –0.08832 |
| Autumn | –0.0978 | –15.6758 | 0.4066 |
| Winter | 1.2458 | 91.064 | 0.4966 |
| Annual | 0.4034 | 28.9118 | –0.08952 |
The offsetting seasonal effects suggest that an annual uniform warming would have little effect on fertilizer use. However, warming would tend to increase the use of irrigation and machinery. Warming may be having such a positive effect on inputs because it allows farmers to extend from planting one season per year to two seasons. With more seasons, farms are more productive. A uniform increase in precipitation would have little effect on machinery but it would slightly increase irrigation and dramatically increase fertilizer use.
The share of different factors explaining inputs are shown in Table V. In China, natural endowments (climate and soil) explain 60% of the variation in fertilizer, 76% of the variation in machinery, and 85% of the variation in irrigation. Market conditions (prices and access) explain 39% of the variation in fertilizer, 24% of the variation in fertilizer, and 14% of the variation in machinery. Knowledge explains almost nothing at all about input choice. The results imply that China's investment in farm inputs is carefully linked with natural productivity.
A detailed analysis of irrigation and dryland farms in China reveals warming reduces the net revenue of rainfed farms in China, but increases the net revenue of irrigated farms (Wang et al., 2009). Provided there is enough water for irrigation, increased irrigation is an effective adaptation for Chinese farmers to warming.
5ConclusionThe results of these analyses reveal that favorable natural conditions are an important prerequisite for intensifying agriculture. Even in China which is an important example of the Green Revolution, there is evidence that input intensity has been carefully matched with productive land. More productive land has high inputs and less productive land has fewer inputs. By using less inputs, low productive farms have even lower yields, but they have almost comparable net revenues per ha.
Curiously, there is no evidence in China that larger farms are more productive. There appears to be no economies to scale despite the average size of Chinese farms being close to 1 hectare. There is also no evidence that knowledge influences input choice. Finally, despite the strong presence of government in the Chinese economy, Chinese farmers are still very responsive to market conditions. Market access tends to change their behavior as expected for most measures tested. The only exception was the unexpected response to output prices.
The results in this paper apply directly to China. However, the lessons are likely relevant to countries around the world. Whether or not a country will benefit from intensifying agriculture will depend upon whether the soils and especially the climate are productive to start with. Intensifying agriculture in low productivity settings may be a recipe for failure.
The responsiveness of inputs to climate also suggests that as climate changes, farmers will alter their inputs. If the climate change increases the productivity of the farm, farmers will increase input intensity. This will increase the yield change even further and it will also increase the growth in net revenue. However, if climate change reduces the productivity of the farm, farmers will adjust by reducing their inputs. This will make the yield reduction larger but the net revenue reduction smaller. Finally, as the global food supply shrinks, prices will rise and this will encourage farmers everywhere to increase inputs. It is likely that farmers around the world will adapt to climate change by changing input intensity but the local adaptations will depend on all the factors above.
This project was financed by the World Bank. We want to thank Don Larson for his many constructive comments. All views expressed in this article are the author's alone.