


Sarcopenia is a common complication of end-stage liver disease (ESLD), but its exact relationship to myosteatosis and frailty remains unclear. In this pilot study, we tested the feasibility of a specialized MRI protocol and automated image analysis in patients with ESLD.
Materials and MethodsIn a single-center prospective study, adult liver transplant candidates with ESLD underwent assessment of muscle composition between 3/2022 and 6/2022 using the AMRA® MAsS Scan. The primary outcome of interest was feasibility of the novel MRI technique in patients with ESLD. We also tested if thigh muscle composition correlated with validated measures of frailty and sarcopenia.
ResultsEighteen subjects (71 % male, mean age 59 years) were enrolled. The most common etiologies of cirrhosis were alcohol-related liver disease (44 %) and non-alcohol-associated fatty liver disease (33 %), with a mean MELD-Na of 13 (± 4). The mean time needed to complete the MRI protocol was 14.9 min and only one patient could not complete it due to metal hardware in both knees. Forty-one percent of patients had adverse muscle composition (high thigh fat infiltration and low-fat free muscle volume) and these patients were more likely to have undergone a recent large volume paracentesis (43 % vs. 0 %, p < 0.02). The adverse muscle composition group performed significantly worse on the 6-minute walk test compared to the remainder of the cohort (379 vs 470 m, p < 0.01).
ConclusionsThe AMRA® MAsS Scan is feasible to perform in patients with ESLD and can be used to quantify myosteatosis, a marker of muscle quality and potentially muscle functionality in ESLD.
Sarcopenia, defined as loss of muscle mass and functionality, is commonly observed in elderly patients and those with chronic medical conditions [1]. Sarcopenia occurs in 40–70 % of patients with end-stage liver disease (ESLD) [2,3] and is linked to frailty, which is characterized by an increased vulnerability to health stressors [4]. Sarcopenia and frailty result from multiple pathologic processes that occur in cirrhosis, including a sedentary lifestyle [5], malnutrition [6,7], hyperammonemia [8], and dysregulation of proteostasis [9]. While originating in the field of geriatrics, both complications are now recognized as critical determinants of outcomes in ESLD, predicting higher waitlists [3,10] and post-transplant mortality [11] and longer hospital admissions [12].
Despite sarcopenia's known connection to frailty and functional decline, evaluation of sarcopenia in the field of hepatology has historically focused on quantifying muscle mass alone. Among the different measurement techniques, the L3 skeletal muscle index (L3-SMI) assessed on cross-sectional imaging, either computed tomography (CT) or magnetic resonance imaging (MRI), is the most validated and objective sarcopenia assessment tool [13]. L3-SMI, however, only quantifies muscle mass and does not evaluate the quality of skeletal muscle or its function, both of which likely contribute to progressive functional decline and, thus, worse clinical outcomes in ESLD.
In recent years, myosteatosis (i.e., intramuscular fat or muscle fat infiltration) has emerged as a marker of poor muscle function [14] and is associated with adverse clinical outcomes, including increased mortality [15,16]. Evaluation of myosteatosis could further elucidate the relationship between sarcopenia and frailty in ESLD [15]. Unlike bioelectrical impedance spectroscopy (BIS) and dual-energy x-ray absorptiometry (DXA) [1], which assess overall adiposity, cross-sectional imaging can measure myosteatosis, which reflects the quality of skeletal muscle and is a surrogate of its functionality (i.e., myosteatosis = functional deficit) [17].
Advanced MR imaging techniques developed to identify intrahepatic fat in non-alcoholic fatty liver disease (NAFLD) [18] could be levied to directly quantify myosteatosis in ESLD. AMRA® MAsS Scan is a novel, specialized neck-to-knee rapid MRI protocol and automated image analysis technique that obtains volumetric assessments of skeletal muscle mass along with the quantification of myosteatosis. Hence, we evaluated the feasibility of performing body composition analysis using AMRA® MAsS Scan in liver transplant (LT) candidates with ESLD. We also tested if MRI-measured thigh muscle composition, specifically Muscle Fat Index [MFI] and Muscle Volume Index [MVI], correlated with frailty metrics and other validated measures of sarcopenia such as L3-SMI and phase angle from BIA.
2Materials and MethodsAdult (≥ 18 years) LT candidates with cirrhosis at the University of Pittsburgh Medical Center were prospectively enrolled from 3/1/2022 to 6/17/2022. Patients with MRI-incompatible devices were excluded.
All participants were scanned in a 3T Magnetom Prisma Fit (Siemens Healthcare, Erlangen, Germany), using a non-contrast 6-min dual-echo Dixon protocol, which provides a water- and fat-separated volumetric data set covering the neck to the knees. The sequence is separated into six stations, with the abdominal stations including breath hold acquisition. Advanced body composition analysis was then performed using the AMRA® MAsS Scan (AMRA Profiler 4, AMRA Medical AB, Linköping, Sweden; currently available for clinical use in the United States and Canada) in order to calculate the thigh fat free muscle volume (FFMV) and muscle fat infiltration (MFI), abdominal visceral and subcutaneous adipose tissue volume as well as the liver proton density fat fraction (PDFF) (See Fig. 1 for a sample report). In the present study, only the muscle measurements were used.


The methodology and MR protocols used in this study have been extensively published elsewhere. Briefly, body composition analysis carried out by AMRA Medical AB consists of the following steps (based upon the acquired MR images): 1) automatic image calibration; 2) automatic labeling and registration of fat and muscle regions to the acquired image volumes; 3) quality control of anatomical regions and MR-data performed by trained analysis engineers at AMRA Medical AB; and 4) quantification of fat and muscle volumes based on the calibrated images[19–22]. Muscle volumes were calculated as fat free muscle volumes and muscle fat infiltration as the average T2 corrected fat value converted to the PDFF. The body composition measurements based on these methods have been reported to be comparable across commonly used clinical MRI scanners and field strengths[23].
Advanced body composition analysis was then performed using the AMRA® MAsS Scan in order to calculate the Muscle Assessment Score (MAsS) based on thigh fat free muscle volume and muscle fat infiltration. These measures were adjusted for sex and body size, respectively, resulting in the thigh MFI (percentage points [pp]) and thigh MVI (standard deviations [SD]), collectively known as MAsS. Participants were identified as having adverse muscle composition if they had high thigh MFI and low thigh MVI which were based on previously established gender specific cutoffs (males: thigh MFI > 1.31 pp, thigh MVI < −0.68 SD; females: MFI > 1.25 pp, MVI < −0.67 pp) in patients with NAFLD [14,24]. Additional measures obtained via AMRA® MAsS Scan included abdominal visceral fat volume (liters [L]), abdominal subcutaneous fat volume (L), and liver fat percentage (%). The same MR images were also used to measure the L3 skeletal mass fatty infiltration (L3-SMFI), as well as standard markers of sarcopenia (L3-SMI) using AMRA® Researcher.
The phase angle, defined as the ratio of whole-body reactance to resistance, was measured at each participant's initial liver transplant evaluation using BIS (SOZO, ImpediMed Inc., Carlsbad CA) [25]. BIS is standard of care at our institution for all patients meeting with our transplant dietician as part of their initial evaluation. Finally, frailty was assessed by a licensed physical therapist using the 6-minute walk test (6MWT), gait speed test (GST) and liver frailty index (LFI), which consists of three components: 1) balance testing; 2) repeat chair stands and 3) grip strength. LFI scores were used to classify subjects into three categories of frailty: robust (LFI 0-3.2), pre-frail (LFI 3.3-4.4) and frail (LFI ≥4.5).
Baseline demographics (age, sex, race, ethnicity) and clinical characteristics were extracted from the electronic medical records, including 1) etiology of liver disease; 2) liver related complications (hepatic encephalopathy [HE], ascites [± diuretic use, ± large volume paracentesis in the last three months], hepatocellular carcinoma); and 3) laboratory data (platelets, sodium, creatinine, glomerular filtration rate, aspartate aminotransferase [AST], alanine aminotransferase [ALT], alkaline phosphatase [ALP], prothrombin time/international normalized ratio [PT/INR]). Biologic MELD-Na (Model of End-Stage Liver Disease – Sodium) scores were calculated at time of enrollment.
Patients’ demographics and clinical characteristics were summarized using means ± standard deviations (SD) or medians plus (25th – 75th percentiles), as appropriate. Normality of sample data was tested using the Shapiro-Wilk test. Two-tailed Student's t and Wilcoxon rank-sum tests were used to assess differences between continuous variables, as appropriate, whereas the Pearson's chi-square test was used for categorical variables. Pearson correlation coefficients were used to measure the association between normally distributed measures of sarcopenia and frailty, while Spearman's rank correlation coefficients were used for data identified as skewed. L3-SMI sarcopenia was defined as a value <50 cm2/m2 in males and <39 cm2/m2 in females, whereas a phase angle <3.8° defined sarcopenia, irrespective of sex [13].
In order to assess the primary outcome (i.e., the feasibility of measuring adverse muscle composition using the AMRA® MAsS Scan), we determined the percentage (%) of participants who successfully completed the MRI protocol and the total time (minutes) needed to complete the imaging study. We expected to have reliable readings in at least 85 % of participants with studies being performed over an average time of no more than 15 min. A convenient sample of 18 consecutive subjects was determined, followed by power calculation across paired correlations for the other outcomes of interest. Statistical analyses were carried out using Stata v16 (StataCorp, College Station, TX).
2.1Ethical statementsThe study was performed under the provisions of the University of Pittsburgh Institutional Review Board, and all eligible patients were given consent prior to enrollment. The study protocol conformed to the ethical guidelines of the 1975 Declaration of Helsinki.
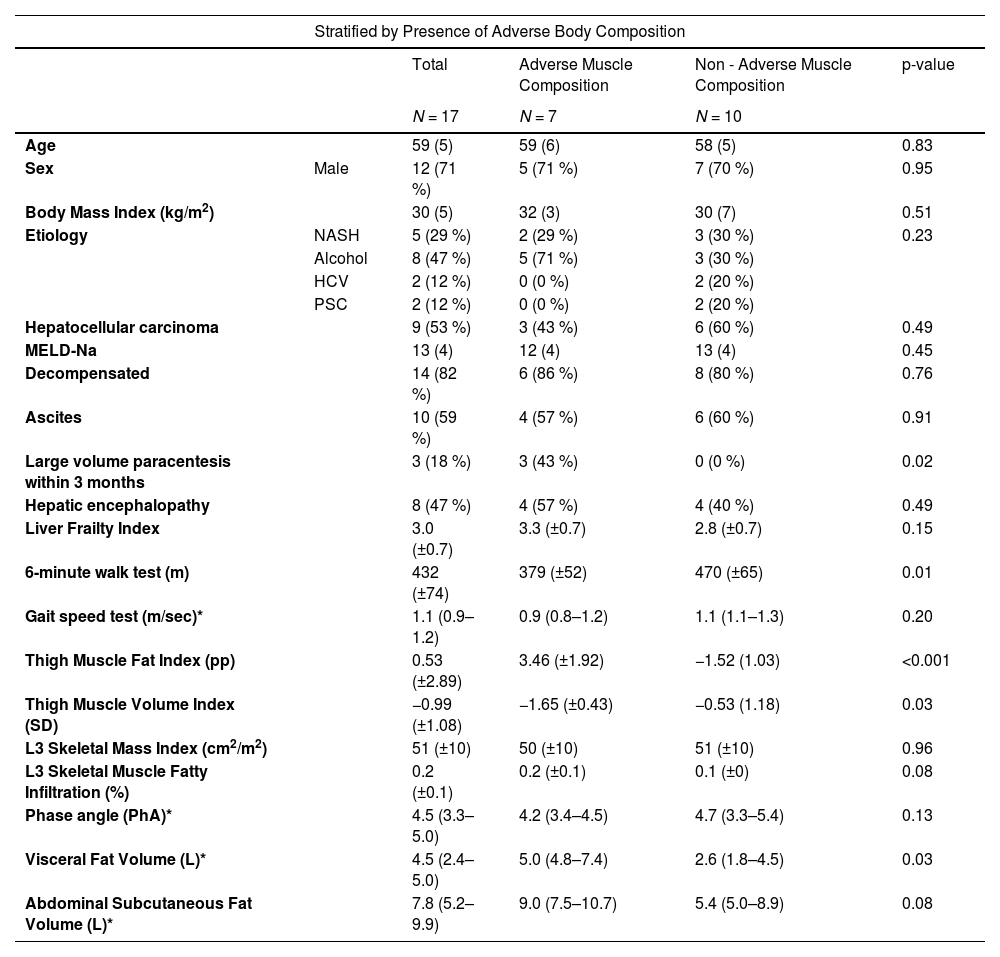
3ResultsA total of 18 patients with ESLD were enrolled. Baseline clinical characteristics are shown in Table 1. The mean age of the patient cohort was 59 years, 12 (67 %) were male and the mean BMI was 31 (± 6) kg/m2. The most common etiologies of ESLD were alcohol-related liver disease in 8 (44 %) patients and NAFLD in 6 patients (33 %). Nine (50 %) patients had hepatocellular carcinoma (HCC). The mean MELD-Na was 13 (± 4) and 15 (83 %) were decompensated, with most participants having clinical evidence of ascites and HE. On assessment of frailty, the mean LFI was 3.1 (± 0.7), with 12 (67 %) being robust, five (28 %) pre-frail and one (5 %) frail. The mean total time needed to complete the specialized MRI protocol was 14.9 min (9.9–16.8), with a total of 12 (66 %) performed in less than 15 min. There were no adverse events related to the MRI protocol. In only one patient, the MRI protocol did not provide reliable anthropometric information due to metal hardware in both knees creating artifacts in the lower thighs. The mean thigh MFI was 0.53 (± 2.89) pp and the mean thigh MVI was −0.99 (± 1.08) SD. L3-SMI measurements were completed in 15 subjects. Three patients had metal hardware in the lumbar vertebrae precluding accurate measurement. Sarcopenia by L3-SMI was observed in three (18 %) of the participants (two [17 %] males and one [20 %] female). BIS was available on 11 participants and 3 (27 %) had sarcopenia as defined by the phase angle (two females [50 %] and one [15 %] male).
Clinical characteristics.
Excludes 1 patient without AMRA measurements.
*Median (25th – 75th percentile).
Based on previously defined cutoffs, seven (41 %) patients had adverse muscle composition with high thigh MFI and low thigh MVI (Table 1) (Fig. 2). There were no significant differences in age, sex, BMI, etiology of liver disease or MELD-Na between the adverse muscle composition group and the non-adverse muscle composition group. Compared to the remainder of patients, those with adverse muscle composition were more likely to have undergone at least one large volume paracentesis within the last three months (43 vs. 0 %, p = 0.02). The adverse muscle composition group also had a lower mean 6MWT (379 vs.470 m, p < 0.01) (Fig. 3), walking 91 fewer meters than the non-adverse muscle composition group on average. Additionally, the adverse muscle composition group had a higher visceral fat (5.0 vs. 2.6 L, p = 0.02) than the rest of the cohort. There were no differences in other measures of frailty (LFI and GST) or anthropometric measures (L3-SMI, L3-SMFI or phase angle).


Thigh MFI strongly correlated with L3-SMFI (r = 0.73, p < 0.01), the measure of truncal myosteatosis. Both thigh MFI and L3-SMFI moderately correlated with 6MWT (r = −0.58 and r = −0.62, respectively) (Figs. 4, 5), while L3-SMFI also moderately correlated with GST (r = −0.53) (Table 2). Thigh MVI strongly correlated with phase angle measured on BIS (r = 0.68) but did not correlate with any measures of frailty. L3-SMI was poorly correlated with GST and did not correlate with any other measures of frailty (Table 2). There was no significant correlation between LFI and any anthropometric measure (Supplementary Fig. 1). The remainder of correlations are shown in Table 2.


Correlation between myosteatosis and other measures of body composition and frailty.
* Spearman coefficient (rather than Pearson coefficient).
In this prospective feasibility study, we found that a novel MRI protocol and automated image analysis technique (AMRA® MAsS Scan) was feasible in patients with end-stage liver disease. Notably, we found that patients with adverse muscle composition (defined as high intramuscular fat and low muscle volume in the thigh) were more likely to have undergone a large volume paracentesis within the last three months and performed significantly worse on the 6MWT, a highly validated measure of cardiorespiratory fitness and overall frailty [27]. Moreover, muscle fat infiltration (calculated using the novel MRI method) and L3 skeletal muscle infiltration (on standard cross-sectional imaging) correlated with the 6MWT, demonstrating that myosteatosis could contribute to the frailty phenotype in cirrhosis.
Though the AMRA® MAsS Scan has been studied in large adult populations[28] and those with diabetes mellitus [29], cardiovascular disease [30] and NAFLD[14], this is the first study to demonstrate that the MRI protocol and automated image analysis technique is feasible in patients with ESLD. The imaging protocol did not result in any adverse events and was completed in less than 15 min on average. Moreover, the majority of the cohort in this study was decompensated, suggesting that the AMRA® MAsS Scan can be performed safely and efficiently in patients with more severe liver disease and complications such as hepatic encephalopathy and ascites. Though standard costs of MR imaging apply, AMRA® MAsS Scan presents the potential of reducing total costs by minimizing time in the scanner (< 15 min per scan in this study) and the costs associated with radiologists manually analyzing body composition metrics.
Our finding that muscle composition, rather than muscle mass or volume alone, is associated with select markers of frailty is consistent with data on the general population. In a prospective study of 10,019 participants (ages 40–69) in the UK Biobank, thigh fat free muscle volume measured using the same body composition analysis methods as in the present study correlated with various measures of functional status, including hand grip strength, the ability to climb stairs and walking pace. Muscle fat infiltration, on the other hand, inversely correlated with these frailty measures and was also predictive of falls [28].
Our findings are significant as they are specific to patients evaluated for LT and shed further light on the relationship between sarcopenia and frailty in ESLD. Both sarcopenia and frailty are highly prevalent complications of cirrhosis and are independently associated with poor outcomes before and after liver transplantation (LT) [3,10–12,31–35]. However, despite being recognized as two interrelated constructs with shared pathophysiologic mechanisms, the exact relationship between these complications in ESLD remains unclear, partly due to a scarcity of studies that measure both complications in the same cohort.
The studies that have measured sarcopenia and frailty simultaneously reveal that skeletal muscle mass and physical function correlate poorly, suggesting that current measures of these constructs could capture different risk factors. For example, Dang et al. [36] studied the association between L3-SMI measured on CT scan and the 6MWT in 180 LT candidates, only finding a weak correlation (r = 0.02) between the two. Yadav et al. [37] studied the association between L3-SMI and 6MWT in waitlisted patients specifically and again found a poor correlation (r = 0.19). Sinclair et al. used a different measure of frailty (i.e., handgrip strength, a component of the LFI) and also found minimal association between L3-SMI and functional status (tau, 0.24) [38].
It is possible that the poor correlation between L3-SMI and frailty stems from the fact that L3-SMI is not adjusted based on the subject's overall body size. However, our finding that thigh muscle fat infiltration (adjusted for sex and body size) and L3 skeletal muscle infiltration correlated with the 6MWT demonstrates the significant impact of muscle quality on muscle function and downstream functional status. Moreover, it suggests that the previously documented weak correlation between sarcopenia and frailty likely stems from previous studies’ quantification of skeletal muscle mass alone rather than mass and skeletal muscle quality simultaneously. Muscle quality, defined as the ratio between muscle strength and muscle mass [39], is significantly impacted by muscle composition, most notably myosteatosis. While the standard of reference for myosteatosis is muscle biopsy, CT assessment of skeletal muscle radiodensity has become the most common modality to measure intramuscular and intermuscular fat deposition [40,41]. Using this method, myosteatosis was found to be a strong predictor of mortality as well as hepatic encephalopathy in patients with ESLD [42,43]. Myosteatosis has also been shown to impact LT outcomes (both waitlist and post-LT mortality) [44–46] and healthcare utilization due to its association with longer lengths of hospitalization, intensive care unit admissions, and higher rates of complications after LT [46,47]. Currently, measurement of myosteatosis lacks standardization. However, utilization of MRI through a specialized protocol increases the accuracy of myosteatosis quantification and is expected to become the standard of reference, similar to the non-invasive assessment of liver steatosis.
The innovative AMRA® MAsS Scan image analysis technique employed in this study could enable more precise quantification of myosteatosis. In NAFLD, the phenotype characterized by a high thigh MFI and low thigh MVI was found to be associated with worse GST performance and a higher probability of falls [14]. In a large retrospective study using the UK Biobank [18], adverse muscle composition from thigh MFI and MVI was found to be a strong and independent predictor of all-cause mortality. A recent study by Ebadi et al. [16] also demonstrated that low muscle mass and high intramuscular fat in patients with cirrhosis was strongly predictive of pre-transplant mortality after adjusting for MELD score, refractory ascites, variceal bleeding and hepatic encephalopathy. Our study, however, is novel as we investigated the relationship between adverse muscle composition and clinical outcomes further, comparing thigh MFI and MVI to other well-studied markers of sarcopenia, body composition and frailty. In doing so, we demonstrated that myosteatosis is associated with the 6MWT, the most widely used metric to assess LT candidates´ functional status in the US.
It is also noteworthy that the novel imaging protocol utilized in this pilot study focuses on thigh muscle rather than truncal muscles as previously investigated in studies on sarcopenia in ESLD. Current data demonstrate that L3-SMI (truncal muscle) does not consistently improve with home-based exercise regimens [48] despite improvements in strength and cardiorespiratory fitness (i.e., 6MWT). Thigh muscle cross-sectional area, however, has been shown to increase following exercise in ESLD [49]. By specifically evaluating thigh muscle, which is closely tied to functional assessments such as peak oxygen consumption from cardiopulmonary exercise testing, GST and the 6MWT, it is possible that we can further evaluate the link between sarcopenia and current measures of frailty. In this context, the associations that we identified between thigh muscle fat infiltration and 6MWT are significant since these two metrics could be valuable complementary endpoints in exercise clinical trials in ESLD. It is likely that muscle quality needs to improve (i.e., elimination of fatty infiltration) before quantity and functionality of skeletal muscle increases. This suggests that future exercise clinical trials designed to elucidate the dynamic changes in muscle with physical activity should use thigh muscle imaging rather than truncal muscle imaging as the ideal anatomic endpoint, with an emphasis on both muscle volume and muscle quality (i.e., thigh MFI and MVI).
Finally, the association between adverse muscle composition and a recent large volume paracentesis is expected in the setting of severe portal hypertension. Individuals requiring frequent large volume paracenteses for refractory ascites are more likely to have more advanced ESLD and associated sequelae, including progressive muscle wasting. Large volume paracenteses lead to significant protein loss in ascitic fluid, which further exacerbates each patient's nutritional status. Moreover, the presence of significant ascites can cause gut edema, which decreases gut absorption of critical nutrients[1]. Our finding that patients undergoing a recent large volume paracentesis have increased thigh fat infiltration further also suggests a link between sarcopenia and myosteatosis, which needs to be explored further.
Our study has some limitations. Most notably, the sample size was small. However, it was appropriate as this was a feasibility study on a novel MRI technique and automated image analysis technique in patients with ESLD. Furthermore, the moderate and strong associations that we found had a power above 95 %. It is also important to note that the normal reference values for adverse muscle composition in this study were based on a largely Caucasian reference population [14,18]. Ethnicity may influence body composition [51] and must be considered when interpreting results from the AMRA® MAsS Scan, similar to other clinical assessments. Future versions of the AMRA® MAsS Scan may consider ethnicity in body composition analysis, but that will require studies on larger reference populations around the world. Lastly, we did not follow-up patients to see if myosteatosis was associated with functional decline. Future studies with a larger sample size will be needed to demonstrate if myosteatosis (either thigh MFI or L3-SMFI) or the adverse muscle composition phenotype can be utilized to identify patients who are more prone to rapid functional deterioration. Moreover, future prospective studies are necessary to determine if a decrease in myosteatosis leads to downstream improvement in frailty. If proven to do so, clinicians could use novel imaging protocols to identify and engage patients in aggressive exercise and nutritional interventions in a timely manner.
5ConclusionsDespite these limitations, our pilot study demonstrates that a novel MRI technique is feasible in patients with end-stage liver disease and those patients identified as having adverse muscle composition performed significantly worse on the 6MWT, a validated measure of overall frailty [27]. In doing so, this study demonstrates that myosteatosis likely contributes to the frailty phenotype in cirrhosis and must be investigated further to elucidate this relationship and optimize future exercise clinical trials. Furthermore, once validated in a larger cohort of patients with ESLD, the AMRA® MAsS Scan has the potential to be feasibly employed in clinical practice, specifically impacting liver transplantation evaluation. By identifying patients with adverse muscle composition, LT candidates could theoretically be enrolled in aggressive nutritional and exercise interventions to optimize physical fitness prior to liver transplantation, therefore improving waitlist and post-LT outcomes.
Author contributionsAvesh J. Thuluvath: Formal analysis, Writing – original draft.
Mikael F. Forsgren: Conceptualization, Writing – original draft.
Daniela P. Ladner: Writing – original draft.
Amit D. Tevar: Data curation, Formal analysis, Writing – original draft.
Andres Duarte-Rojo: Conceptualization, Data curation, Formal analysis, Writing – original draft.
AT – NIH T32 Training Grant (T32DK077662).


