


We assessed FibroMeter virus (FMvirus) and FibroMeter vibration-controlled transient elastography (FMVCTE) in 134 patients with autoimmune liver diseases [ALD, autoimmune hepatitis (AIH) and primary biliary cholangitis (PBC)], in order to assess new potential non-invasive biomarkers of liver fibrosis in patients with ALD, as similar data are missing.
Patients and MethodsThe following groups were included: group 1: n = 78 AIH; group 2: n = 56 PBC. FMvirus and FMVCTE were determined in all 134 patients who underwent liver biopsy and TE the same day with sera collection. In addition, APRI and FIB-4 scores were calculated.
ResultsThe AUCs for TE and FMVCTE were significantly better (0.809; p < 0.001 and 0.772; p = 0.001, respectively for AIH and 0.997; p < 0.001 and 1; p < 0.001, for PBC) than the other three markers in predicting ≥ F3 fibrosis irrespective of the biochemical activity. FMVCTE and TE had good diagnostic accuracy (75.6% and 73%, respectively) for predicting severe fibrosis in AIH and performed even better in PBC (94.6% and 96.4%, respectively). The cut-offs of TE and FMVCTE had the best sensitivity and specificity in predicting ≥ F3 fibrosis in both AIH and PBC.
ConclusionsFMVCTE seems to detect severe fibrosis equally to TE in patients with ALD but with better specificity. Biochemical disease activity did not seem to affect their diagnostic accuracy in ALD and therefore, could be helpful for the assessment of fibrosis, especially if they are performed sequentially (first TE with the best sensitivity and then FMVCTE with the best specificity).
Liver biopsy remains the “gold standard” for the assessment of liver fibrosis [1]. However, there are always potential complications of an invasive procedure and pathological considerations concerning sampling error and/or inadequate biopsy specimens [1,2]. Therefore, non-invasive methods are being increasingly used for the assessment of liver fibrosis in chronic liver diseases [3–5].
Transient elastography (TE) has been proposed as a surrogate marker of fibrosis with high accuracy to identify cirrhosis especially in patients with chronic viral hepatitis B and C [6,7]. However, it is less reliable in ruling out moderate fibrosis. In addition, TE has been validated in patients with primary biliary cholangitis (PBC) and primary sclerosing cholangitis [8–10]. Recently, TE proved also a marker with reliable accuracy and reproducibility in patients with autoimmune hepatitis (AIH) [11,12]. Indeed, changes in liver stiffness measurements (LSM) have been strongly linked with disease progression and outcome of PBC and AIH patients [8,10,13]. Furthermore, in a recent meta-analysis, TE proved a promising method for the non-invasive staging of liver fibrosis in patients with non-alcoholic fatty liver disease (NAFLD), especially in detecting those with advanced fibrosis and cirrhosis [14].
Similarly, serum fibrosis biomarkers such as, the aspartate aminotransferase (AST) to platelet ratio index (APRI) and fibrosis-4 (FIB-4) score have been used for the evaluation of liver fibrosis in patients with chronic hepatitis B or C and NAFLD, with various reported sensitivities and specificities [15–18]. More recently, FibroMeter (FM) scores, were developed and validated for the detection of fibrosis stage in patients with chronic hepatitis B or C and NAFLD [19,20]. These scores, apart from serum parameters, include clinical data of patients (age and gender), which makes the estimation of fibrosis stage more individualized.
Finally, the FM vibration-controlled TE (FMVCTE) test combines the LSM with FM values and it was first developed for the evaluation of fibrosis in patients with chronic hepatitis C. However, recent studies indicate also its potential superiority compared to either NAFLD fibrosis score or TE for the detection of severe fibrosis in patients with NAFLD [21–23].
Accordingly, we investigated for the first time, the performance of FMvirus and FMVCTE as potential non-invasive biomarkers of liver fibrosis in patients with autoimmune liver diseases because similar data on this issue is missing. Data were compared apart to liver histology with other well validated methods of the estimation of fibrosis stage, namely TE, APRI and FIB-4 scores.
2Material and methods2.1PatientsConsecutive patients with well-established autoimmune liver diseases (n = 134; 78 AIH, 56 PBC), who consented to undergo liver biopsy between 10/2009 and 12/2016 were included in the study. The same day with liver biopsy, TE (Fibroscan® 502, ECHOSENS, France) was performed blindly by two experienced hepatologists (K.Z. and N.G.) along with fasting serum sampling. The diagnosis of AIH and PBC was based on the respective well-established criteria [24,25].
Serum samples were stored at −80 °C until determination of FM parameters, while hematologic and biochemical determinations were also performed at the same day with liver biopsy. Liver histology was evaluated by an experienced hepatopathologist (GKK) who was unaware of the diagnosis of the patients as well as the TE, APRI, and FIB-4 results. Patients with any of the following were excluded from the study: active malignancy, overlapping chronic or acute liver disease (i.e. AIH/PBC variant, coexistence of chronic viral hepatitis with autoimmune liver diseases, etc.), presence of ascites, body mass index ≥40 kg/m2, pregnancy, or any implantable cardiac device.
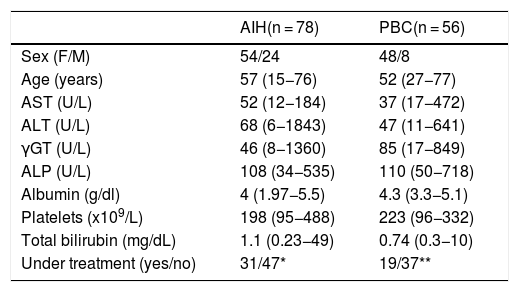
The characteristics of patients at the time of FM determination are shown in Table 1. All subjects provided written informed consent to participate in the study at the time of interview. The ethical committee of the General University Hospital of Larissa approved the study protocol which conforms to the ethical guidelines of the 1975 Declaration of Helsinki as revised in Brazil in 2013, as reflected in a priori approval by the institution's human research committee (2258/21-3-2016).
Characteristics of patients with autoimmune liver diseases.
| AIH(n = 78) | PBC(n = 56) | |
|---|---|---|
| Sex (F/M) | 54/24 | 48/8 |
| Age (years) | 57 (15−76) | 52 (27−77) |
| AST (U/L) | 52 (12−184) | 37 (17−472) |
| ALT (U/L) | 68 (6−1843) | 47 (11−641) |
| γGT (U/L) | 46 (8−1360) | 85 (17−849) |
| ALP (U/L) | 108 (34−535) | 110 (50−718) |
| Albumin (g/dl) | 4 (1.97−5.5) | 4.3 (3.3−5.1) |
| Platelets (x109/L) | 198 (95−488) | 223 (96−332) |
| Total bilirubin (mg/dL) | 1.1 (0.23−49) | 0.74 (0.3−10) |
| Under treatment (yes/no) | 31/47* | 19/37** |
Abbreviations are same as in the text. Results are expressed as median (range). F/M: female/male; NA: not applicable. *Duration of therapy for the 31 patients under treatment 63 (49–235) months. **Duration of therapy for the 19 patients under treatment 3 (1–6) months.
FMvirus (Echosens, Paris, France) was calculated according to a patented formula which includes age, sex, platelets (PLT), alpha-2-macroglobulin, alanine aminotransferase (ALT), urea, prothrombin index (PI), γ-glutamyl-transferase (γ-GT), and AST. FMVCTE was calculated by a patented formula including age, sex, PLT, PI, AST, alpha-2-macroglobulin, γ-GT and LSM.
As we described previously, LSMs were performed using FibroScan device powered by VCTE (Echosens) equipped with the standard M probe [26,27]. LSM results were expressed as median (kPa) of all valid measurements with associated IQR and success rate. LSM was considered valid if there were 10 successful acquisitions with IQR/LSM <0.3 [26,27]. APRI and FIB-4 were calculated in all patients according to the published formulas [15–18]. Necroinflammatory activity and fibrosis stage were assessed using the Metavir score [28].
2.3Statistical analysisThe SPSS 24 statistics software was used. Results are expressed as mean ± SD or as median (range). Data were analyzed by t-test, Mann-Whitney U, x2, Fisher’s exact test, Spearman’s correlation coefficient (r) and linear regression analysis.
The ROC curve was used for the estimation of the Area Under the Curve (AUC) sensitivity and specificity. The DeLong test using the Med Calc Software was used for the comparison between the AUCs. In addition, the Youden’s index was used for selecting the optimum cut-off point of the AUCs.
A two-sided t-test value of p < 0.05 was considered as statistically significant. 95% confidence intervals (CI) were calculated by the Wilson procedure with a correction for continuity.
3Results3.1Group 1 (AIH patients)According to the histology 47/78 (60%; 95%CI:48−71) patients had F1, 16/78 (20.5%; 95%CI:13−30) F2, 9/78 (11.5%; 95%CI:6−20) F3 and 6/78 (7.7%; 95%CI:3.5–15.8) F4 (Table 2). Forty-seven patients were assessed at diagnosis before starting treatment and 31 were under immunosuppression for 63 (49–235) months (Table 1). Eleven out of 47 patients at diagnosis (23%) had an acute disease onset [transaminases>10x upper limit of normal (ULN); AST: 568 (239–1184) U/L, ALT: 676 (464–1843) U/L]. In addition, 26/31 (84%) patients under treatment had complete biochemical response (normal AST, ALT and IgG levels) while 21/26 had also complete histological response (no or minimal histological activity).
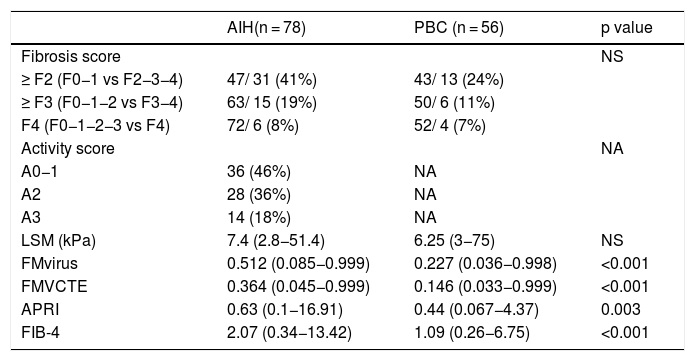
Histological findings (according to the Metavir score) and median values of LSM, FMvirus, FMVCTE, APRI and FIB-4 score in patients with autoimmune liver diseases.
| AIH(n = 78) | PBC (n = 56) | p value | |
|---|---|---|---|
| Fibrosis score | NS | ||
| ≥ F2 (F0−1 vs F2−3−4) | 47/ 31 (41%) | 43/ 13 (24%) | |
| ≥ F3 (F0−1−2 vs F3−4) | 63/ 15 (19%) | 50/ 6 (11%) | |
| F4 (F0−1−2−3 vs F4) | 72/ 6 (8%) | 52/ 4 (7%) | |
| Activity score | NA | ||
| A0−1 | 36 (46%) | NA | |
| A2 | 28 (36%) | NA | |
| A3 | 14 (18%) | NA | |
| LSM (kPa) | 7.4 (2.8−51.4) | 6.25 (3−75) | NS |
| FMvirus | 0.512 (0.085−0.999) | 0.227 (0.036−0.998) | <0.001 |
| FMVCTE | 0.364 (0.045−0.999) | 0.146 (0.033−0.999) | <0.001 |
| APRI | 0.63 (0.1−16.91) | 0.44 (0.067−4.37) | 0.003 |
| FIB-4 | 2.07 (0.34−13.42) | 1.09 (0.26−6.75) | <0.001 |
Abbreviations are the same as in the text. Results are expressed as median (range). NA: not applicable. LSM: liver stiffness measurements; FMvirus: FibroMeter virus; FMVCTE: FibroMeter vibration-controlled transient elastography; APRI: AST to Platelet Ratio Index; FIB-4: Fibrosis-4 score.
The histological activity score, the LSM, FMvirus and FMVCTE values, and the APRI and FIB-4 scores are also shown in Table 2.
Only LSM, FMVCTE and APRI determinations were significantly correlated with the histological staging (r = 0.508, p < 0.001; r = 0.353, p = 0.002; r = 0.250, p = 0.027, respectively). The ROC curves for LSM and FMVCTE were significantly better than chance in predicting ≥ F3 (AUC 0.809; p < 0.001 and AUC 0.772; p = 0.001, respectively), but not those for the FMvirus, APRI and FIB-4 (Fig. 1a).
![a) ROC curves for LSM, FMvirus, FMVCTE, APRI and FIB-4 in predicting severe fibrosis (F3-F4) in patients with AIH (group 1). b) According to Youden’s index, the threshold of LSM for the prediction of ≥ F3 was >9 kPa [sensitivity 80% (95%CI:52-95.7), specificity 73% (95%CI:60.3-83.4)]. c) According to Youden’s index, the threshold of FMVCTE for the prediction of ≥ F3 was >0.647 [sensitivity 66.67% (95%CI:38.4-88.2), specificity 79.37% (95%CI:67.3-87.5)]. LSM: liver stiffness measurements; FMvirus: FibroMeter virus; FMVCTE: FibroMeter vibration-controlled transient elastography; APRI: AST to Platelet Ratio Index; FIB-4: Fibrosis-4 score; AIH: autoimmune hepatitis.](https://static.elsevier.es/multimedia/16652681/000000220000000C/v3_202107300613/S1665268120302106/v3_202107300613/en/main.assets/gr1.jpeg?xkr=ue/ImdikoIMrsJoerZ+w997EogCnBdOOD93cPFbanNeKOJqKH5+Za6P+RA5Vq9DlTfIOiOhArj3X1I5/RpLplQDJwuzfjxzreTSywAM0xYm7sWHR3lQiv1tjKr7Bb0AigQPlqC5ghuIe1onq+xBkIUm22N6Rw/VxLKCRor+JOHFxCKQi//JF6D+omB4LWf4g1sq5q7QalWjXMPlaeE0XwIs8pKC6IPWvsfPBbMEpKfOBzSPA1erClcISKmeHDJll7uX/aAjuGbgFSBbAFu/cc7JPOv8WqAZn8UNafumyaeI= "a) ROC curves for LSM, FMvirus, FMVCTE, APRI and FIB-4 in predicting severe fibrosis (F3-F4) in patients with AIH (group 1). b) According to Youden’s index, the threshold of LSM for the prediction of ≥ F3 was >9 kPa [sensitivity 80% (95%CI:52-95.7), specificity 73% (95%CI:60.3-83.4)]. c) According to Youden’s index, the threshold of FMVCTE for the prediction of ≥ F3 was >0.647 [sensitivity 66.67% (95%CI:38.4-88.2), specificity 79.37% (95%CI:67.3-87.5)]. LSM: liver stiffness measurements; FMvirus: FibroMeter virus; FMVCTE: FibroMeter vibration-controlled transient elastography; APRI: AST to Platelet Ratio Index; FIB-4: Fibrosis-4 score; AIH: autoimmune hepatitis.")
a) ROC curves for LSM, FMvirus, FMVCTE, APRI and FIB-4 in predicting severe fibrosis (F3-F4) in patients with AIH (group 1). b) According to Youden’s index, the threshold of LSM for the prediction of ≥ F3 was >9 kPa [sensitivity 80% (95%CI:52-95.7), specificity 73% (95%CI:60.3-83.4)]. c) According to Youden’s index, the threshold of FMVCTE for the prediction of ≥ F3 was >0.647 [sensitivity 66.67% (95%CI:38.4-88.2), specificity 79.37% (95%CI:67.3-87.5)].
LSM: liver stiffness measurements; FMvirus: FibroMeter virus; FMVCTE: FibroMeter vibration-controlled transient elastography; APRI: AST to Platelet Ratio Index; FIB-4: Fibrosis-4 score; AIH: autoimmune hepatitis.
In order to assess whether LSM and FMVCTE performed the same in patients at diagnosis and under treatment, we divided the patients according to treatment status: at baseline (n = 47, group 1a) and under treatment (n = 31, group 1b). In group 1a, LSM and FMVCTE performed better than chance and equally well in predicting ≥ F3 fibrosis (AUC 0.782 and AUC 0.726, respectively). The same was true for group 1b for both LSM and FMVCTE in predicting ≥ F3 fibrosis (AUC 0.845 and AUC 0.881, respectively).
When the published cut-off of LSM in AIH for detecting ≥ F3 fibrosis was taken into account (>10.5 kPa) [11], the sensitivity and specificity in our cohort was 46.7% (95%CI:21.3–73.4) and 77.8% (95%CI:65.5–87.3), respectively. However, according to the Youden’s index, the threshold of LSM for ≥ F3 prediction was >9 kPa [sensitivity: 80% (95%CI:52−95.7), specificity: 73% (95%CI:60.3–83.4)] (Fig. 1b), having PPV: 40%, NPV: 93.7% and diagnostic accuracy: 73%. A FMVCTE > 0.647 had better specificity [79.4% (95%CI:67.3–87.5)] but worse sensitivity [66.67% (95%CI:38.4–88.2)] (Fig. 1c) in predicting ≥ F3, with PPV: 41.6%, NPV: 90.7% and diagnostic accuracy: 75.6%. When published cut-offs of FMVCTE for ≥ F3 fibrosis (>0.715) [29] were taken into account, the sensitivity was much lower (46.7%; 95%CI:21.3–73.4) and the specificity slightly better (81%; 95%CI:69−89.75).
According to the Youden’s index, the threshold of LSM for predicting F ≥ 2 fibrosis (AUC 0.776; p < 0.001) was >5.9 kPa [sensitivity: 90.6 (95%CI:75−98); specificity: 61% (95%CI:45−75)]. This threshold was very close to the published cut-off [11] of LSM for F ≥ 2 fibrosis having the same sensitivity and specificity with the previous publication [11]. The threshold of FMVCTE for ≥ F2 fibrosis (AUC 0.673; p = 0.007) was >0.382 [sensitivity: 68.7% (95%CI:50−84); specificity: 69.6% (95%CI:54−82)], which was very close to and had the same sensitivity and specificity with the published cut-off (>0.384) [29].
LSM and FMVCTE values were both correlated with AST, ALT, γ-GT, IgG (p < 0.05 for all comparisons; data not shown) and the histological grading (r = 0.377; p = 0.001 and r = 0.327; p = 0.003, respectively) and were associated with the administration or not of immunosuppression (p < 0.001 and p = 0.006, respectively). However, when the abovementioned variables entered the linear regression analysis model together with the histological staging, the independent predictors of LSM and FMVCTE were the AST (p < 0.0001 and p = 0.009, respectively) and the histological staging (p < 0.0001 and p = 0.013, respectively).
Furthermore, when only patients with AST and/or ALT <3xULN were included in the analysis (n = 49), the AUCs for LSM and FMVCTE were 0.847 and 0.79 (p < 0.001 and p = 0.0003, respectively), which did not differ from the respective AUCs of the whole group of AIH patients. Therefore, the exclusion of AIH patients with high AST and/or ALT levels did not seem to affect the diagnostic accuracy of the two tests (LSM and FMVCTE).
3.2Group 2 (PBC patients)According to the histology 14/56 (25%; 95%CI:15−38) patients had F0, 29/56 (52%; 95%CI:38−65) F1, 7/56 (12.5%; 95%CI:5−24) F2, 2/56 (3.5%; 95%CI:0.6–13) F3 and 4/56 (7%; 95%CI:2−18) F4 (Table 2). Thirty-seven patients (66%) were assessed at diagnosis before treatment initiation having alkaline phosphatase (ALP) above the ULN (ULN: 120 U/L), while 19 PBC patients were receiving ursodeoxycholic acid for 3 (1–6) months. Seven out of 19 patients under treatment (36.8%) had normal ALP at the time of sampling. The histological activity score, the LSM, FMvirus and FMVCTE values, and the APRI and FIB-4 scores are also shown in Table 2.
Contrary to APRI, the LSM, FMvirus, FMVCTE and FIB-4 measurements were significantly correlated with the histological staging (r = 0.575, p < 0.001; r = 0.264, p = 0.049; r = 0.643, p < 0.001; r = 0.389, p = 0.003, respectively).
The ROC curves for all markers were significantly better than chance in predicting ≥ F3 fibrosis (LSM: AUC 0.997, p < 0.001; FMvirus: AUC 0.867, p = 0.004; FMVCTE: AUC 1, p < 0.001; APRI: AUC 0.777, p = 0.028; FIB-4: AUC 0.837, p = 0.007) (Fig. 2a). The AUCs for LSM and FMVCTE performed equally and were significantly better than those for FMvirus, APRI and FIB-4 (p < 0.05 for all comparisons), while the in between AUCs for FMvirus, APRI and FIB-4 did not differ.
![a) ROC curves for LSM, FMvirus, FMVCTE, APRI and FIB-4 in predicting significant fibrosis (F3-F4), in patients with PBC (group 2). b) According to Youden’s index, the threshold of LSM for the prediction of F3-F4 was >11.9 kPa [sensitivity 100% (95%CI:54-100), specificity 96% (95%CI:86.3-99.9)]. c) According to Youden’s index, the threshold of FMVCTE for the prediction of F3-F4 was >0.656 [sensitivity 100% (95%CI:54-100), specificity 94% (95%CI:83.5-98.75)]. LSM: liver stiffness measurements; FMvirus: FibroMeter virus; FMVCTE: FibroMeter vibration-controlled transient elastography; APRI: AST to Platelet Ratio Index; FIB-4: Fibrosis-4 score; PBC: Primary biliary cholangitis.](https://static.elsevier.es/multimedia/16652681/000000220000000C/v3_202107300613/S1665268120302106/v3_202107300613/en/main.assets/gr2.jpeg?xkr=ue/ImdikoIMrsJoerZ+w997EogCnBdOOD93cPFbanNeKOJqKH5+Za6P+RA5Vq9DlTfIOiOhArj3X1I5/RpLplQDJwuzfjxzreTSywAM0xYm7sWHR3lQiv1tjKr7Bb0AigQPlqC5ghuIe1onq+xBkIUm22N6Rw/VxLKCRor+JOHFxCKQi//JF6D+omB4LWf4g1sq5q7QalWjXMPlaeE0XwIs8pKC6IPWvsfPBbMEpKfOBzSPA1erClcISKmeHDJll7uX/aAjuGbgFSBbAFu/cc7JPOv8WqAZn8UNafumyaeI= "a) ROC curves for LSM, FMvirus, FMVCTE, APRI and FIB-4 in predicting significant fibrosis (F3-F4), in patients with PBC (group 2). b) According to Youden’s index, the threshold of LSM for the prediction of F3-F4 was >11.9 kPa [sensitivity 100% (95%CI:54-100), specificity 96% (95%CI:86.3-99.9)]. c) According to Youden’s index, the threshold of FMVCTE for the prediction of F3-F4 was >0.656 [sensitivity 100% (95%CI:54-100), specificity 94% (95%CI:83.5-98.75)]. LSM: liver stiffness measurements; FMvirus: FibroMeter virus; FMVCTE: FibroMeter vibration-controlled transient elastography; APRI: AST to Platelet Ratio Index; FIB-4: Fibrosis-4 score; PBC: Primary biliary cholangitis.")
a) ROC curves for LSM, FMvirus, FMVCTE, APRI and FIB-4 in predicting significant fibrosis (F3-F4), in patients with PBC (group 2). b) According to Youden’s index, the threshold of LSM for the prediction of F3-F4 was >11.9 kPa [sensitivity 100% (95%CI:54-100), specificity 96% (95%CI:86.3-99.9)]. c) According to Youden’s index, the threshold of FMVCTE for the prediction of F3-F4 was >0.656 [sensitivity 100% (95%CI:54-100), specificity 94% (95%CI:83.5-98.75)].
LSM: liver stiffness measurements; FMvirus: FibroMeter virus; FMVCTE: FibroMeter vibration-controlled transient elastography; APRI: AST to Platelet Ratio Index; FIB-4: Fibrosis-4 score; PBC: Primary biliary cholangitis.
As in AIH patients, patients with PBC were divided in two groups according to treatment: patients at diagnosis (group 2a; n = 37) and patients under ursodeoxycholic acid (group 2b; n = 19). In group 2a, the LSM and FMVCTE measurements performed better than chance in predicting ≥ F3 fibrosis with AUC 1 for both. In group 2b, LSM with AUC 1 perform equally well to FMVCTE (AUC 0.867) in predicting ≥ F3 fibrosis.
When the published cut-off of LSM for ≥ F3 fibrosis in PBC (>9.8 kPa) [9] was taken into account, the sensitivity and specificity were 100% (95%CI:54−100) and 88% (95%CI:75.7–97.5). According to Youden’s index, the threshold >11.9 kPa of LSM for the prediction of ≥ F3 had even higher specificity and diagnostic accuracy [sensitivity [100% (95%CI:54−100), specificity 96% (95 %CI:86.3–99.9), PPV 75%, NPV 100%, diagnostic accuracy 96.43%; Fig. 2b].
When the published cut-off of FMVCTE for ≥ F3 fibrosis was taken into account (>0.715) [29], the sensitivity and specificity were perfect; 100% (95%CI:54−100) and 100% (95%CI:93−100). However, according to Youden’s index, in our cohort the best cut-off for FMVCTE was >0.656, which had sensitivity 100% (95%CI:54−100) and specificity 94% (95%CI:83.5–98.75), PPV: 66.7%, NPV: 100% and diagnostic accuracy: 94.6% (Fig. 2c) for predicting ≥ F3 fibrosis. Accordingly, FMvirus >0.301 had sensitivity 100% (95%CI:54−100) and specificity 66% (95%CI:51−79), in contrast to the published cut-off >0.61 [30] which showed lower sensitivity but very good specificity [sensitivity 50% (95%CI:11.8–88), specificity 92% (95%CI:80.7–97.8)]. FIB-4 > 1.97 had sensitivity 83% (95%CI:36−99) and specificity 88% (95%CI:76−95) when the published cut-off >1.45 [31] had 88.3% (95%CI:36−99) and 70% (95%CI:55−82), respectively.
The AUCs for predicting fibrosis ≥ F2 were not better than chance for all 5 markers (LSM: AUC 0.411, FMVCTE: AUC 0.431, FMvirus: AUC 0.392, APRI: 0.394, FIB-4: AUC 0.431).
LSM was positively correlated with AST, ALP and bilirubin and negatively with albumin; FMVCTE was positively correlated with AST, ALT, ALP, bilirubin and negatively with albumin and PLT while FMvirus was positively correlated with AST, ALT, γ-GT, bilirubin and negatively with PLT (p < 0.05 for all comparisons; data not shown). However, linear regression analysis, which included the abovementioned parameters together with the histological staging, showed that only bilirubin and histological staging independently predicted LSM (p < 0.001 for each), while albumin, PLT and histological staging were independent predictors of FMVCTE (p < 0.05 for each). On the contrary, histological staging could not independently predict FMvirus, while independent predictors were AST, γ-GT and PLT (p < 0.05 for each).
4DiscussionIn the present study, we investigated the diagnostic accuracy of two non-invasive markers of liver fibrosis, FMvirus and FMVCTE, in patients with AIH and PBC, who underwent liver biopsy at the same day, since data on non-invasive fibrosis markers in these groups of patients are very limited. In addition, we validated the published cut-offs in our population. Histology was used as the gold standard, while other well validated fibrosis markers such as TE, APRI and FIB-4 were also included in the analysis.
We showed that a) FMVCTE together with LSM had the best diagnostic accuracy compared to all the other non-invasive markers in predicting severe fibrosis in patients with autoimmune liver diseases b) FMVCTE and LSM had good diagnostic accuracy (75.6% and 73%, respectively) for predicting severe fibrosis in AIH patients and performed even better in PBC patients (diagnostic accuracy of FMVCTE 94.6% and LSM 96.4%) c) LSM had better sensitivity while FMVCTE had better specificity in predicting ≥ F3 fibrosis in both AIH and PBC and d) in patients with autoimmune liver diseases, the stronger independent predictor of LSM and FMVCTE measurements was the histological stage, underscoring the impact of histological and biochemical activity.
FMvirus and FMVCTE have been designed as two non-invasive markers for the evaluation of liver fibrosis in patients with chronic viral hepatitis [19–21] but recent studies have also supported their usefulness in patients with NAFLD [20,22,23].
To the best of our knowledge this is the first study evaluating the efficacy of FM scores in patients with autoimmune liver diseases. In AIH patients, the data on non-invasive markers of liver fibrosis are scarce as liver biopsy is considered essential for establishing the diagnosis [32–34]. However, non-invasive markers could be useful in patients who deny liver biopsy, have increased risk of bleeding or even for better follow-up during immunosuppression. To date, TE is the only validated non-invasive method to assess liver fibrosis in AIH [11–13]. Among the 5 tests used to assess fibrosis in our AIH patients, only LSM, FMVCTE and APRI were associated with the histological staging. However, the AUC of APRI was not better than chance. The threshold of LSM for the prediction of severe fibrosis was >9 kPa (with satisfactory sensitivity and specificity, 80% and 73% respectively). This cut-off for ≥ F3 fibrosis as well as the cut off for ≥ F2 (5.9 kPa) were very close to those published previously [12,13]. However, the cut-off for ≥ F4 was very high (23 kPa) as AIH patients with cirrhosis were few (6/78). FMVCTE > 0.647 proved to have better specificity (79%), but worse sensitivity (66%) for predicting severe fibrosis. For this reason, the combination of the two tests seems reliable in an attempt to detect patients with AIH and severe fibrosis. Interestingly, although both LSM and FMVCTE were associated with biochemical, serological (IgG) and histological markers of disease activity, in the multivariate analysis, the only independent predictors of LSM and FMVCTE values were AST and the histological staging. Furthermore, the exclusion of patients with ALT>3x ULN did not seem to affect the diagnostic accuracy of the two tests. These findings are in agreement with Xu et al. [13], who also found that biochemical activity had no significant effect on fibrosis assessment by TE. However, larger number of patients is needed in order to draw safe conclusions. Till then, TE and FMVCTE measurements must be interpreted with caution in patients with biochemically active disease, especially those with acute hepatitis.
In PBC, liver biopsy is not a prerequisite for its diagnosis and therefore, the search for reliable non-invasive markers of liver fibrosis is urgent for stratification and prognosis [25]. In addition, non-invasive markers might be used for assessing disease progression during follow-up. Apart from APRI, all markers were associated with the histological staging. However, the AUCs of LSM and FMVCTE performed better than the other markers, while cut-offs of >11.9 kPa and >0.656 for LSM and FMVCTE respectively, had excellent diagnostic accuracy (>90%) in detecting severe fibrosis. This is in accordance with previous studies, which found excellent diagnostic accuracy of TE in predicting fibrosis stages in patients with PBC using similar cut-offs [8,9]. The threshold for FMvirus for the prediction of severe fibrosis (>0.3009) had lower diagnostic accuracy than TE and FMVCTE, however, it could be used as an alternative marker with excellent sensitivity when TE is not available. The same applies to FIB-4, which had >80% sensitivity and specificity. As for significant fibrosis, in our cohort, none of the 5 markers could differentiate ≥ F2 fibrosis, which could be attributed to the low number of patients included. Of note, the histological staging was the main independent predictor of LSM and FMVCTE, while FMvirus was not correlated with ALP which is the main biochemical marker of PBC.
In conclusion, LSM and FMVCTE could be used with great diagnostic accuracy in patients with autoimmune liver diseases. However, as TE proved to have better sensitivity and FMVCTE better specificity in patients with AIH, the sequential use of these two tests could be helpful in identifying efficiently AIH patients with severe fibrosis in particular during follow-up where sequential liver biopsies every 6–12 months are very difficult to be performed. Furthermore, regarding FMVCTE, we showed for the first time that this test along with TE can be used with significant accuracy in patients with AIH and PBC, irrespective of the biochemical activity of the diseases. In addition, FMvirus and FIB-4 could also be used for detecting ≥ F3 fibrosis in PBC patients if TE is not available. However, further multicenter studies including also more patients with advanced stages (F3-F4), are needed in order to confirm our findings.
FundingThis research did not receive any specific grant from funding agencies in the public, commercial, or not-for-profit sectors.
Declaration of interestNone.AbbreviationsTE transient elastography primary biliary cholangitis autoimmune hepatitis liver stiffness measurements non-alcoholic fatty liver disease FibroMeter FibroMeter vibration-controlled transient elastography aspartate aminotransferase (AST) to platelet ratio index fibrosis-4 platelets alanine aminotransferase prothrombin index γ-glutamyl-transferase Area Under the Curve confidence intervals upper limit of normal alkaline phosphatase
Authors would like to thank Prof. Efthimia Petinaki and Dr. Sofia Stylopoulou for alpha-2-macroglobulin determinations and Marie Destro, Celine Fournier, Khalide Seddik and Anne Llorca employees of Echosens (Paris, France) for the use of the patented FibroMeter scores. Echosens (Paris, France) provided also the alpha-2-macroglobulin kits for the purpose of the study. However, Echosens was not involved at all regarding the study design, samples collection, analysis, data interpretation, writing of the report or the decision to submit the manuscript for publication.


