


Introduction and aim. Patients with acute on chronic liver failure (ACLF) have abnormal conventional coagulation tests- platelet count and international normalized ratio (INR). Thromboelastography (TEG) is a rapid, point-of-care assay, more comprehensive than platelet count and INR as it assesses for platelet adequacy(number and function), coagulation factors and clot retraction. The aim of the study was to evaluate the TEG parameters in patients with ACLF, chronic liver disease having acute decompensation (AD) and healthy subjects (HC).
Material and methods. TEG parameters were assessed in patients with ACLF and AD within 24 h of admission. Consecutive patients were included in the study over 12 months. Healthy subjects were recruited as controls.
Results. 179 patients were included- 68 ACLF, 53 AD and 58 HC. The mean values of INR in ACLF, AD and HC groups were 2.9 ± 1.4, 1.6 ± 0.4 and 1.1 ± 0.2; P < 0.001. Among TEG parameters - maximum amplitude (MA) was low in ACLF and AD patients as compared with HC (53.8 ± 15, 58.3 ± 13.9 mm and 67.2 ± 12.1 mm, respectively; P < 0.001). Lysis at 30 min (LY30) was high in ACLF patients, as compared to AD and HC (8.6 ± 14.1%, 5.0 ± 9.5% and 4.9 ± 9.8%, respectively; P = 0.060). There were no differences in r time, k time, and alpha angle between groups; normal in >90% patients. There was no difference in TEG parameters between different ACLF grades, whereas CCTs were more deranged with increasing grades of ACLF.
Conclusion. Despite abnormal conventional coagulation tests, TEG parameters in ACLF patients are essentially normal, except reduced maximum amplitude. Future studies are needed to explore the utility of TEG in clinical management of ACLF patients.
Acute on chronic liver failure (ACLF) is a syndrome characterized by acute hepatic failure in patients with an underlying chronic liver disease (CLD).1 It is frequently associated with one or more extra-hepatic organ failures (OFs), namely kidney, brain, circulation and pulmonary.1 ACLF is graded according to prolongation of the INR and number of OFs, and increasing mortality is observed with higher grades.2–4
Patients with both acute and chronic liver disease have abnormal conventional coagulation tests (CCTs) - prothrombin time (PT) / international normalized ratio (INR) and platelet counts, and are classically considered to be in a state of “autoanticoagulation”. Recently, this concept has been challenged- the thrombin generation in patients with liver disease is normal when tested in conditions accounting for the contribution of the anticoagulant pathways.5 Moreover, there is increased risk of thrombosis in patients with CLD.6
Global viscoelastic tests [thromboelastography (TEG) and thromboelastometry (ROTEM)] assess the assembly of a clot in whole blood, providing comprehensive assessment of coagulation cascade and platelet adequacy.7,8 Studies evaluating the TEG parameters in cirrhosis and acute liver failure have demonstrated a state of balanced hemostasis even in the presence of low platelets and prolonged INR.5,9 The aim of the present study was to assess the TEG parameters in patients with ACLF and compare with those in chronic liver disease and acute decompensation and healthy controls.
Material and MethodsIn this prospective study, done between June 2015 and June 2016, we included all patients admitted in the Department of Gastroenterology at the All India Institute of Medical Sciences, New Delhi, India with ACLF as per the CANONIC study criteria.1 Exclusion criteria were: transfusion of blood products within 48 h prior to admission, therapy with anti-platelet drugs/ anticoagulants and history of a primary disease with coagulation disturbance (paroxysmal nocturnal hemoglobinuria, polycythemia, idiopathic thrombocytopenia or hemophilia), pregnancy or post-partum period, and concomitant chronic kidney disease. Age and sex matched healthy controls (HC) and patients of CLD with acute decompensation and no ACLF (AD) were recruited in the comparison groups. The study was approved by the institute ethics committee (IEC/T-203/ 05.05.15) and registered at ClinicalTrial.gov registry (NCT02757170). Informed consent was obtained from patients or from their nearest relatives in cases with altered sensorium.
DefinitionsCLD was diagnosed based on liver biopsy or a combination of conventional endoscopic and imaging criteria. Infection10 and hepatic encephalopathy (HE)11 were defined and graded as per widely accepted criteria. The OFs were assessed as per the CLIF-OF scoring system and CLIF-C ACLF score calculated as described.12 AD was defined as acute development of any of the following-ascites, encephalopathy, gastrointestinal bleeding or bacterial infection. ACLF was defined and graded as per the CANONIC study.1 Healthy controls were defined as volunteers who did not have underlying liver disease. In addition, Model for End Stage Liver Disease (MELD),13 MELD-Na,14 acute physiology and chronic health evaluation (APACHE) II15 scores were calculated at baseline.
Workup for Etiology of Acute Hepatic Insult and Underlying CLDAll patients were evaluated for hepatitis A, B, C and E infection, autoimmune hepatitis, Wilson disease and alcoholism, using standard criteria. The etiologies of CLD and superadded acute hepatic insult were identified using accepted criteria.16,17
Management ProtocolA uniform management protocol was followed for ACLF.2,17 Patients with underlying HBV infection were started on oral antiviral drugs (Entecavir or Tenofovir). Strict abstinence was maintained for patient’s actively consuming alcohol. Patients who developed spontaneous bacterial peritonitis and hepatorenal syndrome were managed as per recommendations. Renal replacement therapy and ventilator support were provided when appropriate. Appropriate treatment for HE was instituted. Blood sugars and electrolytes were maintained with intravenous or oral supplementation as required.
Assessment with conventional coagulation tests, TEG and data collectionWithin 24 h of admission, CCTs and TEG were performed and analyzed in the standard format. In summary, within 4 min of drawing the sample, 360 µL (approx. 6 drops) of blood was pipetted out in a plastic cup of the TEG machine. Sample was processed for 60 min and following parameters were recorded: (1) reaction (r) time: defined as the time between the start of the test and the initial fibrin formation, (2) kinetic (k) time: defined as the time from initial fibrin formation to reach an amplitude of 20 mm, (3) alpha (a) angle: this measures the speed at which fibrin builds up and cross linking takes place, (d) maximum amplitude (MA): measures the ultimate strength of the fibrin clot, (e) lysis at 30 min (LY30): defined as the percentage decline in amplitude at 30 min post MA, this represents the degree of fibrinolysis (0-15%). We compared the values of CCTs and TEG parameters in ACLF, AD and HC groups. In addition, we categorized the values as abnormal according to the values previously described in healthy Indian population.18
Statistical AnalysisThe normally distributed variables were expressed as mean ± standard deviation (SD) and continuous variables with skewed distribution as median (inter-quartile range). Categorical data was presented as frequency and proportions. Comparison of continuous and normally distributed variables between more than two groups was done using one-way Analysis of Variance (ANOVA) with Bonferroni correction for multiple comparison tests. Variables with skewed distribution were compared using the Kruskal-Wallis ANOVA test followed by the Mann-Whitney U test with adjusted P values. The comparison of continuous variables between two groups was done using independent t-test. Categorical variables were analyzed using chi-square test. Kaplan-Meier curves were used to estimate the survival of ACLF patients. P value ≤ 0.05 was considered as statistically significant. Data analysis was done using STATA version 14 (StataCorp, Texas, USA) and Medcalc software (version15.11.4, MedCalc Software, Ostend, Belgium).
ResultsProspectively, 78 patients with ACLF, 53 with AD and 58 HC were enrolled. 68 of the 78 ACLF patients satisfied the inclusion and exclusion criteria (Figure 1). The reasons for exclusion for the remaining 10 were- 6 patients received blood products (fresh frozen plasma and/or platelets) within previous 24 h of admission, 2 had chronic kidney disease and 2 refused consent.
Descriptive characteristics of included patients
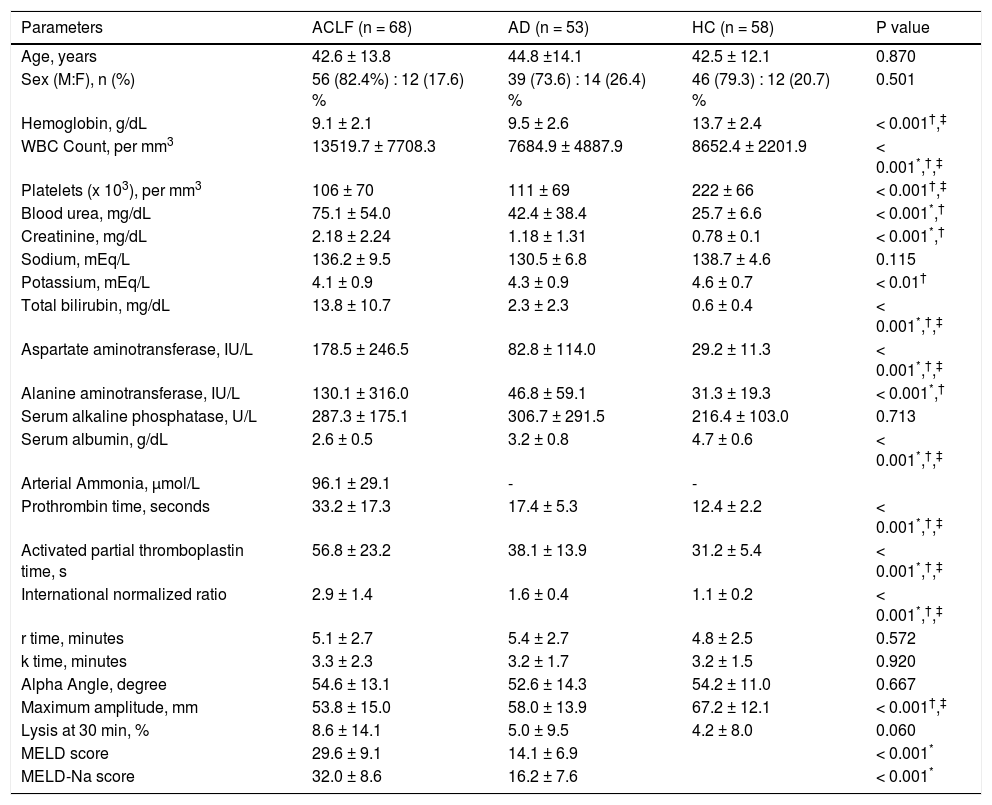
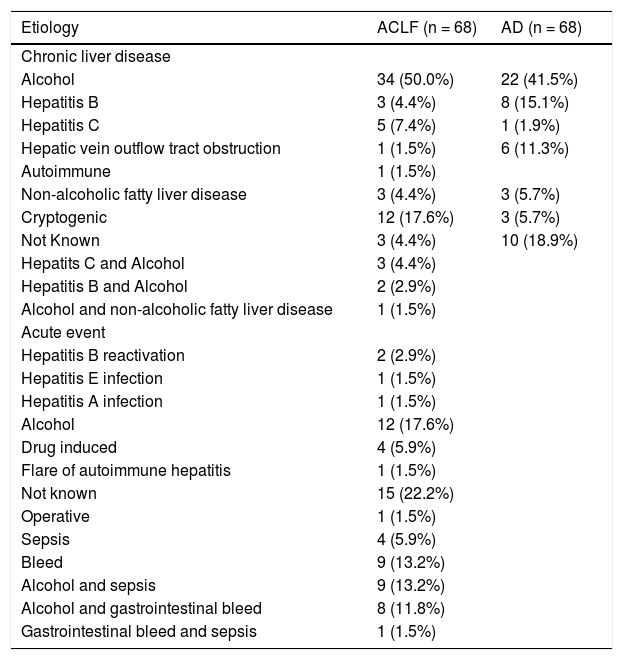
The mean age (±SD) in the ACLF group was 42.6 ± 13.8 years; 56/68 (82.4%) were males. The clinical and laboratory details are provided in table 1. Alcohol consumption was the most common etiological factor in both ACLF (50.0%) and AD (41.5%) (Table 2). The mean serum bilirubin, aspartate aminotransferase and alanine aminotransferase levels were significantly higher in ACLF group as compared with AD and healthy controls. The mean ± sd APACHE II score, MELD score and MELD-Na score in ACLF patients were 19.5 ± 9.3, 29.6 ± 9.1 and 32.0 ± 8.6 respectively. In ACLF patients, various OFs-kidney, circulatory, respiratory, liver, cerebral and coagulation, as per the CLIF criteria, were seen in 36 (52.9%), 23 (33.8%), 20 (29.4%), 37 (54.4%), 32 (47.1%) and 39 (57.4%) cases respectively.
Comparison of demographic, clinical and laboratory characteristics of patients with acute on chronic liver failure (n = 68), acute decompensation (n = 53) and healthy controls (n = 58).
| Parameters | ACLF (n = 68) | AD (n = 53) | HC (n = 58) | P value |
|---|---|---|---|---|
| Age, years | 42.6 ± 13.8 | 44.8 ±14.1 | 42.5 ± 12.1 | 0.870 |
| Sex (M:F), n (%) | 56 (82.4%) : 12 (17.6) % | 39 (73.6) : 14 (26.4) % | 46 (79.3) : 12 (20.7) % | 0.501 |
| Hemoglobin, g/dL | 9.1 ± 2.1 | 9.5 ± 2.6 | 13.7 ± 2.4 | < 0.001†,‡ |
| WBC Count, per mm3 | 13519.7 ± 7708.3 | 7684.9 ± 4887.9 | 8652.4 ± 2201.9 | < 0.001*,†,‡ |
| Platelets (x 103), per mm3 | 106 ± 70 | 111 ± 69 | 222 ± 66 | < 0.001†,‡ |
| Blood urea, mg/dL | 75.1 ± 54.0 | 42.4 ± 38.4 | 25.7 ± 6.6 | < 0.001*,† |
| Creatinine, mg/dL | 2.18 ± 2.24 | 1.18 ± 1.31 | 0.78 ± 0.1 | < 0.001*,† |
| Sodium, mEq/L | 136.2 ± 9.5 | 130.5 ± 6.8 | 138.7 ± 4.6 | 0.115 |
| Potassium, mEq/L | 4.1 ± 0.9 | 4.3 ± 0.9 | 4.6 ± 0.7 | < 0.01† |
| Total bilirubin, mg/dL | 13.8 ± 10.7 | 2.3 ± 2.3 | 0.6 ± 0.4 | < 0.001*,†,‡ |
| Aspartate aminotransferase, IU/L | 178.5 ± 246.5 | 82.8 ± 114.0 | 29.2 ± 11.3 | < 0.001*,†,‡ |
| Alanine aminotransferase, IU/L | 130.1 ± 316.0 | 46.8 ± 59.1 | 31.3 ± 19.3 | < 0.001*,† |
| Serum alkaline phosphatase, U/L | 287.3 ± 175.1 | 306.7 ± 291.5 | 216.4 ± 103.0 | 0.713 |
| Serum albumin, g/dL | 2.6 ± 0.5 | 3.2 ± 0.8 | 4.7 ± 0.6 | < 0.001*,†,‡ |
| Arterial Ammonia, µmol/L | 96.1 ± 29.1 | - | - | |
| Prothrombin time, seconds | 33.2 ± 17.3 | 17.4 ± 5.3 | 12.4 ± 2.2 | < 0.001*,†,‡ |
| Activated partial thromboplastin time, s | 56.8 ± 23.2 | 38.1 ± 13.9 | 31.2 ± 5.4 | < 0.001*,†,‡ |
| International normalized ratio | 2.9 ± 1.4 | 1.6 ± 0.4 | 1.1 ± 0.2 | < 0.001*,†,‡ |
| r time, minutes | 5.1 ± 2.7 | 5.4 ± 2.7 | 4.8 ± 2.5 | 0.572 |
| k time, minutes | 3.3 ± 2.3 | 3.2 ± 1.7 | 3.2 ± 1.5 | 0.920 |
| Alpha Angle, degree | 54.6 ± 13.1 | 52.6 ± 14.3 | 54.2 ± 11.0 | 0.667 |
| Maximum amplitude, mm | 53.8 ± 15.0 | 58.0 ± 13.9 | 67.2 ± 12.1 | < 0.001†,‡ |
| Lysis at 30 min, % | 8.6 ± 14.1 | 5.0 ± 9.5 | 4.2 ± 8.0 | 0.060 |
| MELD score | 29.6 ± 9.1 | 14.1 ± 6.9 | < 0.001* | |
| MELD-Na score | 32.0 ± 8.6 | 16.2 ± 7.6 | < 0.001* |
All values are expressed at mean ± sd (unless otherwise mentioned). ACLF: acute on chronic liver failure. AD: cirrhosis with acute decompensation, no ACLF. HC: healthy controls.
Etiologies of acute precipitating event and underlying chronic liver disease in patients with acute on chronic liver failure and cirrhosis with acute decompensation without acute on chronic liver failure.
| Etiology | ACLF (n = 68) | AD (n = 68) |
|---|---|---|
| Chronic liver disease | ||
| Alcohol | 34 (50.0%) | 22 (41.5%) |
| Hepatitis B | 3 (4.4%) | 8 (15.1%) |
| Hepatitis C | 5 (7.4%) | 1 (1.9%) |
| Hepatic vein outflow tract obstruction | 1 (1.5%) | 6 (11.3%) |
| Autoimmune | 1 (1.5%) | |
| Non-alcoholic fatty liver disease | 3 (4.4%) | 3 (5.7%) |
| Cryptogenic | 12 (17.6%) | 3 (5.7%) |
| Not Known | 3 (4.4%) | 10 (18.9%) |
| Hepatits C and Alcohol | 3 (4.4%) | |
| Hepatitis B and Alcohol | 2 (2.9%) | |
| Alcohol and non-alcoholic fatty liver disease | 1 (1.5%) | |
| Acute event | ||
| Hepatitis B reactivation | 2 (2.9%) | |
| Hepatitis E infection | 1 (1.5%) | |
| Hepatitis A infection | 1 (1.5%) | |
| Alcohol | 12 (17.6%) | |
| Drug induced | 4 (5.9%) | |
| Flare of autoimmune hepatitis | 1 (1.5%) | |
| Not known | 15 (22.2%) | |
| Operative | 1 (1.5%) | |
| Sepsis | 4 (5.9%) | |
| Bleed | 9 (13.2%) | |
| Alcohol and sepsis | 9 (13.2%) | |
| Alcohol and gastrointestinal bleed | 8 (11.8%) | |
| Gastrointestinal bleed and sepsis | 1 (1.5%) |
All values are expressed as n (%). ACLF: acute on chronic liver failure. AD: cirrhosis with acute decompensation without ACLF.
Mean PT, aPTT and INR were significantly prolonged in ACLF group as compared to AD and HC patients (P < 0.001) for all comparisons. The details of individual parameters are shown in table 1.
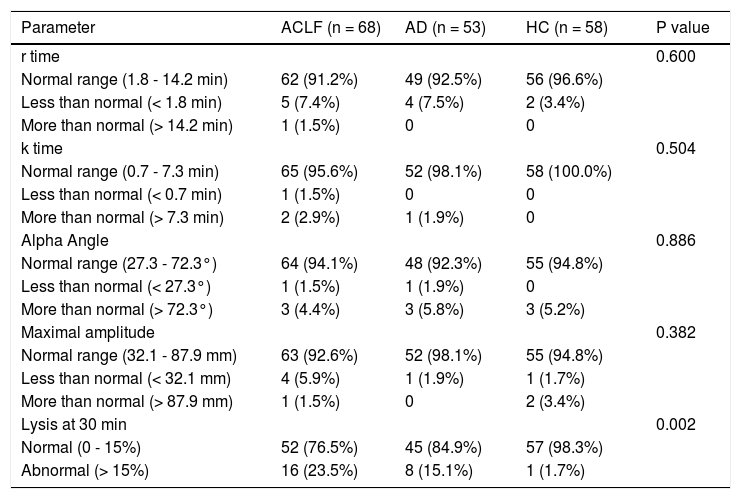
Comparison of TEG parameters in ACLF, AD patients and HC with normal defined rangesThe maximum amplitude (MA) was lower in ACLF and AD patients as compared to HC. There was a trend towards higher LY30 value in ACLF patients as compared to HC (P = 0.060). There were no differences in r time, k time and alpha angle between ACLF, AD and HC groups (Tables 1 and 3).
Thromboelastography parameters in acute on chronic liver failure (n = 68), chronic liver disease (n = 53) and healthy controls (n = 58).
| Parameter | ACLF (n = 68) | AD (n = 53) | HC (n = 58) | P value |
|---|---|---|---|---|
| r time | 0.600 | |||
| Normal range (1.8 - 14.2 min) | 62 (91.2%) | 49 (92.5%) | 56 (96.6%) | |
| Less than normal (< 1.8 min) | 5 (7.4%) | 4 (7.5%) | 2 (3.4%) | |
| More than normal (> 14.2 min) | 1 (1.5%) | 0 | 0 | |
| k time | 0.504 | |||
| Normal range (0.7 - 7.3 min) | 65 (95.6%) | 52 (98.1%) | 58 (100.0%) | |
| Less than normal (< 0.7 min) | 1 (1.5%) | 0 | 0 | |
| More than normal (> 7.3 min) | 2 (2.9%) | 1 (1.9%) | 0 | |
| Alpha Angle | 0.886 | |||
| Normal range (27.3 - 72.3°) | 64 (94.1%) | 48 (92.3%) | 55 (94.8%) | |
| Less than normal (< 27.3°) | 1 (1.5%) | 1 (1.9%) | 0 | |
| More than normal (> 72.3°) | 3 (4.4%) | 3 (5.8%) | 3 (5.2%) | |
| Maximal amplitude | 0.382 | |||
| Normal range (32.1 - 87.9 mm) | 63 (92.6%) | 52 (98.1%) | 55 (94.8%) | |
| Less than normal (< 32.1 mm) | 4 (5.9%) | 1 (1.9%) | 1 (1.7%) | |
| More than normal (> 87.9 mm) | 1 (1.5%) | 0 | 2 (3.4%) | |
| Lysis at 30 min | 0.002 | |||
| Normal (0 - 15%) | 52 (76.5%) | 45 (84.9%) | 57 (98.3%) | |
| Abnormal (> 15%) | 16 (23.5%) | 8 (15.1%) | 1 (1.7%) |
All values are expressed as n (%). ACLF: acute on chronic liver failure. AD: cirrhosis with acute decompensation, no ACLF. HC: healthy controls.
- •
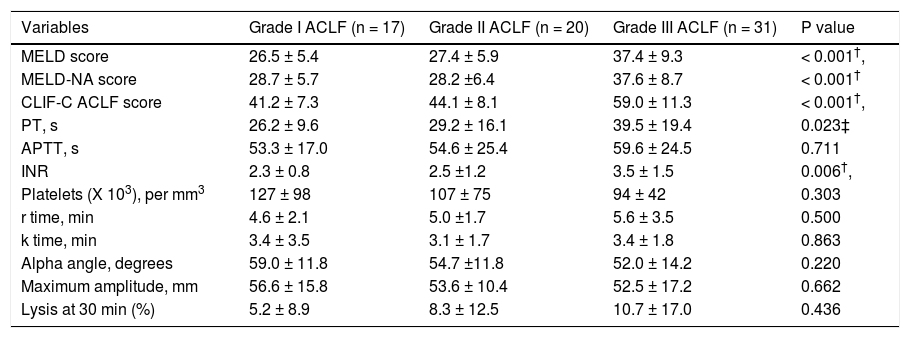
CCTs and TEG in patients with different grades of ACLF. Within the ACLF group (n = 68), severity grades I, II and III were observed in 25.0%, 29.4% and 45.6% of the cohort. As expected, prognostic scores -MELD, MELD-Na and CLIF - C ACLF scores were significantly higher in patients with grade III ACLF as compared to those with grades I and II. There were no significant differences between various TEG parameters among patients with different ACLF grades. The details of the TEG parameters are shown in table 4.
Table 4.Comparison of conventional coagulation parameters and TEG variables among patients with different grades of acute on chronic liver failure (ACLF).
Variables Grade I ACLF (n = 17) Grade II ACLF (n = 20) Grade III ACLF (n = 31) P value MELD score 26.5 ± 5.4 27.4 ± 5.9 37.4 ± 9.3 < 0.001†, MELD-NA score 28.7 ± 5.7 28.2 ±6.4 37.6 ± 8.7 < 0.001† CLIF-C ACLF score 41.2 ± 7.3 44.1 ± 8.1 59.0 ± 11.3 < 0.001†, PT, s 26.2 ± 9.6 29.2 ± 16.1 39.5 ± 19.4 0.023‡ APTT, s 53.3 ± 17.0 54.6 ± 25.4 59.6 ± 24.5 0.711 INR 2.3 ± 0.8 2.5 ±1.2 3.5 ± 1.5 0.006†, Platelets (X 103), per mm3 127 ± 98 107 ± 75 94 ± 42 0.303 r time, min 4.6 ± 2.1 5.0 ±1.7 5.6 ± 3.5 0.500 k time, min 3.4 ± 3.5 3.1 ± 1.7 3.4 ± 1.8 0.863 Alpha angle, degrees 59.0 ± 11.8 54.7 ±11.8 52.0 ± 14.2 0.220 Maximum amplitude, mm 56.6 ± 15.8 53.6 ± 10.4 52.5 ± 17.2 0.662 Lysis at 30 min (%) 5.2 ± 8.9 8.3 ± 12.5 10.7 ± 17.0 0.436 All values are expressed at mean ± SD (unless otherwise mentioned). ACLF: acute on chronic liver failure. MELD: model for end stage liver disease score. MELD-NA: meld-sodium score. CLIF-C ACLF: CLIF consortium ACLF score. PT: prothrombin time. APTT: activated partial thromboplastin time. INR: international normalized ratio.
* Significant between ACLF grade I and II,
† significant between ACLF grade II and III;
‡ significant between ACLF grade I and III.
- •
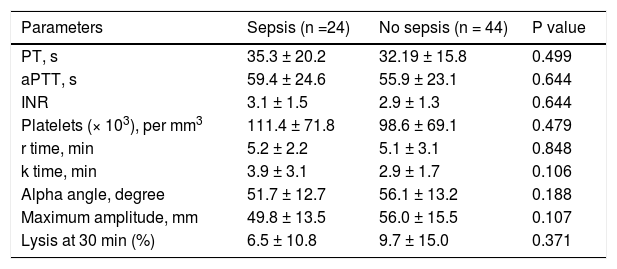
CCTs and TEG parameters in ACLF patients with sepsis. Sepsis was seen at presentation in 24 (35.2%) of patients. There were no significant differences in various TEG parameters between patients with and without sepsis at time of presentation (Table 5).
Table 5.Comparison of conventional coagulation tests and thromboelastography parameters in acute on chronic liver failure patients with and without sepsis at the time of admission.
Parameters Sepsis (n =24) No sepsis (n = 44) P value PT, s 35.3 ± 20.2 32.19 ± 15.8 0.499 aPTT, s 59.4 ± 24.6 55.9 ± 23.1 0.644 INR 3.1 ± 1.5 2.9 ± 1.3 0.644 Platelets (× 103), per mm3 111.4 ± 71.8 98.6 ± 69.1 0.479 r time, min 5.2 ± 2.2 5.1 ± 3.1 0.848 k time, min 3.9 ± 3.1 2.9 ± 1.7 0.106 Alpha angle, degree 51.7 ± 12.7 56.1 ± 13.2 0.188 Maximum amplitude, mm 49.8 ± 13.5 56.0 ± 15.5 0.107 Lysis at 30 min (%) 6.5 ± 10.8 9.7 ± 15.0 0.371 All values are expressed as mean ± SD. PT: prothrombin time. aPTT: activated partial thromboplastin time. INR: international normalized ratio.
- •
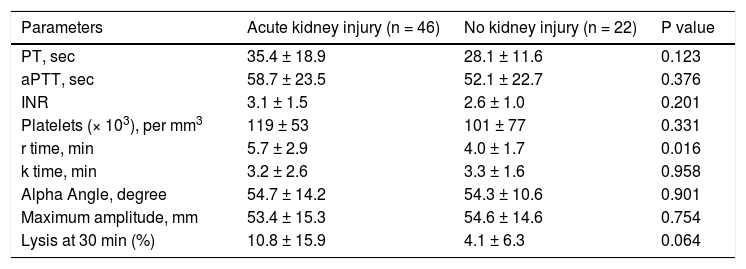
CCTs and TEG parameters in ACLF patients with acute kidney injury. Forty six (67.6 %) ACLF patients had acute kidney injury (AKI) at the time of presentation. A significant prolongation of r time was observed in patients with AKI as compared to those without AKI. There were no differences in the rest of the CCTs, platelet count and other TEG parameters (Table 6).
Table 6.Comparison of conventional coagulation tests and TEG parameters in acute on chronic liver failure patients with and without acute kidney injury at the time of admission.
Parameters Acute kidney injury (n = 46) No kidney injury (n = 22) P value PT, sec 35.4 ± 18.9 28.1 ± 11.6 0.123 aPTT, sec 58.7 ± 23.5 52.1 ± 22.7 0.376 INR 3.1 ± 1.5 2.6 ± 1.0 0.201 Platelets (× 103), per mm3 119 ± 53 101 ± 77 0.331 r time, min 5.7 ± 2.9 4.0 ± 1.7 0.016 k time, min 3.2 ± 2.6 3.3 ± 1.6 0.958 Alpha Angle, degree 54.7 ± 14.2 54.3 ± 10.6 0.901 Maximum amplitude, mm 53.4 ± 15.3 54.6 ± 14.6 0.754 Lysis at 30 min (%) 10.8 ± 15.9 4.1 ± 6.3 0.064 All values are expressed as mean ± SD. PT: prothrombin time. aPTT: activated partial thromboplastin time. INR: international normalized ratio.
- •
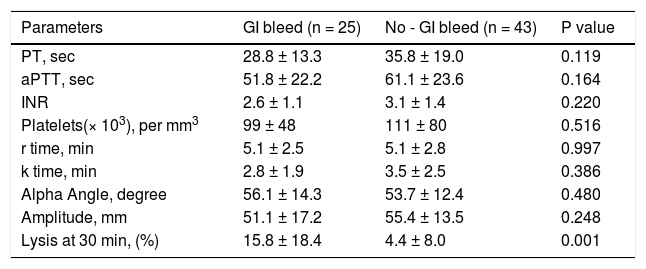
CCTs and TEG parameters in ACLF patients with gastrointestinal bleed. Twenty five (36.7%) patients had gastrointestinal bleed at the time of hospital admission. A significant prolongation of LY30 was observed in patients with bleed as compared to those without bleed (Table 7).
Table 7.Comparison of conventional coagulation tests and TEG parameters in acute on chronic liver failure patients with and without gastrointestinal bleed at the time of admission.
Parameters GI bleed (n = 25) No - GI bleed (n = 43) P value PT, sec 28.8 ± 13.3 35.8 ± 19.0 0.119 aPTT, sec 51.8 ± 22.2 61.1 ± 23.6 0.164 INR 2.6 ± 1.1 3.1 ± 1.4 0.220 Platelets(× 103), per mm3 99 ± 48 111 ± 80 0.516 r time, min 5.1 ± 2.5 5.1 ± 2.8 0.997 k time, min 2.8 ± 1.9 3.5 ± 2.5 0.386 Alpha Angle, degree 56.1 ± 14.3 53.7 ± 12.4 0.480 Amplitude, mm 51.1 ± 17.2 55.4 ± 13.5 0.248 Lysis at 30 min, (%) 15.8 ± 18.4 4.4 ± 8.0 0.001 All values are expressed as mean ± SD. PT: prothrombin time. aPTT: activated partial thromboplastin time. INR: international normalized ratio.
- •
Development of thrombosis and bleeding. Forty-five ACLF patients underwent central line insertion, 6 patients underwent transjugular liver biopsies, 1 patient underwent lumbar puncture and all underwent diagnostic / therapeutic abdominal paracentesis. There was no procedure related bleeding in any of these patients. A total of 5 patients developed bleeding from GI tract during hospital stay- 3 patients had variceal bleeding and 2 had gastric ulcer. No thrombotic event occurred in any of the ACLF patients. During the course of the disease, another 2 patients developed bleeding from respiratory tract, and 3 developed DIC.
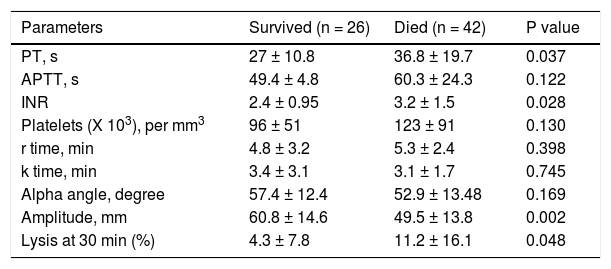
Patients with ACLF were followed till 90 days or until demise. The 30-days and 90-days mortality was 75% and 78%, respectively (Figure 2). Forty-two of 68 ACLF patients (61.8%) died during hospital stay. Significant differences were observed between the survivors and non-survivors in values of INR, MA and LY30 (Table 8). Non-survivors had significantly prolonged INR compared to survivors (3.2 ± 1.5 vs. 2.4 ± 0.95, respectively, P = 0.028). Non-survivors also had significantly higher LY30 compared to survivors (11.2 ± 16.1% vs. 4.3 ± 7.8%, respectively, P = 0.048). On the other hand, survivors had significantly higher MA than non-survivors (60.8 ± 14.6 vs. 49.5 ± 13.8, respectively, P = 0.002).
.")
Comparison of conventional coagulation tests and TEG parameters in acute on chronic liver failure patients who survived and died during hospital stay.
| Parameters | Survived (n = 26) | Died (n = 42) | P value |
|---|---|---|---|
| PT, s | 27 ± 10.8 | 36.8 ± 19.7 | 0.037 |
| APTT, s | 49.4 ± 4.8 | 60.3 ± 24.3 | 0.122 |
| INR | 2.4 ± 0.95 | 3.2 ± 1.5 | 0.028 |
| Platelets (X 103), per mm3 | 96 ± 51 | 123 ± 91 | 0.130 |
| r time, min | 4.8 ± 3.2 | 5.3 ± 2.4 | 0.398 |
| k time, min | 3.4 ± 3.1 | 3.1 ± 1.7 | 0.745 |
| Alpha angle, degree | 57.4 ± 12.4 | 52.9 ± 13.48 | 0.169 |
| Amplitude, mm | 60.8 ± 14.6 | 49.5 ± 13.8 | 0.002 |
| Lysis at 30 min (%) | 4.3 ± 7.8 | 11.2 ± 16.1 | 0.048 |
All values are expressed as mean ± SD. PT: prothrombin time. APTT: activated partial thromboplastin time. INR: International normalized ratio.
In this large study, we observed that the TEG parameter of maximum amplitude was significantly abnormal in ACLF patients. In cases of co-existing AKI with ACLF, r-time was observed to be significantly altered. There were no differences in r-time, k-time, or alpha angle between ACLF, AD patients and healthy subjects. The TEG parameters were similar among patients with different grades of ACLF.
Among the CCTs, PT/INR and aPTT were significantly prolonged in patients with ACLF (Table 1). Hemostasis in chronic liver disease is characterized by re-calibration of the equilibrium between pro- and anti-coagulant factors, as production of both is affected. Recent studies have reported no differences in thrombin production in presence of thrombomodulin in ACLF patients as compared to healthy controls.19,20 The underlying anti-coagulant alterations in cirrhosis include quantitative and functional defects in platelets, decreased factor production, dys-fibrinogenemia and elevated t-PA, among others. The levels of von Willebrand factor (vWF) and factor VIII are increased,21 whereas all other procoagulant and anticoagulant factors are reduced.22,23 Though there exists a restored balance, it is fragile due to an inherent lack of compensatory reserve to preserve this balance in circumstances of stress e.g. ACLF.19
There is a need to assess the global hemostasis in such circumstances, which can be achieved by viscoelastic tests like TEG, as these are more comprehensive than the CCTs. TEG is now widely used prior to cardiac surgery and liver transplant surgery to assess for coagulation defects.24,25 Recent literature suggests that it has a role in guiding blood product transfusions in cirrhosis patients prior to therapeutic procedures.26 This strategy is associated with significantly lesser number of blood product transfusions as compared to patients who receive transfusions as guided by CCTs (transfusions guided by INR and platelet count). This suggests that TEG parameters may assess the overall coagulation in ACLF better than the CCTs.
We found abnormal TEG parameters- in the form of low amplitude (MA) and increased LY30- in patients with ACLF as compared with healthy controls (Table 3). These findings suggest that the clot strength is less and fibrinolysis is increased in patients with ACLF. Similar observations were made by Pietri, et al. in cirrhotics undergoing liver transplantation.27 Studies assessing serial TEG measurements have also reported hypocoagulability to be associated with early rebleeding in cirrhotic patients.28 In our study, among patients with AKI at presentation, there was an increase in r time, whereas there were no other abnormalities in CCTs and other TEG parameters. Renal failure has been shown to alter hemostasis. Our findings are corroborated by another study comparing 70 end stage renal disease (ESRD) patients with normal patients: except for significant increase in r time (reflecting rate of fibrin formation) in ESRD, normal CCTs and TEG parameters were found.29
We did not observe any differences in TEG parameters between ACLF patients with and without sepsis. These findings are in contrast to those reported previously in cirrhosis patients with infection. Papatheodoridis, et al. reported derangement in all TEG parameters after onset of infection, and parameters returned to normal ranges after resolution of infection.30 We did not measure serial TEG parameters in our study, so we cannot extrapolate our results to this situation.
Overall survival was poor- 78% of our ACLF patients died within 90 days. The reasons for such high mortality included the fact that 75% of patients were grade 2 or 3 ACLF, which are associated with high mortality.1,17 Although MA was not significantly different between the patients with various grade of ACLF, there was a trend towards gradual reduction with increasing grades (Table 4). MA is affected by platelet count which is frequent in patients with CLD and portal hypertension.7 INR and LY30 were higher and MA was lower in non-survivors as compared to survivors. There were no differences in r-time, k-time, or alpha angle among survivors and non-survivors. Moreover, patients with ACLF are at risk of bleeding or disseminated intravascular coagulation; whether these complications can be predicted by TEG parameters cannot be answered from the present study: future studies with sequential assessment of TEG parameters are needed. Recent data suggests that TEG can be used as a guide to transfuse blood products prior to invasive procedures in cirrhosis.26 Our data suggests that most ACLF patients have normal TEG parameters, with no differences in parameters across various ACLF grades. Our interpretations about clot strength are based on the thromboelastography reports only, in absence of any gold standard tests. Future clinical trials are needed to define the utility of TEG in guiding blood product transfusion in ACLF patients.
The unique aspects of our study are inclusion of a large number of ACLF patients, its comparison with AD and healthy controls and analysis of coagulation derangements in patients with and without OF using TEG. Limitations include non-estimation of coagulation factors, proteins C and S, antithrombin III and fibrin degradation products, so we are unable to assess the exact roles of these factors in coagulation dysfunction in ACLF patients. Fibrinogen and platelets both contribute to the clot strength. We did not assess fibrinogen levels, thus cannot comment on the interplay between fibrinogen and platelets in assessment of clot strength. Also, the study was cross sectional and we did not assess serial TEG parameters to assess its predictive value in development of complications.
In conclusion, TEG parameters in ACLF patients are essentially normal, except reduced maximum amplitude. Future studies are needed to explore the utility of TEG in clinical management of ACLF patients.
Abbreviations- •
AASLD: American Association for the Study of Liver Diseases.
- •
ACLF: acute on chronic liver failure.
- •
aPTT: activated partial thromboplastin time.
- •
CCTs: conventional coagulation tests.
- •
CLD: chronic liver disease.
- •
CTP: Child-Turcotte-Pugh.
- •
EASL: European Association for the Study of the Liver.
- •
INR: International normalized ratio.
- •
OF: organ failure.
- •
PT: prothrombin time.
- •
TEG: thromboelastography.
The authors declares that there is no conflict of interest regarding the publication of this article.
confirmationPatient consent was obtained for publication of the case details.
AcknowledgementsMr. Amar Negi for maintenance of Acute on Chronic Liver Failure data base.


