


Background The protein encoded by PARK2 gene is a component of the ubiquitin-proteasome system that mediates targeting of proteins for the degradation pathway. Genetic variations at PARK2 gene were linked to various diseases including leprosy, typhoid and cancer. The present study investigated the association of single nucleotide polymorphisms (SNPs) in the PARK2 gene with the development of hepatitis C virus (HCV) infection and its progression to severe liver diseases.
Material and methods. A total of 800 subjects, including 400 normal healthy subjects and 400 HCV-infected patients, were analyzed in this study. The patients were classified as chronic HCV patients (group I), patients with cirrhosis (group II) and patients with hepatocellular carcinoma (HCC) in the context of cirrhosis (group III). DNA was extracted and was genotyped for the SNPs rs10945859, rs2803085, rs2276201 and rs1931223.
Results. Among these SNPs, CT genotype of rs10945859 was found to have a significant association towards the clinical progression of chronic HCV infection to cirrhosis alone (OR = 1.850; 95% C. I. 1.115-3.069; p = 0.016) or cirrhosis and HCC (OR = 1.768; 95% C. I. 1.090-2.867; p value = 0.020).
Conclusion. SNP rs10945859 in the PARK2 gene could prove useful in predicting the clinical outcome in HCV-infected patients.
Hepatitis C Virus (HCV) is an enveloped, positive-sense and single-stranded RNA virus classified within Hepacivirus genus of the Flaviviridae family. It is considered as a major cause of chronic liver diseases and is considered as one of the most serious blood borne infection, with nearly 170 million people infected worldwide.1 Although, the majority of the HCV infections evolve to chronicity, nearly 15-25% of the cases clear the virus spontaneously without any treatment intervention.2 Individuals who are chronically infected with HCV could progress to fibrosis and the infection could lead to cirrhosis with the risk of developing hepatocellular carcinoma (HCC). It has been reported that 4% of all HCV-infected cases show clinical progression to HCC.3,4
Development of HCV-associated liver complications involves several abnormalities including genetic alterations, activation of cellular oncogenes, inactivation of tumor suppressor genes, and dysregulation of multiple signal transduction pathways.5,6 It is hypothesized that during liver injury, hepatic stellate cells (HSCs) transform into myofibroblast-like cells and this mechanism results in the initiation of hepatic fibrosis which could ultimately cause cirrhosis. Activation and proliferation of HSCs precedes development of fibrosis, which in turn is followed by the occurrence of HCC.7–10
It is well established that in addition to viral genotype, viral load and environmental factors, variations in host genetics strongly influence the disease outcome associated with HCV infection. Single nucleotide polymorphisms (SNPs) in host genes, e. g. genes involved in humoral and cellular immune responses and genes associated with activation of antiviral mechanism, could determine the consequence of infection either towards viral clearance or progression to chronicity.11,12
Genetic polymorphisms in several human genes have strong association with HCV clearance and/or disease progression including human leukocyte antigen (HLA),13–15 CD24,16 IL23R17 and TNF-α.18 Also, polymorphisms within DEPD5,19 IL1020 and chemokines21,22 have been implicated in HCV infection and HCV-associated sequelae.
PARK2, which is encoded by a large gene located on chromosome 6q25.2-q27, is an E3 ubiquitin-protein ligase and is required for polyubiquitination of proteins before degradation by the proteasome.23 PARK2 protein consists of 465 amino acids with multiple distinct domains including an ubiquitin like domain, a unique Parkin-specific domain, 2 RING domains and an in-between-RING domain.24 It was originally discovered as a cause of autosomal recessive juvenile parkinsonism25 and since then it has subsequently been linked to leprosy,26–28 autism,29 type 2 diabetes mellitus,30 Alzheimer disease31 and some types of cancer.32,33 Further, heterozygous mutations in PARK2 gene also exist and are considered to be more controversial with regard to disease association.34 A study found that variants in the shared PARK2 and PACRG regulatory region act as a risk factor for infection by Mycobacterium leprae, as a strong association was demonstrated between the PARK2_e01(-2599) polymorphism and leprosy.28
In the present study, we investigated the role of polymorphism in PARK2 gene as a host risk factor in the development of HCV infection and its progression to advanced stages of liver disease.
Material and MethodsPatientsBlood samples were procured from 400 HCV patients receiving treatment in three major hospitals in Riyadh city, namely King Faisal Specialist Hospital & Research Center, Riyadh Military Hospital and King Khalid University Hospital.
The patients were classified on the basis of clinical manifestation of the disease into three groups. Group I consisted of chronic HCV patients who were diagnosed on the basis of the presence of anti-HCV antibodies and persistent detection of HCV RNA for more than six months. Patients in this group exhibited normal, elevated and fluctuating levels of alanine aminotransferase (ALT). However, all subjects included in this group did not show clinical, radiological or histological evidence of cirrhosis. Group II included patients with HCV-induced liver cirrhosis. Cirrhosis was diagnosed by the non-invasive assessment of hepatic fibrosis with ultrasound based elastography (FibroScan)35 and/or the presence of esophageal varices, platelet count < 100 x 109/L, imaging features consistent with cirrhosis, albumin level less than 30 g/L, international normalized ratio (INR) more than 1.4 and bilirubin (BIL) > 30 μmol/L. Group III is defined as patients who had HCV-induced HCC in the context of cirrhosis. The diagnosis of HCC was made on the basis of the recommended guidelines.36,37 Patients with significant alcohol ingestion, co-infection with HBV and/or HIV and other causes of liver disease such as Wilson’s disease, hemochromatosis and autoimmune hepatitis were excluded from this study. Blood samples were also collected from 400 normal healthy subjects who volunteered to participate in this study and set as control. They were characterized by the absence of any known serological marker of HCV. The study was approved by the institutional review board of all participating hospitals, and conducted in accordance with the Helsinki Declaration of 1975. Informed consents were obtained from all subjects enrolled in the study.
Genotyping of PARK2 SNPsGenomic DNA from peripheral blood mononuclear cells was extracted using Gentra Pure Gene kit according to the manufacturer’s protocol (Qiagen, Hilden, Germany). Blood samples from patients and controls were genotyped for PARK2 SNPs.
PCR-based genotyping assayThe genotyping primer sets were designed using Primer3 v.0.4.0 (http://bioinfo.ut.ee/primer3-0.4.0primer3/). The following primers, sense 5’-ATTCTCTTCTCTCCCCTCCA-3’ and antisense 5’-ACCTCTTACCCTCTTTTTAGTGTG-3’, were used to amplify the genomic region encompassing SNPs rs10945859 and rs2803085. Also, the region containing rs2276201 was amplified using the following primers: sense 5’-TTTATGAGAACAAGACATTTTCTAGG-3’ and antisense 5’-AGTAATTTTGGGCGGTCCAG -3’. Finally, primers used to amplify the region flanking rs1931223 were: sense 5’- AAAAACCTCCCTACCTTCTTTCTT-3’ and antisense 5’-AACAAGGCAATACCTCTTACGC -3’. All PCR reactions were performed on Veriti 96-Well Thermal Cycler (Applied Biosystems, Foster City, CA, USA), under the following conditions: 2 min initial denaturation at 94°C; followed by 40 cycles of 94 °C for 1 min; 60 °C for 45 s; 72 °C for 1-min and a 5-min final extension at 72 °C.
DNA sequencingThe amplified PCR products were then electrophoresed using a 2% agarose gel and visualized by ethidium bromide (0.5 μg/mL). The DNA fragments obtained were gel purified and sequenced using automated DNA sequencing system (ABI 3100 and BigDye® Terminator v3.1 cycle sequencing Kit (Applied Biosystems)) according to the manufacturer’s instructions.
The sequencing reaction mixture contained 5.6 μL PCR products, 2 μL terminator ready reaction mix, 2 μL sequencing buffer, 0.2 μL of each primer (forward/reverse primer specific for the target sequences), and brought to a final volume of 10 μL. Sequenced products were then purified using DyeEx spin column and eluted into 25 μL ddH2O. Each sample was vacuum-dried, re-suspended in 15 μL of Hi-Di formamide and analyzed by ABI 3700 DNA Analyzer (Applied Biosystems).
Statistical analysisUsing the genotyping data, Haploview 4.2 software (Broad Institute of MIT and Harvard, Cambridge, MA) was used to calculate minor allele frequency (MAF), haplotype blocks and pairwise linkage disequilibrium (LD). χ2 test and Fisher’s exact test were used to detect any association among categorical variables. While, One-way ANOVA and nonparametric test were used to analyze the continuous data. All statistical analyses were performed using SPSS software version 20 (SPSS Inc., Chicago, IL, USA). The link between the PARK2 SNPs and the disease outcome were expressed in odds ratio (OR) and their 95% confidence intervals (C.I.). A p value ≤ 0.05 was considered to be statistically significant. The SNPs were tested for Hardy-Weinberg equilibrium (HWE) using the DeFinetti program (http://ihg.gsf.de/cgi-bin/hw/hwa1.pl) with a cut-off p value of 0.01 and minor allele frequency (MAF) greater than 1%.
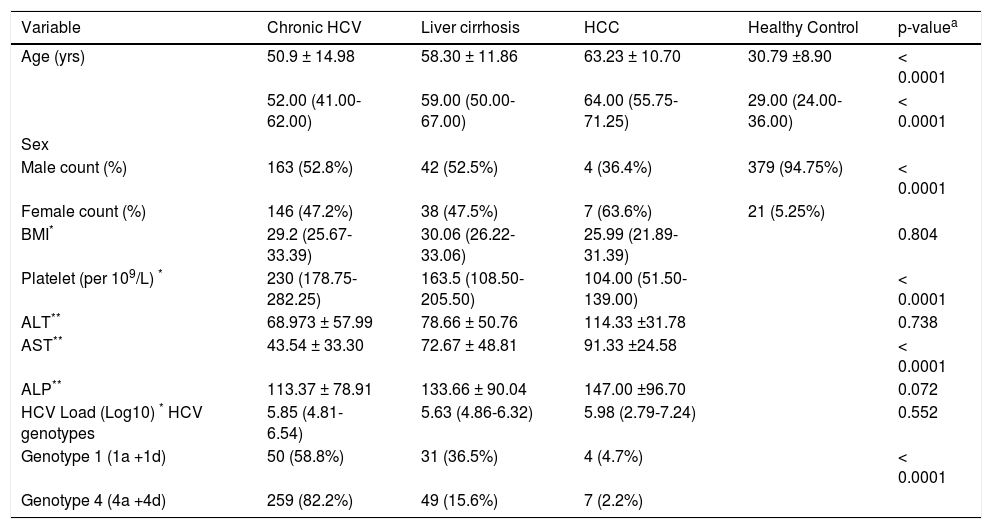
ResultsIn the present study, samples from 400 control healthy subjects and 400 HCV-infected patients were assayed. The 400 HCV-infected patients included 309 chronic HCV patients (group I), 80 cirrhotic patients (group II) and 11 HCC patients (group III). The basic demographic and some clinical data are shown in table 1. Significant differences were observed in age (p ≤ 0.0001), gender distribution (p ≤ 0.0001), platelet count (p ≤ 0.0001), and AST (p ≤ 0.0001) across the different clinical groups. No significant differences were found in BMI, ALT, ALP and viral load between the groups. Also, the prevalence of steatosis (fatty liver) was 22.33% (69/309) in chronic patients (group I).
Table 1 Baseline characteristics of all subjects included in this study.
| Variable | Chronic HCV | Liver cirrhosis | HCC | Healthy Control | p-valuea |
|---|---|---|---|---|---|
| Age (yrs) | 50.9 ± 14.98 | 58.30 ± 11.86 | 63.23 ± 10.70 | 30.79 ±8.90 | < 0.0001 |
| 52.00 (41.00-62.00) | 59.00 (50.00-67.00) | 64.00 (55.75-71.25) | 29.00 (24.00-36.00) | < 0.0001 | |
| Sex | |||||
| Male count (%) | 163 (52.8%) | 42 (52.5%) | 4 (36.4%) | 379 (94.75%) | < 0.0001 |
| Female count (%) | 146 (47.2%) | 38 (47.5%) | 7 (63.6%) | 21 (5.25%) | |
| BMI* | 29.2 (25.67-33.39) | 30.06 (26.22-33.06) | 25.99 (21.89-31.39) | 0.804 | |
| Platelet (per 109/L) * | 230 (178.75-282.25) | 163.5 (108.50-205.50) | 104.00 (51.50-139.00) | < 0.0001 | |
| ALT** | 68.973 ± 57.99 | 78.66 ± 50.76 | 114.33 ±31.78 | 0.738 | |
| AST** | 43.54 ± 33.30 | 72.67 ± 48.81 | 91.33 ±24.58 | < 0.0001 | |
| ALP** | 113.37 ± 78.91 | 133.66 ± 90.04 | 147.00 ±96.70 | 0.072 | |
| HCV Load (Log10) * HCV genotypes | 5.85 (4.81-6.54) | 5.63 (4.86-6.32) | 5.98 (2.79-7.24) | 0.552 | |
| Genotype 1 (1a +1d) | 50 (58.8%) | 31 (36.5%) | 4 (4.7%) | < 0.0001 | |
| Genotype 4 (4a +4d) | 259 (82.2%) | 49 (15.6%) | 7 (2.2%) |
pa: nonparametric test and one way Anova for continuous data and χ2 test for categorical data. BMI: body mass index. ALT: alanine aminotransferase. AST: aspartate aminotransferase. ALP: alkaline phosphatase.
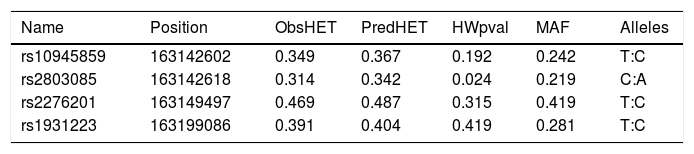
A total of seven SNPs were selected; rs76190375, rs10945859, rs2803085, rs163142645, rs2276201, rs1931223 and rs163877197. SNPs rs76190375, rs163142645 and rs163877197 were excluded from the analysis as they deviated from HWE. Genotyping was performed on the remaining four SNPs on all samples tested in this study. All SNPs analyzed were in HWE with a MAF more than 1% within this population (Table 2).
SNP marker information for PARK2 gene for all subjects observed (patients and healthy controls).
| Name | Position | ObsHET | PredHET | HWpval | MAF | Alleles |
|---|---|---|---|---|---|---|
| rs10945859 | 163142602 | 0.349 | 0.367 | 0.192 | 0.242 | T:C |
| rs2803085 | 163142618 | 0.314 | 0.342 | 0.024 | 0.219 | C:A |
| rs2276201 | 163149497 | 0.469 | 0.487 | 0.315 | 0.419 | T:C |
| rs1931223 | 163199086 | 0.391 | 0.404 | 0.419 | 0.281 | T:C |
Position: chromosomal position. ObsHET: observed heterozygosity. PredHET: predicted heterozygosity. HWpval: Hardy-Weinberg P-value. MAF: minor allele frequency.
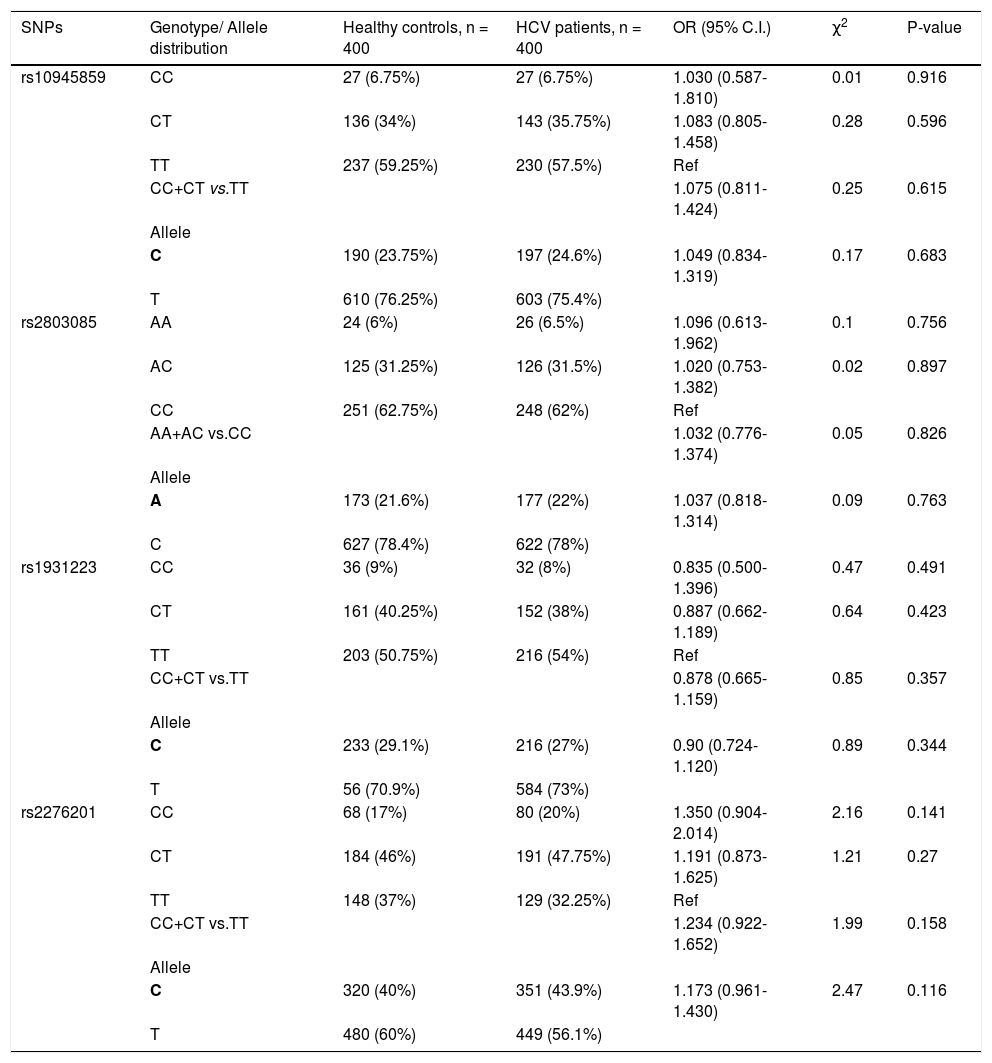
None of the SNPs showed any significant association when healthy control subjects were compared with HCV infected patients (i.e. groups I + II + III combined) (Table 3).
Genotypic distribution for PARK2 SNPs when healthy control subjects were compared to HCV-infected patients.
| SNPs | Genotype/ Allele distribution | Healthy controls, n = 400 | HCV patients, n = 400 | OR (95% C.I.) | χ2 | P-value |
|---|---|---|---|---|---|---|
| rs10945859 | CC | 27 (6.75%) | 27 (6.75%) | 1.030 (0.587-1.810) | 0.01 | 0.916 |
| CT | 136 (34%) | 143 (35.75%) | 1.083 (0.805-1.458) | 0.28 | 0.596 | |
| TT | 237 (59.25%) | 230 (57.5%) | Ref | |||
| CC+CT vs.TT | 1.075 (0.811-1.424) | 0.25 | 0.615 | |||
| Allele | ||||||
| C | 190 (23.75%) | 197 (24.6%) | 1.049 (0.834-1.319) | 0.17 | 0.683 | |
| T | 610 (76.25%) | 603 (75.4%) | ||||
| rs2803085 | AA | 24 (6%) | 26 (6.5%) | 1.096 (0.613-1.962) | 0.1 | 0.756 |
| AC | 125 (31.25%) | 126 (31.5%) | 1.020 (0.753-1.382) | 0.02 | 0.897 | |
| CC | 251 (62.75%) | 248 (62%) | Ref | |||
| AA+AC vs.CC | 1.032 (0.776-1.374) | 0.05 | 0.826 | |||
| Allele | ||||||
| A | 173 (21.6%) | 177 (22%) | 1.037 (0.818-1.314) | 0.09 | 0.763 | |
| C | 627 (78.4%) | 622 (78%) | ||||
| rs1931223 | CC | 36 (9%) | 32 (8%) | 0.835 (0.500-1.396) | 0.47 | 0.491 |
| CT | 161 (40.25%) | 152 (38%) | 0.887 (0.662-1.189) | 0.64 | 0.423 | |
| TT | 203 (50.75%) | 216 (54%) | Ref | |||
| CC+CT vs.TT | 0.878 (0.665-1.159) | 0.85 | 0.357 | |||
| Allele | ||||||
| C | 233 (29.1%) | 216 (27%) | 0.90 (0.724-1.120) | 0.89 | 0.344 | |
| T | 56 (70.9%) | 584 (73%) | ||||
| rs2276201 | CC | 68 (17%) | 80 (20%) | 1.350 (0.904-2.014) | 2.16 | 0.141 |
| CT | 184 (46%) | 191 (47.75%) | 1.191 (0.873-1.625) | 1.21 | 0.27 | |
| TT | 148 (37%) | 129 (32.25%) | Ref | |||
| CC+CT vs.TT | 1.234 (0.922-1.652) | 1.99 | 0.158 | |||
| Allele | ||||||
| C | 320 (40%) | 351 (43.9%) | 1.173 (0.961-1.430) | 2.47 | 0.116 | |
| T | 480 (60%) | 449 (56.1%) |
Bold letter represents risk allele.
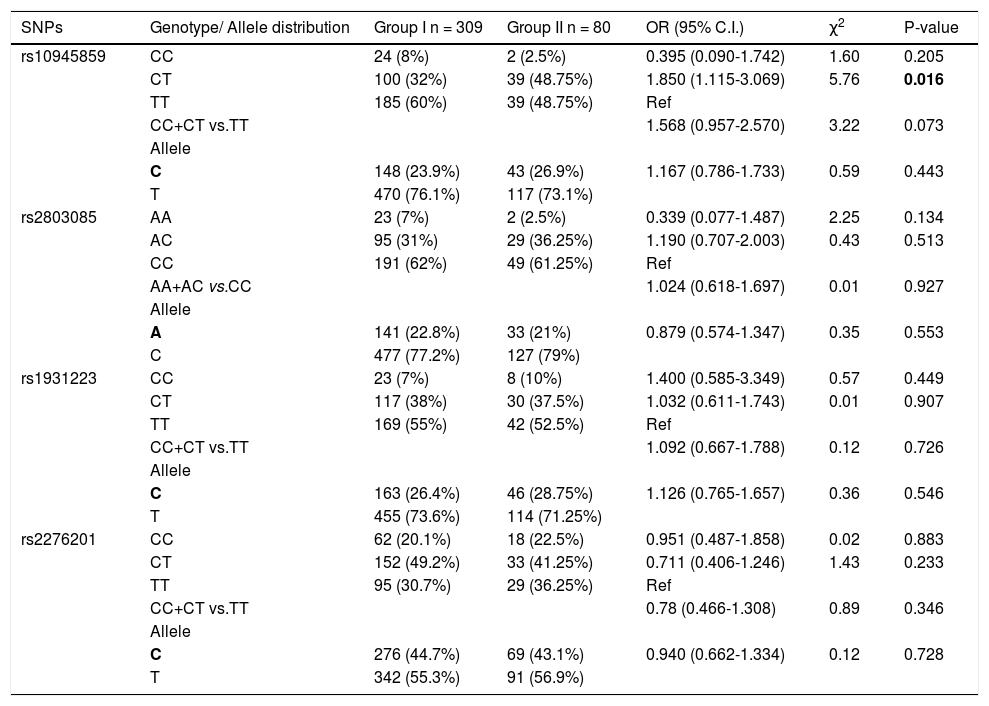
Further, the frequency of these SNPs was analyzed and compared between the chronic HCV patients (group I) and patients with cirrhosis (group II). For rs10945859, the frequency of CT genotype was significantly higher in cirrhotic patients than chronic HCV patients (OR = 1.850; 95% C. I. 1.115-3.069; p = 0.016) (Table 4). This indicates that HCV-infected individuals who carry heterozygous CT genotype have higher likelihood of developing cirrhosis than those with homozygous CC or TT genotype. None of the other SNPs showed any significant association with progression to liver cirrhosis in this analysis.
Genotypic distribution for PARK2 SNPs when chronic HCV patients (group I) were compared with cirrhotic patients (group ii).
| SNPs | Genotype/ Allele distribution | Group I n = 309 | Group II n = 80 | OR (95% C.I.) | χ2 | P-value |
|---|---|---|---|---|---|---|
| rs10945859 | CC | 24 (8%) | 2 (2.5%) | 0.395 (0.090-1.742) | 1.60 | 0.205 |
| CT | 100 (32%) | 39 (48.75%) | 1.850 (1.115-3.069) | 5.76 | 0.016 | |
| TT | 185 (60%) | 39 (48.75%) | Ref | |||
| CC+CT vs.TT | 1.568 (0.957-2.570) | 3.22 | 0.073 | |||
| Allele | ||||||
| C | 148 (23.9%) | 43 (26.9%) | 1.167 (0.786-1.733) | 0.59 | 0.443 | |
| T | 470 (76.1%) | 117 (73.1%) | ||||
| rs2803085 | AA | 23 (7%) | 2 (2.5%) | 0.339 (0.077-1.487) | 2.25 | 0.134 |
| AC | 95 (31%) | 29 (36.25%) | 1.190 (0.707-2.003) | 0.43 | 0.513 | |
| CC | 191 (62%) | 49 (61.25%) | Ref | |||
| AA+AC vs.CC | 1.024 (0.618-1.697) | 0.01 | 0.927 | |||
| Allele | ||||||
| A | 141 (22.8%) | 33 (21%) | 0.879 (0.574-1.347) | 0.35 | 0.553 | |
| C | 477 (77.2%) | 127 (79%) | ||||
| rs1931223 | CC | 23 (7%) | 8 (10%) | 1.400 (0.585-3.349) | 0.57 | 0.449 |
| CT | 117 (38%) | 30 (37.5%) | 1.032 (0.611-1.743) | 0.01 | 0.907 | |
| TT | 169 (55%) | 42 (52.5%) | Ref | |||
| CC+CT vs.TT | 1.092 (0.667-1.788) | 0.12 | 0.726 | |||
| Allele | ||||||
| C | 163 (26.4%) | 46 (28.75%) | 1.126 (0.765-1.657) | 0.36 | 0.546 | |
| T | 455 (73.6%) | 114 (71.25%) | ||||
| rs2276201 | CC | 62 (20.1%) | 18 (22.5%) | 0.951 (0.487-1.858) | 0.02 | 0.883 |
| CT | 152 (49.2%) | 33 (41.25%) | 0.711 (0.406-1.246) | 1.43 | 0.233 | |
| TT | 95 (30.7%) | 29 (36.25%) | Ref | |||
| CC+CT vs.TT | 0.78 (0.466-1.308) | 0.89 | 0.346 | |||
| Allele | ||||||
| C | 276 (44.7%) | 69 (43.1%) | 0.940 (0.662-1.334) | 0.12 | 0.728 | |
| T | 342 (55.3%) | 91 (56.9%) |
Bold letter represents risk allele.
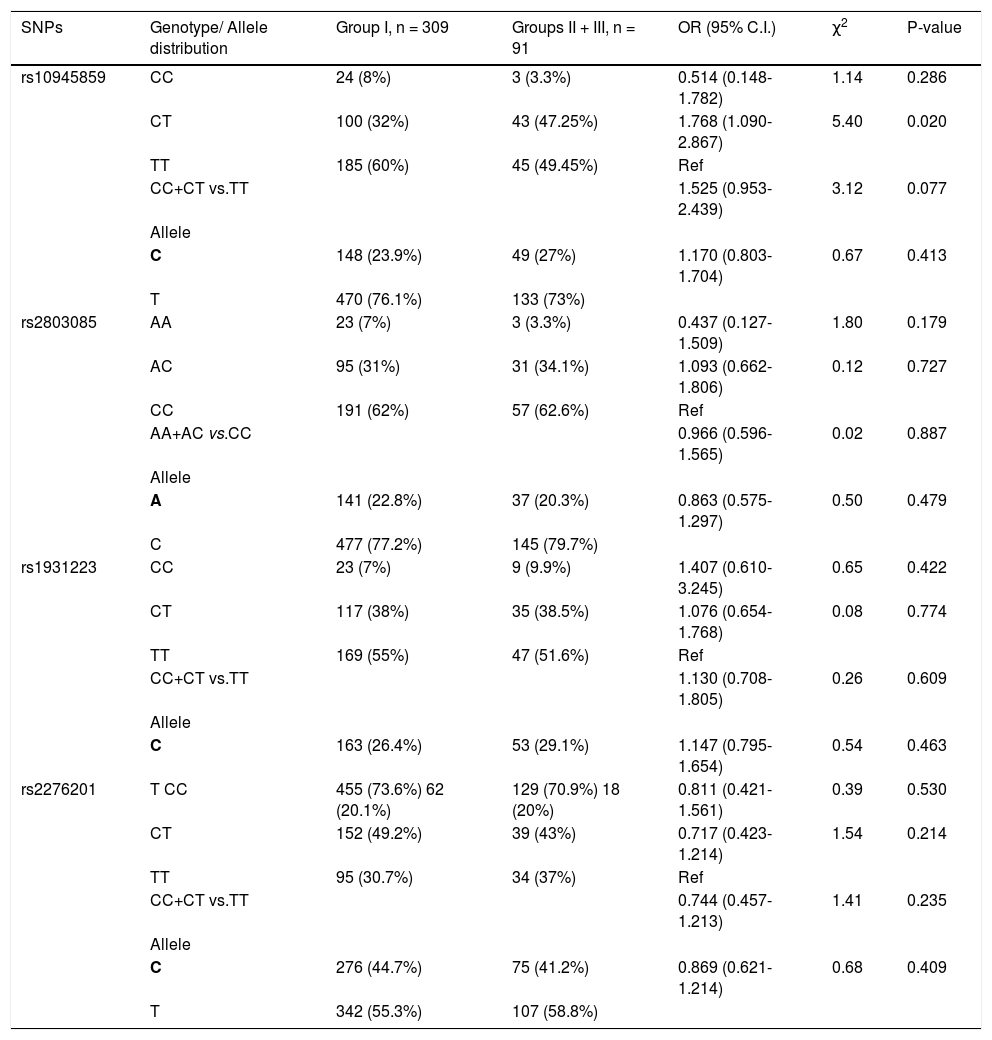
Next, the frequency of the SNPs in chronic HCV patients (group I) was compared with patients who developed HCC (group III). None of the SNPs showed any significant association with the development of HCC (Table 5). However, when the two groups of patients with progressed liver disease (i.e. groups II and III) were combined and compared to group I (chronic HCV patients), rs10945859 CT genotype showed higher prevalence in patients with liver complications than chronic HCV patients (OR = 1.768; 95% C. I. 1.090-2.867; p = 0.020) (Table 5). This observation emphasizes the importance of CT genotype of SNP rs10945859 as a predictor of liver complications in HCV-infected patients. Also, under the dominant model, CC + CT vs. TT of rs10945859 showed association close to significance with a p value of 0.077 (Table 5). However, SNPs rs2803085, rs1931223 and rs2276201 with p values of 0.179, 0.422 and 0.530, respectively, did not show any significant association with development of liver complications.
Genotypic distribution for PARK2 SNPs when chronic HCV patients (group I) were compared with cirrhotic and HCC patients (groups II and III).
| SNPs | Genotype/ Allele distribution | Group I, n = 309 | Groups II + III, n = 91 | OR (95% C.I.) | χ2 | P-value |
|---|---|---|---|---|---|---|
| rs10945859 | CC | 24 (8%) | 3 (3.3%) | 0.514 (0.148-1.782) | 1.14 | 0.286 |
| CT | 100 (32%) | 43 (47.25%) | 1.768 (1.090-2.867) | 5.40 | 0.020 | |
| TT | 185 (60%) | 45 (49.45%) | Ref | |||
| CC+CT vs.TT | 1.525 (0.953-2.439) | 3.12 | 0.077 | |||
| Allele | ||||||
| C | 148 (23.9%) | 49 (27%) | 1.170 (0.803-1.704) | 0.67 | 0.413 | |
| T | 470 (76.1%) | 133 (73%) | ||||
| rs2803085 | AA | 23 (7%) | 3 (3.3%) | 0.437 (0.127-1.509) | 1.80 | 0.179 |
| AC | 95 (31%) | 31 (34.1%) | 1.093 (0.662-1.806) | 0.12 | 0.727 | |
| CC | 191 (62%) | 57 (62.6%) | Ref | |||
| AA+AC vs.CC | 0.966 (0.596-1.565) | 0.02 | 0.887 | |||
| Allele | ||||||
| A | 141 (22.8%) | 37 (20.3%) | 0.863 (0.575-1.297) | 0.50 | 0.479 | |
| C | 477 (77.2%) | 145 (79.7%) | ||||
| rs1931223 | CC | 23 (7%) | 9 (9.9%) | 1.407 (0.610-3.245) | 0.65 | 0.422 |
| CT | 117 (38%) | 35 (38.5%) | 1.076 (0.654-1.768) | 0.08 | 0.774 | |
| TT | 169 (55%) | 47 (51.6%) | Ref | |||
| CC+CT vs.TT | 1.130 (0.708-1.805) | 0.26 | 0.609 | |||
| Allele | ||||||
| C | 163 (26.4%) | 53 (29.1%) | 1.147 (0.795-1.654) | 0.54 | 0.463 | |
| rs2276201 | T CC | 455 (73.6%) 62 (20.1%) | 129 (70.9%) 18 (20%) | 0.811 (0.421-1.561) | 0.39 | 0.530 |
| CT | 152 (49.2%) | 39 (43%) | 0.717 (0.423-1.214) | 1.54 | 0.214 | |
| TT | 95 (30.7%) | 34 (37%) | Ref | |||
| CC+CT vs.TT | 0.744 (0.457-1.213) | 1.41 | 0.235 | |||
| Allele | ||||||
| C | 276 (44.7%) | 75 (41.2%) | 0.869 (0.621-1.214) | 0.68 | 0.409 | |
| T | 342 (55.3%) | 107 (58.8%) |
Bold letter represents risk allele.
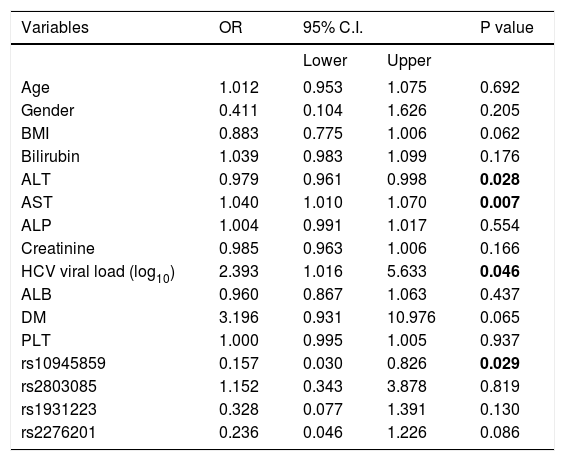
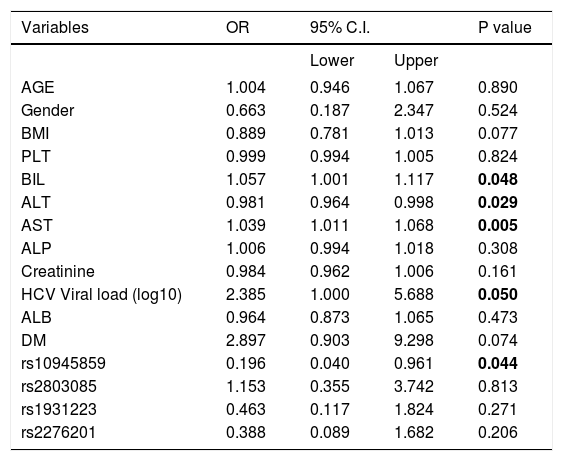
In addition, several independent factors contributing to cirrhosis were evaluated in the stepwise multivariate regression analysis (Table 6). The analysis showed that ALT (OR = 0.979; 95% C. I. = 0.961-0.998; p = 0.028), AST (OR = 1.040; 95% C. I. = 1.010-1.070; p = 0.007), viral load (OR = 2.393; 95% C. I. = 1.016-5.633; p = 0.046) and rs10945859 (OR = 0.157; 95% C. I. = 0.030-0.826; p = 0.029) were independently associated with HCV-associated cirrhosis. Next, the multivariate regression analysis was performed on both cirrhotic and HCC patients combined (Table 7). The results revealed that BIL (OR = 1.057; 95% C. I. 1.001-1.117; p = 0.048), ALT (OR = 0.981; 95% C. I. = 0.964-0.998; p = 0.029), AST (OR = 1.039; 95% C. I. = 1.011-1.068; p = 0.005), HCV viral load (OR = 2.385; 95% C. I. = 1.000-5.688; p = 0.050) and rs10945859 (OR = 0.196; 95% C. I. = 0.040-0.961; p = 0.044) were independently associated with cirrhosis and HCC.
Multiple logistic regressions of PARK2 polymorphisms among chronic HCV patients and patients diagnosed with cirrhosis.
| Variables | OR | 95% C.I. | P value | |
|---|---|---|---|---|
| Lower | Upper | |||
| Age | 1.012 | 0.953 | 1.075 | 0.692 |
| Gender | 0.411 | 0.104 | 1.626 | 0.205 |
| BMI | 0.883 | 0.775 | 1.006 | 0.062 |
| Bilirubin | 1.039 | 0.983 | 1.099 | 0.176 |
| ALT | 0.979 | 0.961 | 0.998 | 0.028 |
| AST | 1.040 | 1.010 | 1.070 | 0.007 |
| ALP | 1.004 | 0.991 | 1.017 | 0.554 |
| Creatinine | 0.985 | 0.963 | 1.006 | 0.166 |
| HCV viral load (log10) | 2.393 | 1.016 | 5.633 | 0.046 |
| ALB | 0.960 | 0.867 | 1.063 | 0.437 |
| DM | 3.196 | 0.931 | 10.976 | 0.065 |
| PLT | 1.000 | 0.995 | 1.005 | 0.937 |
| rs10945859 | 0.157 | 0.030 | 0.826 | 0.029 |
| rs2803085 | 1.152 | 0.343 | 3.878 | 0.819 |
| rs1931223 | 0.328 | 0.077 | 1.391 | 0.130 |
| rs2276201 | 0.236 | 0.046 | 1.226 | 0.086 |
Multiple logistic regressions of PARK2 polymorphisms among chronic HCV patients and patients diagnosed with cirrhosis and HCC.
| Variables | OR | 95% C.I. | P value | |
|---|---|---|---|---|
| Lower | Upper | |||
| AGE | 1.004 | 0.946 | 1.067 | 0.890 |
| Gender | 0.663 | 0.187 | 2.347 | 0.524 |
| BMI | 0.889 | 0.781 | 1.013 | 0.077 |
| PLT | 0.999 | 0.994 | 1.005 | 0.824 |
| BIL | 1.057 | 1.001 | 1.117 | 0.048 |
| ALT | 0.981 | 0.964 | 0.998 | 0.029 |
| AST | 1.039 | 1.011 | 1.068 | 0.005 |
| ALP | 1.006 | 0.994 | 1.018 | 0.308 |
| Creatinine | 0.984 | 0.962 | 1.006 | 0.161 |
| HCV Viral load (log10) | 2.385 | 1.000 | 5.688 | 0.050 |
| ALB | 0.964 | 0.873 | 1.065 | 0.473 |
| DM | 2.897 | 0.903 | 9.298 | 0.074 |
| rs10945859 | 0.196 | 0.040 | 0.961 | 0.044 |
| rs2803085 | 1.153 | 0.355 | 3.742 | 0.813 |
| rs1931223 | 0.463 | 0.117 | 1.824 | 0.271 |
| rs2276201 | 0.388 | 0.089 | 1.682 | 0.206 |
Haplotype analysis for these SNPs was performed to calculate the frequency of occurrence in HCV-infected patients (groups I, II and III) in comparison to the healthy controls. None of the eight haplotypes observed showed any significant association with increased susceptibility to HCV infection (Supplementary table 1). Other haplotype analyses were also performed including chronic HCV patients (group I) vs. cirrhosis patients (group II), chronic HCV patients (group I) vs. HCC patients (group III) and chronic HCV patients (group I) vs. cirrhotic and HCC patients (groups II and III). None of these analyses showed any statistically significant association (data not shown).
DiscussionAlthough the number of newly infected HCV cases has declined in Saudi Arabia in the last few years, diseases associated with the virus still pose a great financial and social burden on the health system, especially among certain patient population such as hemodialysis patients and intravenous drug users. It is estimated that the prevalence of HCV in Saudi population is nearly 1.8 % and the most dominant genotype is G4 followed by G1 and G3.38–40
Clinical outcome of HCV infection is determined by a network of interaction between host immune system, viral characteristics and environmental conditions. Several immune-related molecules, i.e. cytokines and chemokines, are hypothesized to play a crucial role in regulating anti-HCV immune responses that could ultimately determine the outcome of HCV infection.41 The effect of such modulatory molecules depends largely on several factors including genetic variations and their expression activity profiles. Previous studies have shown that genetic variants that could confer a significant risk towards HCV infection are localized in genes involved in the activation of immune response.42,43
We conducted this study to evaluate the effect of genetic variation in PARK2 gene area on the progression of HCV-related diseases. One of the most crucial steps in conducting a candidate gene study is to identify a suitable gene that is likely to be involved in the disease under investigation. In this study, PARK2 was selected as it is part of the complex that is required for polyubiquitination of proteins which are destined for degradation by the proteasome.23 Strong evidence has suggested that polyubiquitination is an important mechanism that regulates the interaction of host cells with HCV proteins. It has been shown that polyubiquitination of NS5A and NS5B of HCV accelerates the degradation of both proteins by proteasome-dependent pathway. Such mechanism is suggested to regulate HCV replication by controlling the rate of degradation of NS5A and/or NS5B.44,45
The allele frequency of PARK2 SNPs in Saudi subjects included in this study was also determined. MAF values observed were 0.24, 0.22, 0.42 and 0.28 for rs10945859, rs2803085, rs2276201 and rs1931223, respectively.
In the present study, the possible association of four SNPs, rs10945859, rs2803085, rs2276201 and rs1931223 in PARK2 gene, with HCV infection and its progression to cirrhosis and HCC was investigated. The most important finding in this study is that the heterozygous CT genotype of SNP rs10945859 was found to have a significant association with HCV infection and its progression to cirrhosis and HCC, thereby, indicating the possibility of using it as a genetic marker to predict the progression of HCV-associated liver complications. However, this observation needs to be confirmed in a larger group of patients and in different ethnic populations. Also, this genetic link needs to be substantiated by experimental evidence to identify functional significance and possible mechanism(s) through which this variant might contribute to liver abnormalities in HCV-infected patients.
Further evidence that supports the observation that rs10945859 might modulate the progression of HCV-associated diseases was established from the logistic multivariate analysis.
The results in this study indicated that rs10945859 remained independently associated with cirrhosis and cirrhosis/HCC in logistic regression analysis, that included several independent factors known to be important for HCV infection.
It is well-known that analysis using haplotypes of multiple linked markers is more informative than single markers.46 In the present study, analysis based on haplotypes using all four SNPs did not show any evidence of association with HCV infection. This was also true when the analysis was performed involving any of the patient groups. Such results suggest that PARK2 haplotypes for the examined SNPs do not play a major role in HCV infection and its related complications in Saudi patients analyzed, emphasizing the need for additional investigations in a larger sample size from different populations.
Recently, a myriad of studies have been carried out to understand the role of various SNPs in HCV infection. The role of IL28B genetic variations in response to treatment and HCV clearance has been well established in various populations that are ethnically distinct.47–49 Other studies have demonstrated that DRB1★01, DQB1★03, and DQB1★05 were associated with viral clearance in Midwestern Americans.50 A large study was conducted on Caucasians and Black Americans, in which HLA-A1101 and HLA-B57 was found to be significantly more frequent in individuals with well-documented HCV clearance compared to chronically-infected patients.51 More recently, DEPDC5 was found to have significant association with progression of liver-related diseases in HCV-infected patients.19
Genetic variations in PARK2 gene were identified as genetic risk factors for leprosy in several ethnically distinct populations. PARK2_e01 (-2599) and rs1040079 SNPs were found to be the two most significantly associated variants with leprosy.28 However, there was a significant difference in the prevalence of the T allele of PARK2_e01 (-2599) between ethnically distinct populations and in its clinical significance as a genetic risk factor in leprosy infection.27 Other studies have suggested that the T allele of the PARK2_e01(-2599) polymorphism is significantly associated with typhoid and paratyphoid fever when patients were compared to randomly selected community uninfected control individuals.52 Furthermore, in vitro studies have suggested a possible role of PARK2 gene in Salmonella pathogenesis and possible modulation of the intracellular bacterial evasion mechanisms during the infection.53,54
In conclusion, significant association was found between CT genotype of SNP rs10945859 of PARK2 gene and HCV-associated liver complications. This genetic variant could be considered as a predisposing genetic factor in progression of disease in HCV-infected patients. SNP rs10945859 of PARK2 gene can be a useful predictor of clinical outcome of HCV infection and help in identifying individuals at high risk of developing HCV-related liver complications. However, these findings need to be replicated in a larger sample of patients and the functional aspects need to be substantiated to fully exploit the importance of PARK2 rs10945859 in HCV infection.
SupportThis study was supported in part by a grant from King Abdulaziz City for Science and Technology, project no. ARP-27-18 and was approved by the Research Advisory Council (RAC) of King Faisal Specialist Hospital and Research Centre, RAC no. 2060040.
AcknowledgmentsThe support of the Research Center administration at King Faisal Specialist Hospital and Research Center is highly appreciated. The authors are grateful to Hanan Shaarawi and Maureene Delos Reyes for secretarial and logistic assistance.


