


Glucocorticoid resistance frequently associating with inflammation, may severely compromise the therapeutic effect of glucocorticoids. In this study, we aimed to investigate the regulation of glucocorticoid resistance by microRNA-124a (miR-124a) in patients with acute-on-chronic liver failure (ACLF).
Materials and methodsThe miR-124a levels and glucocorticoid receptor alpha (GRα) expressions in peripheral blood monocytes and liver tissues were measured by quantitative reverse transcription–polymerase chain reaction (qRT-PCR), flow cytometry, and western blot analyses in the following four groups: healthy controls (HC), moderate chronic hepatitis B (CHB) patients, hepatitis B virus-related ACLF (HBV-ACLF) patients, and alcohol-induced ACLF (A-ACLF) patients. In addition, the serum miR-124a levels and multiple biochemical indices were determined. The effects of miR-124a transfection on GRα expression were assayed by qRT-PCR and western blotting in U937 and HepG2 cells stimulated with lipopolysaccharide (LPS).
ResultsCompared with the CHB patients and HC, the miR-124a levels in HBV-ACLF and A-ACLF patients increased, while GRα expressions decreased. No significant differences in miR-124a levels and GRα expressions were observed between the HBV-ACLF and A-ACLF patients. For the ACLF patients, miR-124a level was negatively related to GRα expression in monocytes and positively correlated with the inflammatory factors such as interleukin-1 beta (IL-1β), interleukin-6 (IL-6) and tumor necrosis factor alpha (TNF-α). In U937 and HepG2 cells, LPS stimulated miR-124a levels but inhibited GRα expressions; meanwhile, increasing miR-124a levels reduced GRα expressions, and inhibiting miR-124a levels increased GRα expressions.
ConclusionsThis study provides evidence that GRα expression was negatively regulated by miR-124a, which primarily determines the extent of acquired glucocorticoid resistance in ACLF.
Acute-on-chronic liver failure (ACLF) is a severe complication in patients who experience an acute insult to a chronically injured liver with or without cirrhosis, leading to the failure of vital functions. ACLF features acute hepatic decompensation (jaundice elevation and prolongation of the international normalized ratio), which often accompanied with one or more extrahepatic organ failures. ACLF frequently results in a mortality of 50–90% within 3 months of onset [1] and imposes immense healthcare expenditures. Globally, hepatitis B reactivation and exacerbation of alcoholic hepatitis represent two major ACLF etiologies [2]. Liver transplantation is the preferred treatment option, but it is limited by the shortage of donor livers and the high expenses associated with the procedures. Thus, early blockade of the progression of chronic liver disease as well as prevention of an acute insult are critical to reduce the incidence of ACLF.
The development of ACLF seems to involve a “triple strike” of immune injury, microcirculatory disorder and endotoxemia. Glucocorticoids are often prescribed to mitigate ACLF because of their known anti-inflammatory, anti-toxic and immunosuppressive nature [3]. However, the benefits of glucocorticoids therapy for ACLF remain controversial. For instance, several studies have noted that glucocorticoids therapy neither improves the overall survival of ACLF patients nor extends the survival time after liver transplantation. Importantly, glucocorticoids therapy has been shown an increase risk of sepsis [4,5]. Further investigations have found that some ACLF patients have a low sensitivity to glucocorticoids treatment [6]. In addition, it is known that many inflammatory diseases lead to a decrease in the expression of glucocorticoid receptor alpha (GRα), the classic receptor that binds glucocorticoids to mediate their transcriptional activities, which confers glucocorticoid resistance and undermines glucocorticoid therapy efficacy. Clearly, glucocorticoid resistance is often acquired through persistent inflammatory injury [6–9].
Recent studies indicate that microRNAs, small non-coding RNA molecules of 20–24 nucleotides, can negatively regulate targeted gene expression at the posttranscriptional or posttranslational level. They are implicated in the regulation of glucocorticoid resistance through several mechanisms, including reduced GRα expression [10]. miR-124a may confer glucocorticoid resistance by reducing GRα mRNA expression [11,12]. However, the miR-124a level and its functions in acquiring glucocorticoid resistance among ACLF patients have not been elucidated. In this study, we investigated miR-124a regulated GRα expression and analyzed the possible relationship between miR-124a level and inflammatory injury in ACLF.
2Materials and methods2.1Patients and liver tissue samplingFrom November 2016 to January 2018, 50 subjects admitted to the Third Affiliated Hospital, Hebei Medical University, were enrolled in this study. The diagnoses of moderate chronic hepatitis B (CHB) and ACLF were made according to the guidelines for CHB and ACLF management by the American Association for the Study of Liver Diseases [1,13]. None of the included subjects had any infection or other serious diseases. The study protocol was approved by the Institutional Medical Ethics Committee of the Third Affiliated Hospital, Hebei Medical University. Informed consents were obtained from all subjects, without affecting the pathological diagnosis, clinical testing, or treatment. The 50 subjects, include 13 healthy controls (HC), 13 patients with moderate CHB, 14 patients with hepatitis B virus-related acute-on-chronic liver failure (HBV-ACLF), and 10 patients with alcohol-induced acute-on-chronic liver failure (A-ACLF), were enrolled in this study. Five ACLF subjects (three from the HBV-ACLF group and two from A-ACLF group) received liver transplantation. The liver tissue samples required for the experiment were obtained during the liver transplantation after acquiring the informed consents from five ACLF subjects receiving liver transplantation surgery and five liver donors or their guardians.
2.2Blood sample collection and isolation of CD14+ cellsWhen the subjects were diagnosed with ACLF without infection or other serious diseases, single blood samples (10mL each) were collected at 6:00–7:00AM into ethylene diamine tetraacetic acid-coated vacuum tubes before pharmacotherapy, liver transplantation, artificial extracorporeal liver therapy, or transfusion of blood components. Blood samples were centrifuged at 2500rpm for 10min and then handled in a biohazard safety cabinet. A 2-mL sample of plasma was transferred into a cryovial under sterile conditions and stored at −80°C until analysis. Peripheral blood mononuclear cells (PBMCs) were separated by density gradient medium (Lympholyte-H, Cedarlane, Canada), and CD14+ monocytes were isolated from PBMCs by positive selection with magnetic-activated cell sorting (MiniMACS™ Starting Kits, Miltenyi Biotec, Germany). The density of CD14+ monocytes obtained by cytometer (IC1000Countstar, China) varied from 2×10⁶/mL to 4×10⁶/mL. Half of the CD14+ monocytes were used for the isolation of total RNA, which was immediately synthesized into cDNA and stored at −80°C until polymerase chain reaction (PCR) analysis; the other half was frozen in medium containing 10% dimethyl sulfoxide and stored in liquid nitrogen until flow cytometric analysis.
2.3Cell culture and inflammation modelsU937 cells (human histiocytic lymphoma cells) and HepG2 cells (hepatocellular carcinoma cells) were purchased from Procell Life Science & Technology Co., Ltd. (Wuhan, China). U937 cells were cultured in RPMI-1640 medium (Gibco, Waltham, MA, USA) supplemented with 5% fetal bovine serum (Gemini Bio-products, West Sacramento, CA, USA), 100U/mL penicillin, and 100μg/mL streptomycin. HepG2 cells were grown in Dulbecco's modified Eagle medium containing 4.5g/L d-glucose (Gibco, Waltham, MA, USA), 6% fetal bovine serum, 100U/mL penicillin, and 100μg/mL streptomycin. All cells were cultured in an incubator at 37°C with 95% humidity and 5% CO2.
In the cellular inflammation model, U937 cells and HepG2 cells were incubated with lipopolysaccharide (LPS, Sigma–Aldrich, USA) at concentrations of 100, 300, and 500ng/mL or only with the control vehicle for 24h.
2.4Cell transfectionThe sequence of the miR-124-3p mimic was 5′-CAUUCACCGCGUGCCUUATT-3′, and the sequence of the miR-124-3p inhibitor was 5′-GGCAUUCACCGCGUGCCUUA-3′. miR-124-3p mimic (MC10691, Ambion, USA), miR-124-3p inhibitor (MH10691, Ambion, USA) and the relevant controls of micrON™ Mimic Negative Control (miR01101-1-5, RiboBio, China) and micrOFF™ inhibitor Negative Control (miR02101-1-5, RiboBio, China) were transfected into U937 cells and HepG2 cells respectively, which were mixed with Lipofectamine® RNAiMAX Reagent (Invitrogen, USA). The efficiency of overexpression and knockdown of miR-124a was determined using a reverse transcription–PCR assay.
2.5Quantitative reverse transcription–polymerase chain reaction (qRT-PCR)Total RNA was extracted from CD14+ monocytes, liver tissue, and cultured cells using a miRNeasy Mini Kit (Qiagen) or from plasma using a miRNeasy Serum/Plasma Kit (Qiagen, Hilden, Germany). RNA was converted to cDNA using a PrimeScript™ RT reagent Kit (Takara, Dalian China) and a miScript II RT Kit (Qiagen, Hilden, Germany). The qRT-PCR assay was performed using a QuantiNova™ SYBR® Green PCR Kit (Qiagen, Hilden, Germany). The 2–ΔΔCt method was used to calculate the relative expression of GRα, which was normalized to that of β-actin as the endogenous control. miR-124a level was detected by qPCR with a miScript SYBR® Green PCR kit (Qiagen, Hilden, Germany) and the miR-124a primer (Qiagen, USA). U6 (Qiagen, USA) was used as the endogenous control. Lyophilized C. elegans miR-39 miRNA mimic (Qiagen, USA) was used as the miRNeasy Serum/Plasma Spike-In Control for normalization. All assays were performed in triplicate. The following primer sequences were used: β-Actin (Invitrogen, USA), 5′-GTCACCTTCACCGTTCCAGTTTT-3′ (Forward) and 5′-CTTAGTTGCSGTTACACCCTTTCTT-3′ (Reverse); GRα (Invitrogen, USA), 5′-AGCSCATTGTCAAGAGGGAAG-3′ (Forward) and 5′-AGCSAATAGTTAAGGAGATTTTCAACC-3′ (Reverse). (Note: the primer sequences of miR-124a, U6, and miR-39 are not published)
2.6Enzyme-linked immunosorbent assay (ELISA)The levels of interleukin-1 beta (IL-1β), interleukin-6 (IL-6), and tumor necrosis factor alpha (TNF-α) in the cell culture supernatants and ACLF patients plasma were quantified using human IL-1β, IL-6, and TNF-α ELISA kits (Proteintech, USA), respectively.
2.7Flow cytometryThe isolated CD14+ monocytes were fixed and permeated using the Transcription Factor Buffer Set (BD, San Jose, CA, USA) and stained with primary anti-GRα antibody (Abcam, Cambridge, UK) and fluorescence-conjugated secondary antibody (Alexa Flour® 488, Abcam, Cambridge, UK). The isotype antibody (Abcam, Cambridge, UK) was used as a control.
2.8Western blotLiver tissue, U937 cells, and HepG2 cells were homogenized in the presence of radioimmunoprecipitation lysis buffer (Solarbio, Beijing, China). Proteins in the cell lysates were separated by sodium dodecyl sulfate–polyacrylamide gel electrophoresis and transferred to nitrocellulose membranes (Millipore, Bedford, MA, USA). The membranes were probed with anti-GRα and anti-β-Actin (Abcam, Cambridge, UK). Signals were visualized by enhanced chemiluminescence reagents (Vazyme, Nanjing, China).
2.9Statistical analysisQuantitative data are presented as the mean±standard deviation or median (interquartile range). Comparisons were made among three groups or more by one-way analysis of variance with Tukey's honestly significant difference test and the Kruskal–Wallis test. Spearman's correlation coefficient and Pearson's correlation coefficient were calculated to determine any correlation between two variables. Significance was considered when P<0.05 (SPSS, version 21.0).
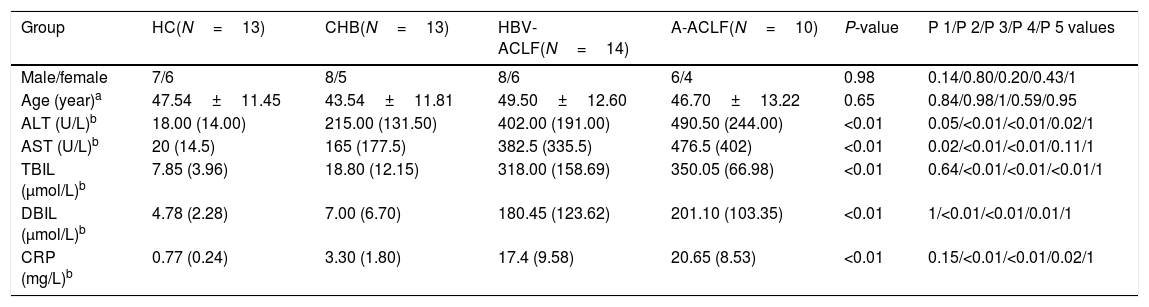
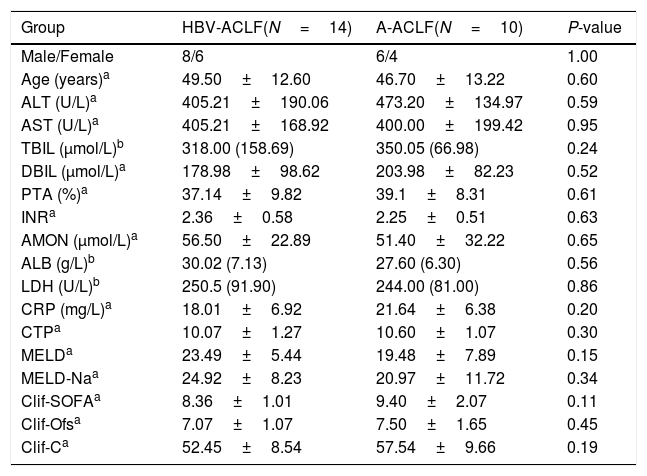
3Results3.1Demographic and clinical characteristics of the enrolled subjectsNo difference was noted in the age or gender ratio among the four groups (HC, CHB, HBV-ACLF, and A-ACLF) of the 50 enrolled subjects. As expected, the HBV-ACLF group was associated with more severe liver disease, as indicated by higher levels of alanine aminotransferase (ALT) (P<0.01), aspartate aminotransferase (AST) (P<0.01), total bilirubin (TBIL) (P<0.01), direct bilirubin (DBIL) (P<0.01), and C-reactive protein (CRP) (P<0.01), compared to the HC and CHB groups (Table 1). However, no significant difference was detected in the severity of liver disease between the HBV-ACLF and A-ACLF groups (Table 2).
Demographic and clinical characteristics of all enrolled subjects.
| Group | HC(N=13) | CHB(N=13) | HBV-ACLF(N=14) | A-ACLF(N=10) | P-value | P 1/P 2/P 3/P 4/P 5 values |
|---|---|---|---|---|---|---|
| Male/female | 7/6 | 8/5 | 8/6 | 6/4 | 0.98 | 0.14/0.80/0.20/0.43/1 |
| Age (year)a | 47.54±11.45 | 43.54±11.81 | 49.50±12.60 | 46.70±13.22 | 0.65 | 0.84/0.98/1/0.59/0.95 |
| ALT (U/L)b | 18.00 (14.00) | 215.00 (131.50) | 402.00 (191.00) | 490.50 (244.00) | <0.01 | 0.05/<0.01/<0.01/0.02/1 |
| AST (U/L)b | 20 (14.5) | 165 (177.5) | 382.5 (335.5) | 476.5 (402) | <0.01 | 0.02/<0.01/<0.01/0.11/1 |
| TBIL (μmol/L)b | 7.85 (3.96) | 18.80 (12.15) | 318.00 (158.69) | 350.05 (66.98) | <0.01 | 0.64/<0.01/<0.01/<0.01/1 |
| DBIL (μmol/L)b | 4.78 (2.28) | 7.00 (6.70) | 180.45 (123.62) | 201.10 (103.35) | <0.01 | 1/<0.01/<0.01/0.01/1 |
| CRP (mg/L)b | 0.77 (0.24) | 3.30 (1.80) | 17.4 (9.58) | 20.65 (8.53) | <0.01 | 0.15/<0.01/<0.01/0.02/1 |
ALT, alanine aminotransferase; AST, aspartate aminotransferase; TBIL, total bilirubin; DBIL, direct bilirubin; CRP, C reactive protein.
Demographic and clinical characteristics of the ACLF subjects.
| Group | HBV-ACLF(N=14) | A-ACLF(N=10) | P-value |
|---|---|---|---|
| Male/Female | 8/6 | 6/4 | 1.00 |
| Age (years)a | 49.50±12.60 | 46.70±13.22 | 0.60 |
| ALT (U/L)a | 405.21±190.06 | 473.20±134.97 | 0.59 |
| AST (U/L)a | 405.21±168.92 | 400.00±199.42 | 0.95 |
| TBIL (μmol/L)b | 318.00 (158.69) | 350.05 (66.98) | 0.24 |
| DBIL (μmol/L)a | 178.98±98.62 | 203.98±82.23 | 0.52 |
| PTA (%)a | 37.14±9.82 | 39.1±8.31 | 0.61 |
| INRa | 2.36±0.58 | 2.25±0.51 | 0.63 |
| AMON (μmol/L)a | 56.50±22.89 | 51.40±32.22 | 0.65 |
| ALB (g/L)b | 30.02 (7.13) | 27.60 (6.30) | 0.56 |
| LDH (U/L)b | 250.5 (91.90) | 244.00 (81.00) | 0.86 |
| CRP (mg/L)a | 18.01±6.92 | 21.64±6.38 | 0.20 |
| CTPa | 10.07±1.27 | 10.60±1.07 | 0.30 |
| MELDa | 23.49±5.44 | 19.48±7.89 | 0.15 |
| MELD-Naa | 24.92±8.23 | 20.97±11.72 | 0.34 |
| Clif-SOFAa | 8.36±1.01 | 9.40±2.07 | 0.11 |
| Clif-Ofsa | 7.07±1.07 | 7.50±1.65 | 0.45 |
| Clif-Ca | 52.45±8.54 | 57.54±9.66 | 0.19 |
ALT, alanine aminotransferase; AST, aspartate aminotransferase; TBIL, total bilirubin; DBIL, direct bilirubin; PTA, prothrombin time activity; INR, international normalized ratio; AMON, ammonia; ALB, albumin; LDH, lactate dehydrogenase; CRP, C reactive protein; CTP, Child-Turcotte-Pugh; MELD, Model for End-stage Liver Disease Score; MELD-Na, Model for End-stage Liver Disease-Na score; Clif-SOFA, chronic liver failure-sequential organ failure assessment score; Clif-Ofs, chronic liver failure organ failure score system; Clif-C, chronic liver failure Consortium Acute on Chronic Liver Failure score.
A reduced GRα expression in the T lymphocytes isolated from HBV-ACLF patients has been observed 6. In this study, the relative GRα mRNA expression in peripheral monocytes followed the order of HBV-ACLF group<CHB group<HC group (P<0.01, Fig. 1A). However, there was no significant difference in the GRα mRNA expression between the HBV-ACLF and A-ACLF groups (P=0.972, Fig. 1B). The changes in the GRα protein expression level detected by flow cytometry reflected the differences determined by qRT-PCR (P<0.01, Fig. 1C; P<0.01, Fig. 1D). The relative expression levels of GRα mRNA and protein in liver tissue in the two ACLF groups were lower than the HC group (P<0.01, Fig. 1E; P<0.01, Fig. 1F), suggesting that both the HBV-ACLF and A-ACLF patients acquired glucocorticoid resistance associated with lower GRα expression level.
 The relative expression levels of GRα mRNA in monocytes from the HC, CHB, HBV-ACLF, and A-ACLF groups, as determined by RT-PCR analysis, were compared. (C, D) Frozen monocytes were stained with GRα-specific antibody. Representative staining of GRα in monocytes from the HC, CHB, HBV-ACLF, and A-ACLF groups, as determined by flow cytometric analysis, were compared by mean fluorescence intensity (MFI) evaluation. (E) The relative expression levels of GRα mRNA in liver tissues from the HC and ACLF groups, as determined by RT-PCR analysis, were compared. (F) The expression levels of GRα protein components in liver tissues from the HC and ACLF groups, as analyzed quantitatively by western blot, were compared. The symbol ** indicates P<0.01 between groups.")
GRα is downregulated in the monocytes and liver tissue from ACLF patients. (A, B) The relative expression levels of GRα mRNA in monocytes from the HC, CHB, HBV-ACLF, and A-ACLF groups, as determined by RT-PCR analysis, were compared. (C, D) Frozen monocytes were stained with GRα-specific antibody. Representative staining of GRα in monocytes from the HC, CHB, HBV-ACLF, and A-ACLF groups, as determined by flow cytometric analysis, were compared by mean fluorescence intensity (MFI) evaluation. (E) The relative expression levels of GRα mRNA in liver tissues from the HC and ACLF groups, as determined by RT-PCR analysis, were compared. (F) The expression levels of GRα protein components in liver tissues from the HC and ACLF groups, as analyzed quantitatively by western blot, were compared. The symbol ** indicates P<0.01 between groups.
Contrary to the lower GRα expression level, the miR-124a level in peripheral monocytes and plasma followed the order of HBV-ACLF group>CHB group>HC group (P<0.01, Fig. 2A and B). However, no significant difference in the miR-124a levels was detected between the HBV-ACLF and A-ACLF groups (P=0.654, Fig. 2C; P=0.789, Fig. 2D). In addition, the hepatic miR-124a level in the ACLF group was higher than in the HC group (P<0.01, Fig. 2E).
 The relative expression levels of miR-124a in monocytes from the HC, CHB, HBV-ACLF, and A-ACLF groups, as determined by RT-PCR analysis, were compared. (C, D) The relative expression levels of miR-124a in plasma from the HC, CHB, HBV-ACLF, and A-ACLF groups, as determined by RT-PCR analysis, were compared. (E) The relative expression levels of miR-124a in liver tissues from the HC and ACLF groups, as determined by RT-PCR analysis, were compared. The symbol ** indicates P<0.01 between groups.")
miR-124a is upregulated in the monocytes, plasma, and liver tissue from ACLF patients. (A, B) The relative expression levels of miR-124a in monocytes from the HC, CHB, HBV-ACLF, and A-ACLF groups, as determined by RT-PCR analysis, were compared. (C, D) The relative expression levels of miR-124a in plasma from the HC, CHB, HBV-ACLF, and A-ACLF groups, as determined by RT-PCR analysis, were compared. (E) The relative expression levels of miR-124a in liver tissues from the HC and ACLF groups, as determined by RT-PCR analysis, were compared. The symbol ** indicates P<0.01 between groups.
It has been shown that miR-124a targeted GRα mRNA and reduced GRα expression [11,12]. As expected, a higher miR-124a level inversely correlated with the GRα mRNA expression. Comparing to the other groups, the mean fluorescence intensity (MFI) of GRα protein expression in peripheral monocytes from ACLF patients was lower, while miR-124a expression was higher. These findings suggest that miR-124a may be used as a biomarker for acquired glucocorticoid resistance (P<0.01, Fig. 3A).
 Scatter plots showing the statistically significant correlation in the relative miR-124a levels, the relative expressions of GRα mRNA, and the mean fluorescence intensity (MFI) of GRα protein in monocytes from 24 ACLF patients. (B) Cluster analysis of plasma/serum indicators and prognosis scores in ACLF patients. ALT, alanine aminotransferase; AST, aspartate aminotransferase; ALB, albumin; LDH, lactate dehydrogenase; INR, international normalized ratio; ClifC, chronic liver failure Consortium Acute on Chronic Liver Failure score; ClifSOFA, chronic liver failure-sequential organ failure assessment score; ClifOfs, chronic liver failure organ failure score system; MELDNa, Model for End-stage Liver Disease-Na score; MELD, Model for End-stage Liver Disease Score; CRP, C reactive protein; DBIL, direct bilirubin; TBIL, total bilirubin; AMON, ammonia; CTP, Child-Turcotte-Pugh; PTA, prothrombin time activity; TNFα, Tumor Necrosis Factor-α; IL1β, Interleukin 1β; IL6, Interleukin 6. (C) Multivariate linear regression analysis of IL-1β (pg/mL), IL-6 (pg/mL), and TNF-α (pg/mL) with the relative miR-124a level in the plasma from 24 ACLF patients.")
miR-124a is upregulated in monocytes, plasma, and liver tissue from ACLF patients. (A) Scatter plots showing the statistically significant correlation in the relative miR-124a levels, the relative expressions of GRα mRNA, and the mean fluorescence intensity (MFI) of GRα protein in monocytes from 24 ACLF patients. (B) Cluster analysis of plasma/serum indicators and prognosis scores in ACLF patients. ALT, alanine aminotransferase; AST, aspartate aminotransferase; ALB, albumin; LDH, lactate dehydrogenase; INR, international normalized ratio; ClifC, chronic liver failure Consortium Acute on Chronic Liver Failure score; ClifSOFA, chronic liver failure-sequential organ failure assessment score; ClifOfs, chronic liver failure organ failure score system; MELDNa, Model for End-stage Liver Disease-Na score; MELD, Model for End-stage Liver Disease Score; CRP, C reactive protein; DBIL, direct bilirubin; TBIL, total bilirubin; AMON, ammonia; CTP, Child-Turcotte-Pugh; PTA, prothrombin time activity; TNFα, Tumor Necrosis Factor-α; IL1β, Interleukin 1β; IL6, Interleukin 6. (C) Multivariate linear regression analysis of IL-1β (pg/mL), IL-6 (pg/mL), and TNF-α (pg/mL) with the relative miR-124a level in the plasma from 24 ACLF patients.
MicroRNAs, which can be secreted into the bloodstream by packing into extracellular vesicles, (i.e. microvesicles and exosomes) or released by necrotic or apoptotic cells, became detectable in the peripheral blood [14]. Previous studies have shown that the plasma miR-124 level was higher and positively correlated with the degree of hepatic necroinflammation in patients with chronic HBV infection [15]. Yet, no clear explanation was provided. Our study showed that the inflammatory cytokine levels of IL-1β, IL-6, and TNF-α were closely related to the plasma miR-124a level (Fig. 3B), as determined by multivariate linear regression analysis of IL-1β, IL-6, TNF-α, and miR-124a levels in plasma (R2=0.923, P<0.01, Fig. 3C).
3.5LPS reduced GRα expression by increasing miR-124a expressionTo further evaluate whether inflammation can induce glucocorticoid resistance and increase miR-124a level, LPS was added to cultured U937 and HepG2 cells. RT-PCR and western blot analyses showed that, with the increase of LPS concentration, GRα expression decreased in the LPS-treated groups (Fig. 4A, C, and D), while the miR-124a level increased (Fig. 4B).
 The relative expressions of GRα mRNA between the control group and the groups with the addition of different LPS concentrations, as determined by qRT-PCR analysis, were compared in U937 and HepG2 cells. (B) The relative miR-124a levels between the control group and the groups with the addition of different LPS concentrations, as determined by qRT-PCR analysis, were compared in U937 and HepG2 cells. (C, D) The expressions of GRα protein components between the control group and the groups with the addition of different LPS concentrations, as determined by western blot analysis, were compared in U937 and HepG2 cells. The symbol * indicates P<0.05, and the symbol ** indicates P<0.01 between groups.")
LPS-mediated upregulation of miR-124a expression and downregulation of GRα expression in U937 and HepG2 cells. (A) The relative expressions of GRα mRNA between the control group and the groups with the addition of different LPS concentrations, as determined by qRT-PCR analysis, were compared in U937 and HepG2 cells. (B) The relative miR-124a levels between the control group and the groups with the addition of different LPS concentrations, as determined by qRT-PCR analysis, were compared in U937 and HepG2 cells. (C, D) The expressions of GRα protein components between the control group and the groups with the addition of different LPS concentrations, as determined by western blot analysis, were compared in U937 and HepG2 cells. The symbol * indicates P<0.05, and the symbol ** indicates P<0.01 between groups.
Transfection of U937 cells and HepG2 cells with a miR-124a mimic significantly increased the miR-124a level, accompanied by a decrease in the GRα expression compared to the negative control. Conversely, transfection with miR-124a inhibitor significantly decreased the miR-124a expression level (Fig. 5A), accompanied by an increase in the GRα expression (Fig. 5B–D).
 The relative levels of miR-124a between the control group and the LPS, miR-124a mimic, and miR-124a inhibitor groups treated with 500ng/mL LPS, as determined by qRT-PCR analysis, were compared in U937 cells and HepG2 cells. (B) The relative expressions of GRα mRNA between the control group and the LPS, miR-124a mimic, and miR-124a inhibitor groups treated with 500ng/mL LPS, as determined by qRT-PCR analysis, were compared in U937 cells and HepG2 cells. (C, D) Representative western blot bands showing the expressions of GRα, normalized to β-actin as an internal control, after transfection and LPS treatments in U937 cells and HepG2 cells. The symbol * indicates P<0.05, and the symbol ** indicates P<0.01 between groups.")
miR-124a downregulated GRα expression induced by LPS in U937 cells and HepG2 cells. (A) The relative levels of miR-124a between the control group and the LPS, miR-124a mimic, and miR-124a inhibitor groups treated with 500ng/mL LPS, as determined by qRT-PCR analysis, were compared in U937 cells and HepG2 cells. (B) The relative expressions of GRα mRNA between the control group and the LPS, miR-124a mimic, and miR-124a inhibitor groups treated with 500ng/mL LPS, as determined by qRT-PCR analysis, were compared in U937 cells and HepG2 cells. (C, D) Representative western blot bands showing the expressions of GRα, normalized to β-actin as an internal control, after transfection and LPS treatments in U937 cells and HepG2 cells. The symbol * indicates P<0.05, and the symbol ** indicates P<0.01 between groups.
Previous studies have shown that chronic inflammation reduced glucocorticoid (either exogenous glucocorticoid drugs or endogenous cortisol) sensitivity through reducing GRα expression [8]. A reduced GRα expression has been suggested to be the main reason for acquired glucocorticoid resistance [8,16]. In this study, we utilized LPS stimulation of U937 cells and HepG2 cells and established cellular inflammation models featuring a decrease in the GRα expression. In addition, we detected a decrease in the GRα expressions of peripheral monocytes and liver tissue from ACLF patients. ACLF is triggered by acute inflammation after persistent inflammation damage caused by chronic liver disease [17]. We speculate that further elevated inflammatory cytokine levels may further reduce GRα expression and facilitate acquired glucocorticoid resistance. A previous study has demonstrated that the GRα mRNA level in the T lymphocytes of HBV-ACLF patients was lower than that of CHB patients and HC [6]. In this study, we also found a decrease in the GRα expressions of peripheral monocytes and liver tissues from HBV-ACLF and A-ACLF patients. These results indicate that ACLF patients may have acquired glucocorticoid resistance, possibly resulting in a weak response to glucocorticoids therapy.
MicroRNAs demonstrate regulatory function through complementary binding to the 3′-untranslated region of target mRNAs, generally reducing the expression level of target genes. Recent studies have indicated that several microRNAs were involved in the reduction of glucocorticoid sensitivity, and one important mechanism was the decrease of GRα expression. Dual-luciferase reporter assays found miR-124a, miR-142-3p, miR-96, miR-101a and miR-433 bind to GRα mRNA specifically, which can be degraded, resulting in a decrease of GRα expression that confers glucocorticoid resistance [12,18,19]. Interestingly, various microRNAs were involved in different diseases, even in different stages of the same disease. Since microRNAs can be detected in the peripheral blood, they can possibly serve as biomarkers for predicting glucocorticoid resistance. In recent years, artificial microRNAs or inhibitors have been successfully utilized to silence or elevate the expression of target genes [20,21]. With the advancement of gene editing technology, it is conceivable that microRNAs can be targeted for mitigating glucocorticoid resistance.
Previous studies have suggested that the serum miR-124 level was higher and positively correlated with the severity of hepatic necroinflammation in patients with chronic HBV infection [15]. The results from our study showed that the inflammatory cytokines IL-1β, IL-6 and TNF-α were closely related to the miR-124a level in ACLF patients plasma. By increasing LPS concentrations in U937 cells and HepG2 cells, miR-124a level increased in a dose-dependent manner, which supported the suggestion that inflammatory injury increased the miR-124a level. In order to further determine the regulatory relationship between miR-124a and GRα expression, we treated LPS-stimulated U937 cells and HepG2 cells with miR-124a mimic or inhibitor, and the obtained data suggested that miR-124a negatively regulated GRα expression. These findings linked the miR-124a level with a weak response to glucocorticoids. We reasoned that an elevated miR-124a level was part of the inflammatory response in ACLF that might facilitate the establishment of glucocorticoid resistance [11,12]. Previous studies have shown that glucocorticoids induce a higher miR-124a level that, in turn, reduced GRα expression; this interdependent pathway negatively regulates GRα expression [22]. Under such a scenario, we cannot exclude the possibility that a persistently high endogenous cortisol level in plasma may induce glucocorticoid resistance in ACLF. In addition, GR mRNA was spliced to express GRα by splicing factors, including serine/arginine-rich protein (SRp) 20 and SRp40, also called serine/arginine-rich splicing factor (SRSF) 3 and SRSF5 [23]. miR-124a targeted and reduced the expression of SRp20/SRSF3 and SRp40/SRSF5 proteins, leading to the reduced expression of spliced GRα isoforms [24]. Taken together, several pathways possibly contribute to the miR-124a-mediated reduction of GRα expression in ACLF. The specific mechanisms are yet to be investigated.
5ConclusionsIn conclusion, our results demonstrated an inverse relationship between miR-124a level and GRα expression in both an inflammatory cell model and clinical samples from ACLF patients. As a potential glucocorticoid response predictor, detection of the serum miR-124a level may help to evaluate glucocorticoid sensitivity among ACLF patients and to guide personalized glucocorticoid treatments in the initial phase of ACLF.AbbreviationsMiR-124a microRNA-124a acute-on-chronic liver failure glucocorticoid receptor alpha quantitative reverse transcription–polymerase chain reaction healthy controls moderate chronic hepatitis B hepatitis B virus-related ACLF alcohol-induced ACLF lipopolysaccharide interleukin-1 beta interleukin-6 tumor necrosis factor alpha
This work was supported by the Hebei Province Natural Science Foundation, China [grant number H2016206550].
Conflict of interestThe authors have no conflicts of interest to declare.
Declarations of originalityThe work described has not been published previously, and its publication is approved by all authors and tacitly by the responsible authorities where the work was carried out.


