


There are inconsistent findings on the association between human non-alcoholic fatty liver disease (NAFLD) and vitamin D, perhaps due to insufficient specificity for gender and obesity status. We aimed to assess whether serum levels of 25-hydroxyvitamin D are associated with unexplained elevated alanine aminotransferase (ALT) in general population across gender and body mass index (BMI) levels.
Materials and methodsA cross-sectional analysis of a population-based cohort with a nationwide-distribution using electronic medical database. The population consisted of individuals aged 20–60 years who underwent blood tests for ALT and vitamin D.
ResultsA total of 82,553 subjects were included (32.5% men, mean age 43.91±10.15 years). The prevalence of elevated ALT was higher among men and women with vitamin D insufficiency or deficiency, but in multivariate analysis, adjusting for: age, BMI, serum levels of glucose, total cholesterol, triglycerides, statin use and season, only the association among men remained significant for the vitamin D deficiency category (OR=1.16, 95%CI 1.04–1.29, P=0.010). Stratification by BMI revealed that only among normal weight and overweight men vitamin D deficiency was associated with elevated ALT (OR=1.27, 95%CI 1.01–1.59, P=0.041 and OR=1.27, 95%CI 1.08–1.50, P=0.003, respectively). No independent association was shown among women at all BMI categories.
ConclusionsIn a “real-life” general population, the association between vitamin D deficiency and unexplained elevated ALT is specific for non-obese men. The clinical significance of vitamin D for human NAFLD should be further elucidated with attention for a modifying effect of gender and adiposity.
Non-alcoholic fatty liver disease (NAFLD) is the most common cause of liver disease worldwide, ranging from simple steatosis to non-alcoholic steatohepepatitis (NASH) and cirrhosis [1]. Similar to NAFLD, vitamin D deficiency is associated with obesity and sedentary lifestyle [2], and was suggested to play a role in the development of the metabolic syndrome, diabetes and cardiovascular diseases [3]. Emerging evidence suggests that vitamin D deficiency may play a role in the pathogenesis of human NAFLD [4], but with conflicting results [5]. Vitamin D acts as an anti-inflammatory and anti-fibrotic agent according to animal experiments and human studies [6–9]. A meta-analysis of observational studies demonstrated that compared to controls, NAFLD patients were more likely to be vitamin D deficient [10]. However, body fat content is significantly associated with vitamin D deficiency or insufficiency, due to the fact that large amounts of vitamin D are stored in the adipose tissue [11,12], making adiposity a major confounder. Indeed, a study carefully adjusting for adiposity (evaluated by dual energy X-ray absorptiometry), indicated no relationship between vitamin D levels and insulin resistance, the amount of liver fat, or the severity of NASH [13]. In contrast, in another study, vitamin D deficiency was, independently of BMI and metabolic syndrome, associated with NASH and fibrosis, but not with the grade of steatosis [14]. Further uncertainty is derived from randomized clinical trials, which failed to show beneficial effects of a high-dose vitamin D supplementation in terms of hepatic steatosis, NAFLD Activity Score (NAS), liver enzymes or insulin resistance [15,16]. In addition, the modifying effect of gender was rarely analyzed [17,18], since most studies only adjusted for gender but did not stratify by it. This additional analysis is important since NAFLD has been repeatedly shown to be more prevalent among men, and interactions between sex hormones, adipocytokines, insulin resistance, and varying adipose tissue distribution may lead to gender differences in pathogenesis and risk factors [19,20]. NAFLD is the most common cause of abnormal alanine aminotransferase (ALT) [21–23], which is a specific marker of liver injury [24], and in individuals with NAFLD, signals a higher likelihood for NASH [24]. Therefore, we aimed to assess whether vitamin D levels are associated with unexplained elevated serum ALT, which may be presumed mostly as NAFLD, at different BMI levels, among men and women separately in a large “real-life” population.
2MethodsA cross-sectional analysis of a population-based cohort with a nationwide-distribution was conducted using an electronic medical database derived from Maccabi Healthcare System (MHS). MHS is the second-largest health maintenance organization (HMO) in Israel, providing care to 2 million members, accounting for 25% of the population in country [25,26]. As described in a previous publication [27], MHS has developed a computerized information system used by a nationwide network of over 3500 independent physicians and 150 branches. Computerized patient consultations and prescription records are downloaded daily to a central computer. The HMO's member's diagnoses are entered in the electronic patient record by a physician in accordance with the International Classification of Diseases version 9 (ICD-9) criteria. Data on dispensed medication comes from the pharmacies. The data are highly valid and closely monitored by MHs’ accounting department. Users of statins were identified if they had at least one dispensed prescription of 3-hydroxy-3-methylgluraryl coenzyme A (HMG-CoA) reductase inhibitors (e.g., lovastatin, pravastatin, simvastatin, atorvastatin), as previously described [28].
The study protocol has been approved by the Assuta Health Systems Internal Review Board with a waiver of informed consent.
Included in the study were individuals aged 20–60 years who had undergone blood tests for ALT and vitamin D for any reason (obtained in a time gap of ±30 days at the maximum, 99%CI of the time gap from the ALT test was 0.4–0.5 days), anytime between 1997 and 2012, and had complete data on the major study variables. Individuals with pre-defined unreasonable or extreme values of one of the study variables were removed from the log file. Individuals excluded were those suspected as having secondary liver disease; diagnosed in their medical records as having hepatitis (n=994), celiac (n=1021) and inflammatory bowel-disease (n=1872).
In MHS, blood samples are typically drawn at the morning after a night fast. All biochemical assessments were performed by the same laboratory which maintains quality management system, as required, and using the same standard laboratory methods (99%CI of the time gap from the ALT test for glucose, cholesterol and triglycerides was ±5 days at the maximum). Serum vitamin D was measured in fresh blood tests and defined as an ordinal variable according to 25-hydroxyvitamin D (25(OH)D) serum levels: Deficiency; <20ng/ml, insufficiency; 20–30ng/ml, and adequate; >30ng/ml, according to the MHS regular lab norms and as accepted in other publications [29,30]. Serum ALT was measured in fresh blood tests and was defined as elevated according to the MHS regular lab norms: ALT>37U/L in men, and ALT>31U/L in women.
2.1Statistical analysisData was analyzed with SPSS 23.0 (IBM-SPSS Armonk, NY).
Continuous variables are presented as means±SD and dichotomous variables as proportions. For the bivariate analysis, association between categorical variables (i.e. elevated ALT, vitamin D deficiency/insufficiency) was tested using Pearson's Chi-square test. To test the differences in continuous variables between two groups or more, the independent samples t-test or analysis of variance (ANOVA) were performed, respectively.
A multivariable logistic regression analysis was performed to test the adjusted association between vitamin D status and elevated ALT adjusting for confounders (variables which were different between vitamin D categories on bivariate analysis; age, BMI, serum glucose and lipids, use of statins and season of the year in which serum 25(OH)D test was obtained). P value of <0.05 was considered statistically significant for all analyses.
3Results3.1Characteristics of the study population and comparison across serum 25(OH)D categoriesA total of 82,553 subjects were included, 32.5% men, mean age 43.91±10.15 years and the mean BMI was 26.42±4.68kg/m2. About 47% of the study population had serum 25(OH)D deficiency (<20ng/ml), 39% had serum 25(OH)D insufficiency (20-30ng/ml) and only 13% had adequate serum levels of 25(OH)D (>30ng/ml), similar to previous reports on the Israeli population [26].
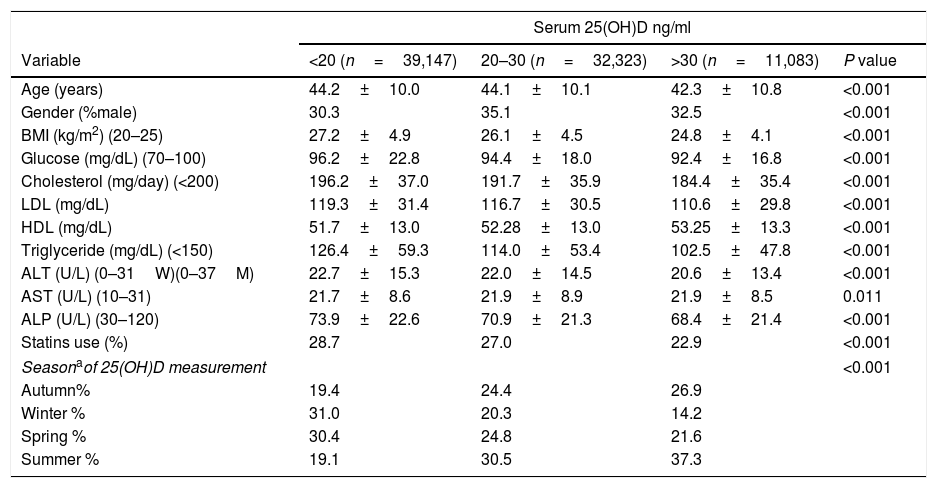
Participants with serum levels of 25(OH)D>30 were younger and had lower BMI, glucose, triglyceride and ALT levels compared to participants with serum 25(OH)D insufficiency and deficiency. In addition, the year seasons distributed differently across 25(OH)D categories (Table 1). These variables were adjusted for in the multivariate analysis.
Comparison between patients with serum 25(OH)D deficiency, insufficiency and normal (mean±SD, unless otherwise stated) (total n=82,553).
| Serum 25(OH)D ng/ml | ||||
|---|---|---|---|---|
| Variable | <20 (n=39,147) | 20–30 (n=32,323) | >30 (n=11,083) | P value |
| Age (years) | 44.2±10.0 | 44.1±10.1 | 42.3±10.8 | <0.001 |
| Gender (%male) | 30.3 | 35.1 | 32.5 | <0.001 |
| BMI (kg/m2) (20–25) | 27.2±4.9 | 26.1±4.5 | 24.8±4.1 | <0.001 |
| Glucose (mg/dL) (70–100) | 96.2±22.8 | 94.4±18.0 | 92.4±16.8 | <0.001 |
| Cholesterol (mg/day) (<200) | 196.2±37.0 | 191.7±35.9 | 184.4±35.4 | <0.001 |
| LDL (mg/dL) | 119.3±31.4 | 116.7±30.5 | 110.6±29.8 | <0.001 |
| HDL (mg/dL) | 51.7±13.0 | 52.28±13.0 | 53.25±13.3 | <0.001 |
| Triglyceride (mg/dL) (<150) | 126.4±59.3 | 114.0±53.4 | 102.5±47.8 | <0.001 |
| ALT (U/L) (0–31W)(0–37M) | 22.7±15.3 | 22.0±14.5 | 20.6±13.4 | <0.001 |
| AST (U/L) (10–31) | 21.7±8.6 | 21.9±8.9 | 21.9±8.5 | 0.011 |
| ALP (U/L) (30–120) | 73.9±22.6 | 70.9±21.3 | 68.4±21.4 | <0.001 |
| Statins use (%) | 28.7 | 27.0 | 22.9 | <0.001 |
| Seasonaof 25(OH)D measurement | <0.001 | |||
| Autumn% | 19.4 | 24.4 | 26.9 | |
| Winter % | 31.0 | 20.3 | 14.2 | |
| Spring % | 30.4 | 24.8 | 21.6 | |
| Summer % | 19.1 | 30.5 | 37.3 | |
Abbreviations: 25-hydroxyvitamin D (25(OH)D); body mass index (BMI); low-density lipoprotein (LDL); high-density lipoprotein (HDL); alanine aminotransferase (ALT); aspartate aminotransferase (AST); alkaline phosphatase (ALP).
Of the total sample, 12% had elevated serum levels of ALT (>37 men, >31 women U/L). The prevalence of elevated ALT was higher in subjects with 25(OH)D deficiency and insufficiency (Fig. 1). After stratification by gender, the association between serum 25(OH)D levels and elevated serum ALT levels remained significant in both men and women (Fig. 1 ). However, after further stratification by BMI categories, the association among women remained significant only in BMI>25kg/m2, whereas, among men the association remained significant in BMI<25 and 25<BMI<30kg/m2 (Fig. 2A and B).
D deficiency, insufficiency and sufficiency, among the total sample, men and women. Note: elevated ALT defined as: >37U/L for men, >31 for women.")
D stratified by BMI categories among men (A) and women (B). Note: elevated ALT defined as >37U/L for men, >31 for women. Note: Sample size for men: BMI<25: n=3070, n=3690, n=1514; 25≤BMI≤30: n=5188, n=5147, n=1565; BMI>30: n=3597, n=2500, n=524 for 25(OH)D<20, 20–30 and >30 respectively. Sample size for women: BMI<25: n=11,533, n=11,070, n=4880; 25≤BMI≤30: n=8566, n=6308, n=1875; BMI>30: n=7193, n=3608, n=725 for 25(OH)D<20, 20–30 and >30 respectively.")
The prevalence of elevated serum ALT by serum levels of 25(OH)D stratified by BMI categories among men (A) and women (B). Note: elevated ALT defined as >37U/L for men, >31 for women. Note: Sample size for men: BMI<25: n=3070, n=3690, n=1514; 25≤BMI≤30: n=5188, n=5147, n=1565; BMI>30: n=3597, n=2500, n=524 for 25(OH)D<20, 20–30 and >30 respectively. Sample size for women: BMI<25: n=11,533, n=11,070, n=4880; 25≤BMI≤30: n=8566, n=6308, n=1875; BMI>30: n=7193, n=3608, n=725 for 25(OH)D<20, 20–30 and >30 respectively.
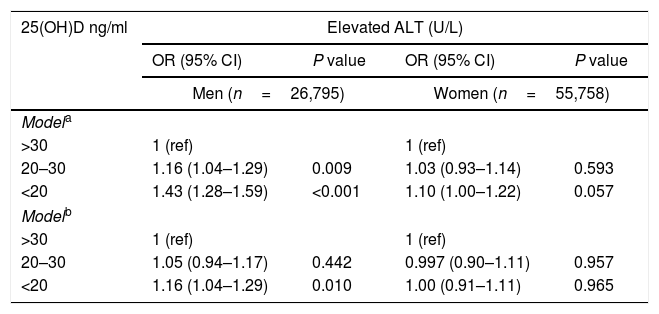
Due to gender differences shown in the bivariate analysis, the multivariate analysis was performed separately for men and women. In the multivariate analysis, adjusting for age and BMI, among men, both vitamin D insufficiency (OR=1.16, 95%CI 1.04–1.29, P=0.009) and deficiency (OR=1.43, 95%CI 1.28–1.59, P<0.001) were positively associated with elevated ALT. However, among women there was no significant association (Table 2 model a). Following further adjustment for serum levels of glucose, total cholesterol, triglycerides, use of a statin and season of the year in which serum 25(OH)D test was obtained (fully adjusted model), the association among men remained significant for the vitamin D deficiency category (OR=1.16, 95%CI 1.04–1.29, P=0.010) (Table 2 model b).
Multivariate analysis of the association between serum 25(OH)D status and elevated ALT, stratified by gender [OR (95% CI)].
| 25(OH)D ng/ml | Elevated ALT (U/L) | |||
|---|---|---|---|---|
| OR (95% CI) | P value | OR (95% CI) | P value | |
| Men (n=26,795) | Women (n=55,758) | |||
| Modela | ||||
| >30 | 1 (ref) | 1 (ref) | ||
| 20–30 | 1.16 (1.04–1.29) | 0.009 | 1.03 (0.93–1.14) | 0.593 |
| <20 | 1.43 (1.28–1.59) | <0.001 | 1.10 (1.00–1.22) | 0.057 |
| Modelb | ||||
| >30 | 1 (ref) | 1 (ref) | ||
| 20–30 | 1.05 (0.94–1.17) | 0.442 | 0.997 (0.90–1.11) | 0.957 |
| <20 | 1.16 (1.04–1.29) | 0.010 | 1.00 (0.91–1.11) | 0.965 |
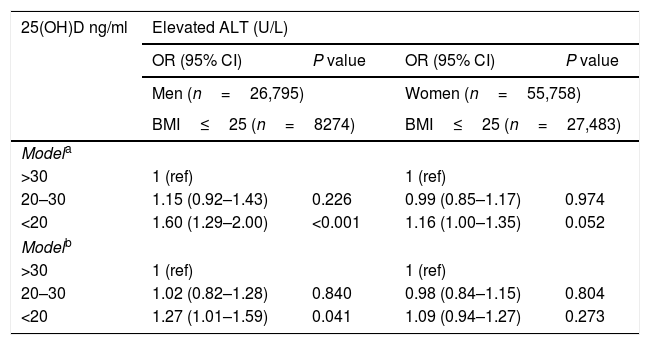
In the fully adjusted multivariate analysis (Table 3 model b), among normal weight men and overweight men only vitamin D deficiency was associated with elevated ALT (OR=1.27, 95%CI 1.01–1.59, P=0.041 and OR=1.27, 95%CI 1.08–1.50, P=0.003, respectively). However, no association was observed among obese men (OR=0.92, 95%CI 0.74–1.13, P=0.424). No independent association was shown among women at all BMI categories (Table 3 model b).
Multivariate analysis of the association between serum 25(OH)D status and elevated ALT, stratified by gender & BMI category [OR (95% CI)].
| 25(OH)D ng/ml | Elevated ALT (U/L) | |||
|---|---|---|---|---|
| OR (95% CI) | P value | OR (95% CI) | P value | |
| Men (n=26,795) | Women (n=55,758) | |||
| BMI≤25 (n=8274) | BMI≤25 (n=27,483) | |||
| Modela | ||||
| >30 | 1 (ref) | 1 (ref) | ||
| 20–30 | 1.15 (0.92–1.43) | 0.226 | 0.99 (0.85–1.17) | 0.974 |
| <20 | 1.60 (1.29–2.00) | <0.001 | 1.16 (1.00–1.35) | 0.052 |
| Modelb | ||||
| >30 | 1 (ref) | 1 (ref) | ||
| 20–30 | 1.02 (0.82–1.28) | 0.840 | 0.98 (0.84–1.15) | 0.804 |
| <20 | 1.27 (1.01–1.59) | 0.041 | 1.09 (0.94–1.27) | 0.273 |
| 25<BMI≤30 (n=11,900) | 25<BMI≤30 (n=16,749) | |||
|---|---|---|---|---|
| Modela | ||||
| >30 | 1 (ref) | 1 (ref) | ||
| 20–30 | 1.17 (0.99–1.38) | 0.051 | 1.10 (0.92–1.31) | 0.324 |
| <20 | 1.53 (1.31–1.80) | <0.001 | 1.10 (0.92–1.30) | 0.307 |
| Modelb | ||||
| >30 | 1 (ref) | 1 (ref) | ||
| 20–30 | 1.07 (0.91–1.25) | 0.449 | 1.04 (0.87–1.25) | 0.636 |
| <20 | 1.27 (1.08–1.50) | 0.003 | 0.97 (0.82–1.16) | 0.738 |
NAFLD is most commonly related to obesity, type 2 diabetes, metabolic syndrome and unhealthy lifestyle [31]. Since the treatment of obesity and lifestyle modification is hard to maintain, pathogenic pathways related to nutritional deficiencies, which can be easily corrected, are an appealing field of research. Vitamin D deficiency is suspected to be an additional risk factor for NAFLD, but although this association was shown in animal studies and has demonstrated biological plausibility [32,33], the association with human NAFLD is still debated [17,34]. The conflicting results may stem from residual confounding, especially related to body fat measures, gender differences and insufficient statistical power in small sample size studies. In the current study, the large database of HMO enabled stratification by both gender and BMI while maintaining high statistical power. After stratification by gender, on bivariate analysis, 25(OH)D levels were associated with unexplained elevated ALT in both men and women in a dose–response manner. However, after adjustment for or stratification by BMI, we found gender differences indicating a significant independent association between vitamin D deficiency and elevated ALT among men, but not among women. Another interesting finding is the modifying effect of BMI. In multivariate analysis stratified by both gender and BMI categories, we showed an independent association of serum vitamin D deficiency and elevated ALT among normal and overweight men, whereas no association existed among obese men. Similar finding were found in another cross-sectional study indicating inverse independent association between serum vitamin D levels and ALT levels [35], but the analysis was not stratified by gender. In fact, gender differences were tested in only a minority of the studies. In two large studies in China, vitamin D deficiency was significantly associated with NAFLD in men but not in women [17,18], and a similar association was shown also with serum ALT levels only among men [18].
The reason for gender differences is unknown; however, several mechanisms may play a role in explaining these differences. First, there is little evidence that serum 25(OH)D is more strongly correlated with metabolic alterations in men [36]. Second, circulating sex hormone levels were demonstrated to be associated with NAFLD, including an association with lower levels of sex hormone binding globulin (SHBG) [37]. In that context, the joint presence of low 25(OH)D levels and low SHBG was suggested to have a synergistic association with NAFLD among men [38].
It is also unclear why we found stronger and more sustainable association between low vitamin D levels and unexplained elevated ALT among non-obese men. It may be that since obesity is a major cause for NAFLD, in the obese patient the added effect of vitamin D deficiency is clinically negligible. That is in contrast to the normal weight patients, in which causes other than obesity may exist or have more pronounced effect, including a potential role for vitamin D deficiency. It may also be that the diagnosis of low 25(OH)D serum levels in obese subjects with a greater fat mass is less precise due to the greater volume of distribution [39], and that this non-differential misclassification bias weakens the observed association in obese subjects. Lack of association between low serum 25(OH)D in obesity was also demonstrated in bone metabolism where it was not associated with higher parathyroid hormone (PTH), bone turnover and lower bone density [39].
Despite the demonstrated association of vitamin D deficiency with elevated serum ALT, in terms of liver histology, results are conflicting. A meta-analysis of 6 observational studies indicated no difference in 25(OH)D levels among NAFLD patients with high NAFLD activity score (NAS) or high fibrosis level versus low [34]. Similarly, in specific recent studies, vitamin D deficiency was not associated with the presence or histologic severity of NAFLD, including steatosis and inflammation after adjusting for confounding factors [5,13]. Conversely, others have shown that vitamin D deficiency was independently associated with NASH and fibrosis, but not with steatosis [14]. Indeed, the association with NAFLD diagnosed on ultrasound varies in different studies; serum 25(OH)D was not shown to be associated with NAFLD among type 2 diabetes patients [40], but among subjects with normal liver enzymes, an independent relationship between NAFLD and lower serum 25(OH)D levels was shown [4]. The lack of subgroup analysis by gender and BMI in the upper mentioned studies limits the comparability with our results.
The strength of the study is its large sample size of a “real-life” population and the structured standardized computerized medical file available for all. However, this study has several limitations to consider. One limitation stems from the lack of imaging to confirm the presence of NAFLD. ALT is a well-established marker of liver inflammation and hepatocellular injury [41–43], but is not sufficiently sensitive to detect NAFLD [44–46]. However, NAFLD patients presenting with elevated ALT may represent patients with NASH or with higher NAS [45,47,48] that are clinically more important.
Second, we could not systematically collect information regarding alcohol consumption and were not able to exclude it as a possible reason for elevated ALT. However, the Israeli population is considered to have a relatively low level of alcohol consumption [49], and in the Israeli national survey 2009/2010 the percent of adults aged 21 and older who reported being heavy drinkers was only 0.7% of women and 1.3% of men (Israeli National Health Interview Survey (INHIS), 2009/2010). It is therefore reasonable to assume that the elevated ALT in our study population mostly reflects the presence of NAFLD. In addition, we performed multivariate analysis on two subsamples: following exclusion of subjects with elevated GGT or following exclusion of subjects with AST>ALT ratio above 1, and the results remained the same (Supplemental tables). Third, although subjects diagnosed in their medical records as having hepatitis were excluded, the absence of serologic tests for all participants does not enable ruling out viral hepatitis as a cause of elevated ALT. However, the prevalence of HCV in the Israeli adult population is as low as 0.9% [50], and according to the computerized database of MHS, at the end of 2012 HCV infection prevalence was of 0.5%. The prevalence of chronic HBV infection is even lower [51]. Fourth, we could not directly address aspects of body composition or body fat distribution. BMI is an imperfect marker of body fat and controlling for it is prone to residual confounding. However, we minimized the confounding by analyzing BMI subgroups separately and additionally adjusting for BMI within each subgroup. Lastly, our study does not permit the determination of temporal sequence and thus no inference can be made for causality.
In conclusion, in a “real-life” general population study, the association between vitamin D deficiency and unexplained elevated ALT, as a possible marker for NAFLD, persists only in men who are normal weight and overweight, but not in obese men or women at any weight. The clinical significance of vitamin D for human NAFLD should be further elucidated with attention to the modifying effect of gender and the presence of obesity.
Description of author roles in manuscript creation: Shira Zelber-Sagi conceived the study concept and design, conducted on the extraction of data, performed the analysis and wrote the paper, Reut Zur performed the analysis and wrote the paper, Tamar Thurm provided critical review, Alex Goldstein performed the extraction of data, Oren Shibolet provided critical review, Gabriel Chodick conducted on the extraction of data and participated in writing the paper, Ofir Ben-Assuli performed the extraction of data, data management and analysis.AbbreviationsNAFLD nonalcoholic fatty liver disease 25-hydroxyvitamin D alanine aminotransferase body mass index Maccabi Healthcare System non-alcoholic steatohepatitis NAFLD Activity Score health maintenance organization International Classification of Diseases version 9 analysis of variance low-density lipoprotein high-density lipoprotein aspartate aminotransferase alkaline phosphatase sex hormone binding globulin parathyroid hormone
None.
Conflict of interestNone.
The following are the supplementary data to this article:


