


Background&aim: Adiponectin and ghrelin are hormones that participate in hepatic lipid metabolism, and their expression in liver tissue could have important implications for nonalcoholic fatty liver disease (NAFLD). The aim of this study was to evaluate the hepatic expression of ghrelin, adiponectin, AdipoR, and IL-6 in patients with NAFLD and normal liver.
Methods: We studied patients with clinical-pathological diagnosis of NAFLD or a normal liver. Patients were classified according to their diagnosis into three groups: normal liver, nonalcoholic hepatic steatosis, and nonalcoholic steatohepatitis (NASH). Adiponectin, AdipoR1, AdipoR2, IL-6, and ghrelin mRNA levels were assessed in biopsies by reverse transcriptasepolymerase chain reaction.
Results: Of the 21 patients, three had a normal liver biopsy, 14 had nonalcoholic steatosis, and four had NASH. Patients with NAFLD exhibited significantly higher HOMA-IR and triglyceride concentration (both P < 0.05). There was a nonsignificant trend towards higher ghrelin expression in patients with NASH > nonalcoholic steatosis > normal liver. Patients with NASH had significantly higher mRNA adiponectin levels and lower IL-6 levels than did those with a normal liver (P < 0.05). AdipoR expression did not differ significantly between groups.
Conclusion: Adiponectin overexpression was observed in patients with NASH. The role of hepatic ghrelin in NAFLD requires further research.
List abbreviations used in the manuscript
NAFLD, nonalcoholic fatty liver disease
NASH, nonalcoholic steatohepatitis
ACC, acetyl-CoA carboxylase
CPT I, Carnitine palmitoyl transferase I
FAS, fatty acid synthase
TNF-a
tumor necrosis factor-a
BMI, body mass index
ALT, alanine aminotransferase
HDL, high-density lipoprotein
LDL, Low-density lipoprotein
HOMA-IR, Homeostasis Model Assessment Index
IntroductionNonalcoholic fatty liver disease (NAFLD) is a chronic disease of increasing interest worldwide because of its rising incidence and relationship with the obesity epidemic. NAFLD has the potential to progress to liver cirrhosis and hepatocellular carcinoma.1 The «two-hit» hypothesis proposes that NAFLD pathogenesis and progression involve first fatty deposition and second necroinflammatory damage related to oxidative stress.2
Lipids accumulate as triglycerides in hepatocellular intracytoplasmic vesicles. This deposition depends on the relationship between the formation and degradation of fatty acids. The rate-limiting enzymes in fatty acid synthesis are acetyl-CoA carboxylase (ACC) and fatty acid synthase (FAS). Carnitine palmitoyl transferase I (CPT I) regulates fatty acid entry into the mitochondria, where it is degraded. These three enzymes are regulated by adiponectin, an adipocyte-derived enzyme, through its receptor AdipoR2.3 Adiponectin induces expression and activity of CPT I and inhibits ACC and FAS,4 reducing serum and hepatic fatty acid concentrations and the production and activity of tumor necrosis factor-α (TNF-α), an inducer of insulin resistance and a factor in NAFLD progression.5 Adiponectin serum concentration is low in obese individuals and in patients with NAFLD.6,7 In experimental models, adiponectin reverses steatosis and hepatomegaly in diet-induced obese mice.4
Ghrelin is a peptide hormone produced in the stomach and other organs, including the liver and gallbladder.8 Ghrelin induces satiety by acting on its hypothalamic receptor GHS1-a, and its serum level decreases after a meal and increases during fasting.9 Obese individuals and patients with NAFLD exhibit hypoghrelinemia, which is related to the degree of insulin resistance.10,11 The effects of ghrelin on hepatic fatty acid metabolism have been observed in experimental models.12 After intravenous administration in rats, ghrelin induces a rise in hepatic triglyceride content by activating ACC and FAS and by downregulating CPT-I. Ghrelin has been proposed as a factor causing hepatic steatosis during malnutrition. The aim of this study was to study the serum concentration and hepatic expression of ghrelin and adiponectin and their receptors in patients with NAFLD.
Materials and methodsStudy design and sampleA cross-sectional clinical study was carried out at the Liver Unit of the Medica Sur Clinic & Foundation and the Surgery Department of the General Hospital Dr. Manuel Gea González. A consecutive series of patients who were scheduled for abdominal laparoscopic surgery and who had no known chronic liver disease, alcohol consumption < 20 g/week, and a negative hepatitis virus panel were invited to participate. The study protocol conformed to the recommendations of the Helsinki Declaration of 1983 and was approved by the Ethics Committee of the participating hospital and all patients gave written informed consent.
Physical examinationHeight and weight were measured for patients in light clothing and without shoes, and body mass index (BMI) was calculated. Waist and hip circumferences were recorded by the same person who measured height and weight. Blood pressure was measure according to the American Heart Association guidelines.13
Analytical methodsA blood sample was obtained from all participants during fasting, and the serum was separated by centrifugation. Liver function tests including the concentrations or activities of aspartate aminotransferase, alanine aminotransferase (ALT), alkaline phosphatase, gammaglutamyl transpeptidase, total bilirubin, direct and indirect fractions, total proteins, albumin, and globulins, and prothrombin time. Serum glucose concentration was measured during fasting. The concentrations of cholesterol, high-density lipoprotein (HDL), and triglycerides were measured using colorimetric enzymatic assays. Low-density lipoprotein (LDL) concentration was calculated using the Friedewald formula.14 High-sensitivity C-reactive protein (hs-CRP) concentration was measured by nephelometry (IMMAGE, Beckman Coulter, US). Fasting insulin concentration was measured using an immunoenzymometric assay (MEIA; Abbott Diagnostics). Homeostasis Model Assessment Index (HOMA-IR) was calculated as fasting insulin concentration (μU/mL) ´ fasting glucose concentration (mmol/L)/22.5. Values > 2.522 indicate insulin resistance.15
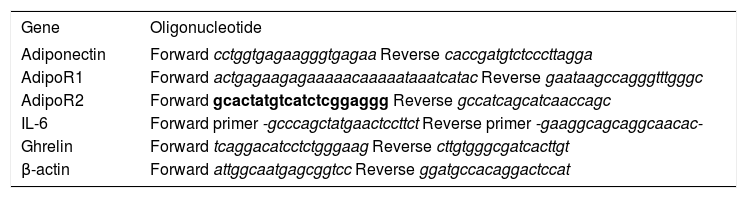
Liver biopsy studySamples were separated into two fragments. Fragment 1 was fixed in paraffin for histopathological study using hematoxylin–eosin and special staining according to the patient (Masson, Prussian blue, etc). Patients with NASH were classified using the Brunt scale.16 Fragment 2 was frozen at –70 °C and stored until it was analyzed at the Biomedical Research Center at the National Institute of Perinatology. Total RNA was extracted from liver biopsies using the guanidine isothiocyanate single-step technique (Trizol Reagent, InvitroGen). Complementary DNA was obtained from 1 μg of total RNA (Transcriptor First Strand cDNA Synthesis kit, Roche), using a 60 μM random primer, 20 U RNAse inhibitor, 1 mM of each dNTP, and 10 U of transcriptase. For reverse transcriptase-polymerase chain reaction (RT-PCR) amplification, 2 μL of cDNA was used, 100 nM on each probe and 200 nM of every oligonucleotide, according to the following protocol: one cycle of preincubation at 95 °C for 10 s, 60 °C for 30 s, 72°C for 1 s, and a final cooling cycle at 4 °C for 30 s. Probes and oligonucleotides used for amplification of every gene were determined using the program ProbeFinder v2.04 (www.roche-applied-science.com). Table I shows the oligonucleotide sequences used. A relative quantitative analysis was performed using β-actin as the reference gene and crossing-point values to obtain the expression level of each gene relative to β-actin.
Oligonucleotide sequences used for RT-PCR analysis.
| Gene | Oligonucleotide |
|---|---|
| Adiponectin | Forward cctggtgagaagggtgagaa Reverse caccgatgtctcccttagga |
| AdipoR1 | Forward actgagaagagaaaaacaaaaataaatcatac Reverse gaataagccagggtttgggc |
| AdipoR2 | Forward gcactatgtcatctcggaggg Reverse gccatcagcatcaaccagc |
| IL-6 | Forward primer -gcccagctatgaactccttct Reverse primer -gaaggcagcaggcaacac- |
| Ghrelin | Forward tcaggacatcctctgggaag Reverse cttgtgggcgatcacttgt |
| β-actin | Forward attggcaatgagcggtcc Reverse ggatgccacaggactccat |
Median and standard deviation (SD) are used to describe the distribution of continuous variables and to compare cases and controls. The Mann–Whitney U test was used to compare values between groups. All statistical analyses were performed using SPSS software v12.0 (SPSS, Chicago, IL, USA). P < 0.05 was considered significant.
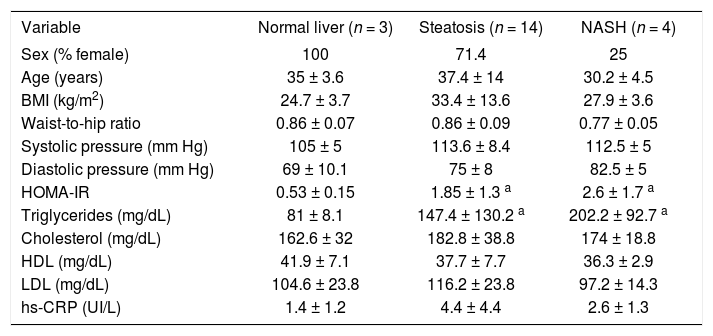
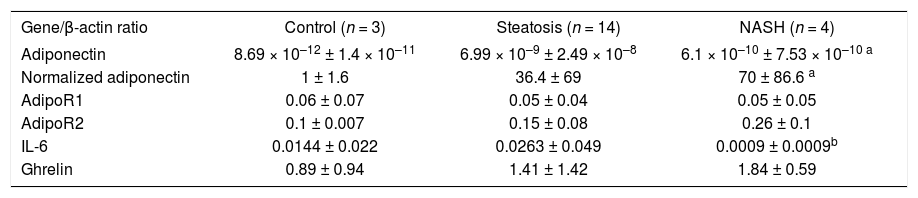
ResultsTwenty-one patients were studied: 16 women and five men aged 35 ± 12 years. Nineteen patients had surgical cholecystectomy, one patient had Nissen fundoplication, and one patient had gastric bypass. The histopathological diagnoses were normal liver in three patients, hepatic steatosis in 14 patients, and NASH in four patients. Two patients with hepatic steatosis showed abnormal ALT activity (51 and 62 UI/L), and one patient with hepatic steatosis had hypoalbuminemia (3 g/dL); the rest of the patients had no abnormalities in the liver function tests. All patients with NASH were considered as grade I in the Brunt classification. Table II shows the median and SD of the variables of interest. Patients with hepatic steatosis and NASH had a significantly higher HOMA-IR and triglyceride concentration than did the normal liver group. HOMA-IR was 1.85 ± 1.3 in patients with steatosis, 2.6 ± 1.7 in patients with NASH, and 0.53 ± 0.15 in the normal liver group (P < 0.05 compared with the normal liver group). Triglyceride concentration was 147.4 ± 130.2 mg/dL in patients with steatosis, 202.2 ± 92.7 mg/dL in patients with NASH, and 81 ± 8.1 mg/dL in the normal liver group (P < 0.05 compared with the normal liver group). BMI and waist-to-hip ratio did not differ significantly between groups. A nonsignificant trend for higher hs-CRP concentration was observed in patients with NAFLD (P = 0.08).RT-PCR results are shown in Table III. Adiponectin mRNA level was significantly higher in patients with NASH than in the normal liver group (P = 0.034), but did not differ significantly between patients with steatosis and either of the other two groups. AdipoR1 and AdipoR2 mRNA levels did not differ significantly between groups. A nonsignificant trend for higher ghrelin expression was observed in patients with NASH compared with the normal liver group (normal liver group, 0.89 ± 0.94; steatosis group, 1.19 ± 0.87; and NASH group, 1.84 ± 0.59). IL-6 mRNA expression was significantly lower in patients with NASH than in patients with steatosis (P < 0.05). A nonsignificant trend was observed for the difference in IL-6 mRNA expression between patients with NASH and the normal liver group (P = 0.077), but IL-6 mRNA expression did not differ significantly between patients with a normal liver and patients with steatosis. IL-6 expression was negatively correlated with adiponectin expression (r < 0.74; P < 0.01, see Figure 1).
Basal characteristics of the normal liver, steatosis, and NASH groups.
| Variable | Normal liver (n = 3) | Steatosis (n = 14) | NASH (n = 4) |
|---|---|---|---|
| Sex (% female) | 100 | 71.4 | 25 |
| Age (years) | 35 ± 3.6 | 37.4 ± 14 | 30.2 ± 4.5 |
| BMI (kg/m2) | 24.7 ± 3.7 | 33.4 ± 13.6 | 27.9 ± 3.6 |
| Waist-to-hip ratio | 0.86 ± 0.07 | 0.86 ± 0.09 | 0.77 ± 0.05 |
| Systolic pressure (mm Hg) | 105 ± 5 | 113.6 ± 8.4 | 112.5 ± 5 |
| Diastolic pressure (mm Hg) | 69 ± 10.1 | 75 ± 8 | 82.5 ± 5 |
| HOMA-IR | 0.53 ± 0.15 | 1.85 ± 1.3 a | 2.6 ± 1.7 a |
| Triglycerides (mg/dL) | 81 ± 8.1 | 147.4 ± 130.2 a | 202.2 ± 92.7 a |
| Cholesterol (mg/dL) | 162.6 ± 32 | 182.8 ± 38.8 | 174 ± 18.8 |
| HDL (mg/dL) | 41.9 ± 7.1 | 37.7 ± 7.7 | 36.3 ± 2.9 |
| LDL (mg/dL) | 104.6 ± 23.8 | 116.2 ± 23.8 | 97.2 ± 14.3 |
| hs-CRP (UI/L) | 1.4 ± 1.2 | 4.4 ± 4.4 | 2.6 ± 1.3 |
aP < 0.05 compared with normal liver group
Relative quantification of mRNA levels of adiponectin, AdipoR1, AdipoR2, IL-6 and ghrelin in patients with a normal liver, steatosis, and NASH.
| Gene/β-actin ratio | Control (n = 3) | Steatosis (n = 14) | NASH (n = 4) |
|---|---|---|---|
| Adiponectin | 8.69 × 10⁻¹² ± 1.4 × 10⁻¹¹ | 6.99 × 10⁻⁹ ± 2.49 × 10⁻⁸ | 6.1 × 10⁻¹⁰ ± 7.53 × 10⁻¹⁰ a |
| Normalized adiponectin | 1 ± 1.6 | 36.4 ± 69 | 70 ± 86.6 a |
| AdipoR1 | 0.06 ± 0.07 | 0.05 ± 0.04 | 0.05 ± 0.05 |
| AdipoR2 | 0.1 ± 0.007 | 0.15 ± 0.08 | 0.26 ± 0.1 |
| IL-6 | 0.0144 ± 0.022 | 0.0263 ± 0.049 | 0.0009 ± 0.0009b |
| Ghrelin | 0.89 ± 0.94 | 1.41 ± 1.42 | 1.84 ± 0.59 |
aP < 0.05 compared with normal liver group bP < 0.05 compared with steatosis group
.")
NAFLD is a highly prevalent disease worldwide, which affects 30% of the general population and 60–90% of obese individuals and people with diabetes.16 The persistence of pathogenic factors induces progression to NASH of the disease in 20% of patients, and the five-year risk of cirrhosis is 3–5%.18 The disease also has a negative impact on donor graft function and receptor survival after liver transplantation.19
Currently, the only accepted therapy for NASH is lifestyle modification and intervention to change the associated risks factors such as obesity, diabetes mellitus, and hypertriglyceridemia.20 Hepatocellular genetic regulation of transducers involved in fatty acid metabolism is a potential therapeutic target to decrease the hepatic triglyceride content and necroinflammatory activity.
High adipose tissue levels of TNF-α mRNA and high serum concentrations of interleukin (IL)-6 are found in insulin-resistant states.5 IL-6 is an inflammatory cytokine that induces hepatocellular regeneration and insulin sensitivity.21,22 In experimental models, IL-6 reduces the grade of hepatic steatosis and ischemia–reperfusion lesions in rats transplanted with a nonalcoholic fatty liver.23 Adiponectin is not produced by the human liver in normal circumstances, although CCl4-induced lesions cause adiponectin deposition in rat hepatocytes and in vitro stimulation of human HepG2 cells induces adiponectin expression.24 We have demonstrated previously that patients with hepatic steatosis exhibit hypoadiponectinemia.7 Based on our current results, we propose that, in response to IL-6 and possibly other factors, human hepatocytes are capable of producing adiponectin as a compensatory response to hypoadiponectinemia and insulin resistance. IL-6 mRNA expression was significantly lower in patients with NASH, suggesting a down-regulating effect of systemic IL-6 on hepatic expression. The adiponectin mRNA level was 70 times higher in our patients with NASH than in patients with a normal liver; however, the mRNA levels were relatively low in both groups. Exogenous induction of hepatic adiponectin expression may be a potential therapeutic option to reduce triglyceride hepatic content and necroinflammatory activity in patients with NASH through TNF-α antagonism and a direct effect on fatty acid metabolism and insulin sensitivity.
Ghrelin is a multifunctional hormone normally expressed in the liver, and its activity is now an integral part of the study of hepatic lipid metabolism.8 Patients with NAFLD exhibit hypoghrelinemia, whereas patients with anorexia nervosa have hyperghrelinemia, a possible factor in the induction of fatty liver associated with malnutrition through the induction of lipogenic enzymes.11 We studied ghrelin hepatic expression in patients with a histologically normal liver and patients with NAFLD, and we found nonsignificant hepatic ghrelin overexpression in patients with NASH. Although this difference was not statistically significant, we believe that the 100% higher value in the NASH group (0.89 in the normal liver group compared with 1.84 in the NASH group) is real and may have been underestimated because of the small sample size (type II error).
In conclusion, our study shows that human liver is capable of producing adiponectin in vivo under pathological circumstances (e.g., NASH) and suggests that hepatic ghrelin is overexpressed, representing a potential factor responsible for lipid deposition in NAFLD despite hypoghrelinemia.


