


Introduction. The intrahepatic hepatitis B surface antigens (HBsAg) expression is related to disease progression of chronic hepatitis B. We examined the features of intrahepatic HBsAg expression.
Material and methods. A total of 181 patients with e antigen positive chronic hepatitis B were enrolled. Patterns and semi-quantitative measurement of intrahepatic HBsAg expression were analyzed. The association of intra-hepatic hepatitis HBsAg expression with clinical, viral, and histological characteristics was evaluated.
Results. Higher necroinflammation grade and greater fibrosis stage accompanied with lower serum HBV DNA and HBsAg levels were observed in patients with type II ground glass hepatocytes and 2+/3+ scales of intrahepatic HBsAg expression. Basal core promoter T1762/A1764 mutations were strongly associated with the pattern of type II ground glass hepatocytes expression (P < 0.001) and higher level of HBsAg expression (9.3 ± 8.0% vs. 4.3 ± 5.0%, P = 0.008). In multivariate analysis, basal core promoter mutations (Odds ratio: 6.356, 95% confidence interval: 1.204 ~ 33.356, P = 0.029) was associated with 2+/3+ scale of HBsAg expression.
Conclusion. Both pattern and levels of intrahepatic HBsAg expression were associated with severity of liver disease in e antigen positive chronic hepatitis B. Strong relationship between intrahepatic HBsAg expression and basal core promoter 1762/A1764 mutations indicated that HBsAg expression may be the histological manifestation of hepatitis B virus genomic evolution under host immune surveillance.
Hepatitis B virus (HBV) infection is the most common cause of liver cirrhosis and hepatocellular carcinoma in most parts of Asia.1,2 The pathogenesis of chronic hepatitis is mediated by the interaction of the host immune reaction and the hepatocytes that present HBV antigens.3,4 Earlier studies have demonstrated that the expression of HBV antigens by hepatocytes is importantly related to the stage and activity of chronic liver disease. In the immune tolerance phase, hepatitis B core antigens (HBcAg) are mostly found in the nucleus and correlate with HBV replication while, in the ensuing immune clearance phase, an intrahepatic shift of HBcAg from the nucleus to the cytoplasm occurs and is associated with the histological activities of chronic hepatitis.5,6 In cases of intrahepatic hepatitis B surface antigen (HBsAg) expression, three patterns-homogeneous type, type I ground glass hepatocyte (GGH), and type II GGH have been reported. Homogeneous patterns in grouped, discrete, or faint presentations have been observed in patients with high viremia or active hepatitis. Type I GGHs are typically scattered singly in hepatic lobules with inclusion-like dense homogenous expression, whereas type II GGHs express surface antigens at the periphery of hepatocytes, which cluster in groups, and are generally present during the low replication phase and become prevalent from active hepatitis to liver cirrhosis and hepatocellular carcinoma.7–10 Hence, both intrahe-patic HBcAg and HBsAg expressions are closely linked to the natural course of infection and HBV replication.
Among the phases of chronic hepatitis B, immune-clearance phase or named as HBeAg-positive chronic hepatitis B often occurred in younger population, exhibited less severe histological activities, and harbored fewer rates of precore A1896 mutation and basal core promoter (BCP) T1762/A1764 mutations than HBeAg-negative chronic hepatitis B.11–14 The course of chronic hepatitis B is dynamic that resulted from interaction of viral replication and host immune system. Consequently, diversity in clinical features or histological activities is commonly observed in HBeAg positive patients. For example, 34 to 55% of patients exhibit bridging fibrosis or cirrhosis in liver histology, while the remaining patients exhibit mild fibrosis.15,16 HBsAg accumulation in hepatocytes has been shown to associate with specific viral mutations and related to disease activi-ties.8,9 It is interesting to investigate the characteristics of intrahepatic HBsAg expression in patients with different severity of liver histology.
Viral mutants usually evolved under host immune surveillance pressure. Among naturally occurring HBV mutants, BCP T1762/A1764 mutations became prevalent as disease progression and has been frequently found to be associated with advanced liver disease and hepatocellular carcinoma.17,18 Patterns of intrahepatic HBsAg expression also changed during natural course of chronic hepatitis B. The association of BCP T1762/A1764 mutations and the intrahepatic HBsAg expression is still unknown and remained to study.
Therefore, the aim of this study was to evaluate the features of intrahepatic HBsAg expression and analyze the association with liver histology, viral replication markers, and HBV mutants in HBeAg positive chronic hepatitis B.
Material and MethodsPatientsA total of 181 treatment-naïve hepatitis B e antigen (HBeAg) positive patients who met the inclusion criteria were retrospectively enrolled in this study. The inclusion criteria were an age of over 18 years and less than 70 years, positive serum HBsAg for more than 6 months and serum HBV DNA level ≥ 100,000 copies/mL, abnormal serum alanine aminotransferase level, no other explainable etiology of chronic hepatitis, including alcohol, autoimmune hepatitis or markers of hepatitis C virus, hepatitis D virus, or human immunodeficiency virus infection, and the lack of a history of anti-HBV treat- ment history and specimen of liver biopsy available for histological evaluation. The serum and liver biopsy of all of the patients were sampled before antiviral treatments, and the samples were stored at −70 oC until testing. This study was approved by the Institutional Review Board of National Cheng Kung University Hospital (No: ER-99-398). Informed consent was obtained, according to the Declaration of Helsinki.
HBV virological assaysHBV genotyping was performed by the multiplex polymerase chain reaction, as described elsewhere.19 Serum HBV DNA level was measured using the COBAS Amplicor HBV Monitor test (COBAS-AM assay, Roche Diagnostics, Branchburg, NJ). Serum HBsAg level was quantified by Abbott Architect HB-sAg QT (Abbott Diagnostics, Rungis, France) with a dynamic range of 0.05-250.0 IU/mL. Samples with HBsAg levels > 250 IU/mL were retested at dilutions of 1:20 and 1:1000.
Polymerase chain reaction and sequencing of precore and BCP regionsHBV DNA was extracted from 50 μL of serum using Blood and Tissue Genomic Mini Kit (VIOGENE, Taipei, Taiwan). First-round PCR was performed under the following conditions: 96 oC for 2 min, 94 oC for 1 min, 54 oC for 1 min, and 72 oC for 2 min with primers 5’-ACCTCTGCACGTAGCATGG (forward) and 3’-GGATTAAAGACAGGTACAGTAGAAG (reverse). Second-round PCR was performed under the same conditions with primers 5’-ATGTCAACGACCGACCTTGA (forward) and 3’-TTCCCACCTTATGAGTCCAAG (reverse). Purified PCR products were then direct sequencing using an automated DNA sequencer ABI 310 and the ABI PRISM Big Dye Terminator Cycle Sequencing Ready Reaction Kit (Applied Biosystems) with the forward primer that was utilized during in the second-round PCR.
Liver histologyLiver histology was evaluated by a single pathologist who was unaware of the backgrounds of the patients. Necroinflammation and fibrosis were evaluated based on the Knodell necroinflammation grade (ranging from 0 to 18)20 and the Ishak fibrosis stage (ranging from 0 to 6),21 respectively.
Immunohistochemical staining was performed as described elsewhere.22 Briefly, deparaffinized 5 μm- thick sections were incubated with monoclonal mouse anti-HBsAg (Clone 3E7, Dako Corp., Carpinteria,USA) and anti-HBcAg (Novocastra Laboratories, Newcastle, UK) overnight at 4°C. The optimal dilution of anti-HBsAg or anti-HBcAg was determined using liver tissue from HBV carrier as a positive control. The StrAviGen Super Sensitive MultiLink Kit (BioGenex) was used to detect the resulting immune complex. Peroxidase activity was visualized by an aminoethyl carbazole substrate kit (Zymed Laboratory, Inc, San Francisco, CA). Finally, sections were counterstained with hematoxylin. As a negative control, non-immune mouse immunoglobulin was substituted for primary antibody in the incubation. Patterns of HBcAg expression by the nucleus, cytoplasm, or both, were recorded. Patterns of HBsAg expression were classified as homogenous, type I GGH, type II GGH.22 Homogeneously stained hepatocytes were identified as hepatocytes with moderate to strong homogeneous cytoplasmic staining; type I GGHs were identified as hepatocytes with dense globular or “inclusion-like” staining, and type II GGHs were identified as hepatocytes with surface antigen staining at the cell margins or periphery.6,22 Type I GGHs scatter singly or cluster in the hepatic lobules while type II GGHs consistently cluster in nodules. The expression levels of HBcAg and HBsAg were scored semi-quantitatively according to the proportion of immunolabelled cells, on a 0 to 4+ scale, corresponding to positivity in 0, 1-10, 11-25, 25-50% and more than 50% of the examined hepatocytes.
Statistical analysesData were expressed as mean ± standard deviation. Continuous variables were compared using the Mann-Whitney U test or Kruskal-Wallis ANOVA for univariate analysis. Categorical variables were analyzed using χ2 test or Fisher’s exact test. Independent factors that were associated with levels of intrahepatic HBsAg expression were carried out using multivariate logistic regression analysis. Data handling and statistical analyses were performed using the SPSS software for Windows, version 17.0 (SPSS Inc., Chicago, IL).
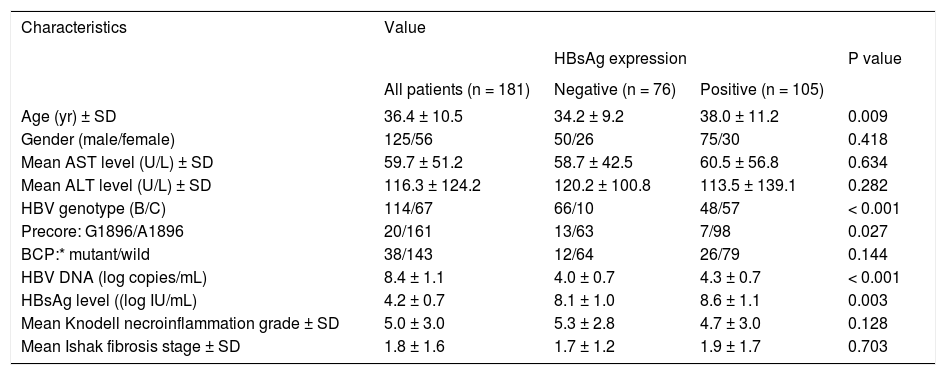
ResultsCharacteristic of enrolled patientsTable 1 lists the demographic characteristics of the 181 enrolled patients. Most of the patients were male (69.1%) and 63.0% of them exhibited HBV genotype C. The precore A1896 mutation was detected in 20 patients (11.0%) and the BCP T1762/A1764 mutations was detected in 38 patients (21.0%). Of the 181 patients, positive HB-sAg staining was detected in 105 patients (58.0%). Patients with HBsAg staining exhibited significantly higher serum HBsAg (P < 0.001) and HBV DNA levels (P = 0.003), greater prevalence of genotype C (P < 0.0001), lower prevanlence of precore A1896 mutation (P = 0.027), and older age (P = 0.009).
Clinical, virological, and histological characteristics of the 181 patients.
| Characteristics | Value | |||
|---|---|---|---|---|
| HBsAg expression | P value | |||
| All patients (n = 181) | Negative (n = 76) | Positive (n = 105) | ||
| Age (yr) ± SD | 36.4 ± 10.5 | 34.2 ± 9.2 | 38.0 ± 11.2 | 0.009 |
| Gender (male/female) | 125/56 | 50/26 | 75/30 | 0.418 |
| Mean AST level (U/L) ± SD | 59.7 ± 51.2 | 58.7 ± 42.5 | 60.5 ± 56.8 | 0.634 |
| Mean ALT level (U/L) ± SD | 116.3 ± 124.2 | 120.2 ± 100.8 | 113.5 ± 139.1 | 0.282 |
| HBV genotype (B/C) | 114/67 | 66/10 | 48/57 | < 0.001 |
| Precore: G1896/A1896 | 20/161 | 13/63 | 7/98 | 0.027 |
| BCP:* mutant/wild | 38/143 | 12/64 | 26/79 | 0.144 |
| HBV DNA (log copies/mL) | 8.4 ± 1.1 | 4.0 ± 0.7 | 4.3 ± 0.7 | < 0.001 |
| HBsAg level ((log IU/mL) | 4.2 ± 0.7 | 8.1 ± 1.0 | 8.6 ± 1.1 | 0.003 |
| Mean Knodell necroinflammation grade ± SD | 5.0 ± 3.0 | 5.3 ± 2.8 | 4.7 ± 3.0 | 0.128 |
| Mean Ishak fibrosis stage ± SD | 1.8 ± 1.6 | 1.7 ± 1.2 | 1.9 ± 1.7 | 0.703 |
Mutant, T1762 and A1764; wild, A1762 and T1764. χ2 test was used for variables of gender, HBV genotype, precore and basal core promoter mutations, while Mann-Whitney U test was used for other variables. AST: aspartate aminotransferase. ALT: alanine aminotransferase. BCP: basal core promoter. HBV: hepatitis B virus.
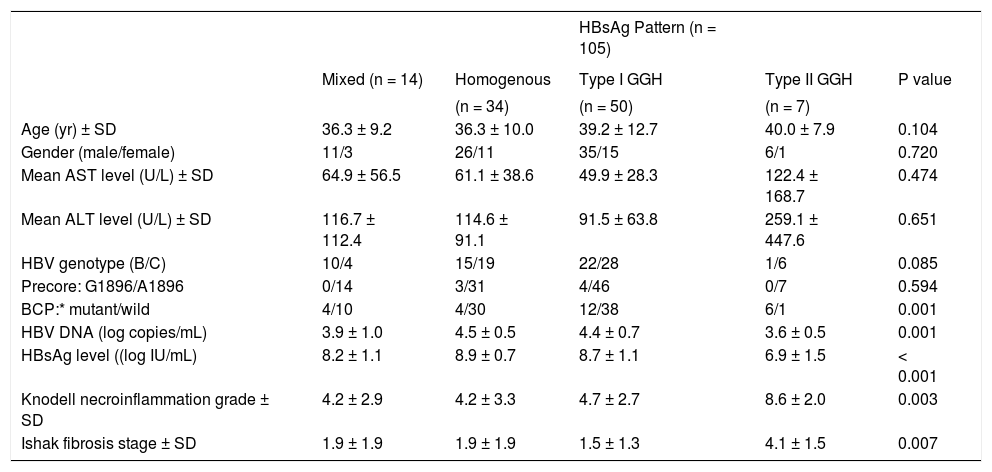
With respect to the 105 patients who exhibited HBsAg expression, homogenous pattern (Figure 1A) was detected in 34 (32.4%) patients, type I GGH (Figure 1B) was detected in that of 50 (47.6%), type II GGH (Figure 1C) was detected in that of seven (6.7%), and a mixed pattern was detected in that of 14 (13.3%). As indicated in table 2, a higher prevalence of BCP T1762/A1764 mutations was observed in type II GGH (P =0.001) as compared with other patterns. There was a reciprocal relationship between HBsAg expression and serum viral replication markers. In figure 1D shows that patients with type II GGH expression had lower HBV DNA levels and HBsAg titers, but higher intrahepatic HBsAg expression levels (Figure 1D). Besides, liver histology displayed type II GGH exhibited significantly more severe liver necroinflammation and fibrosis activities, and a higher level of intrahepatic HBsAg expression (Figure 1E).
 in a background of weakly stained hepatocytes. The nucleus of each homogeneously stained hepatocyte was located in the center of the cell. B. Type I ground glass hepatocyte (GGH) with dense globular or “inclusion-like” HBsAg staining (arrows) was scattered in the hepatic parenchyma. C. A cluster of type II GGHs showed HBsAg staining at the cell margin or periphery. Correlations of HBsAg expression patterns and serum HBV DNA level (Da), serum HBsAg level (Db), and intrahepatic HBsAg expression level (Dc). The association of HBsAg expression patterns and Knodell necroinflammation grade (Ea) and Ishake fibrosis stage (Eb). Comparisons among groups were analyzed by Kruskal-Wallis ANOVA.")
Staining patterns of HBsAg. A. Some moderate to strong homogeneously cytoplasm HBsAg stained hepatocytes (arrows) in a background of weakly stained hepatocytes. The nucleus of each homogeneously stained hepatocyte was located in the center of the cell. B. Type I ground glass hepatocyte (GGH) with dense globular or “inclusion-like” HBsAg staining (arrows) was scattered in the hepatic parenchyma. C. A cluster of type II GGHs showed HBsAg staining at the cell margin or periphery. Correlations of HBsAg expression patterns and serum HBV DNA level (Da), serum HBsAg level (Db), and intrahepatic HBsAg expression level (Dc). The association of HBsAg expression patterns and Knodell necroinflammation grade (Ea) and Ishake fibrosis stage (Eb). Comparisons among groups were analyzed by Kruskal-Wallis ANOVA.
Demographic characteristics by distribution patterns f HBsAg expression.
| HBsAg Pattern (n = 105) | |||||
|---|---|---|---|---|---|
| Mixed (n = 14) | Homogenous | Type I GGH | Type II GGH | P value | |
| (n = 34) | (n = 50) | (n = 7) | |||
| Age (yr) ± SD | 36.3 ± 9.2 | 36.3 ± 10.0 | 39.2 ± 12.7 | 40.0 ± 7.9 | 0.104 |
| Gender (male/female) | 11/3 | 26/11 | 35/15 | 6/1 | 0.720 |
| Mean AST level (U/L) ± SD | 64.9 ± 56.5 | 61.1 ± 38.6 | 49.9 ± 28.3 | 122.4 ± 168.7 | 0.474 |
| Mean ALT level (U/L) ± SD | 116.7 ± 112.4 | 114.6 ± 91.1 | 91.5 ± 63.8 | 259.1 ± 447.6 | 0.651 |
| HBV genotype (B/C) | 10/4 | 15/19 | 22/28 | 1/6 | 0.085 |
| Precore: G1896/A1896 | 0/14 | 3/31 | 4/46 | 0/7 | 0.594 |
| BCP:* mutant/wild | 4/10 | 4/30 | 12/38 | 6/1 | 0.001 |
| HBV DNA (log copies/mL) | 3.9 ± 1.0 | 4.5 ± 0.5 | 4.4 ± 0.7 | 3.6 ± 0.5 | 0.001 |
| HBsAg level ((log IU/mL) | 8.2 ± 1.1 | 8.9 ± 0.7 | 8.7 ± 1.1 | 6.9 ± 1.5 | < 0.001 |
| Knodell necroinflammation grade ± SD | 4.2 ± 2.9 | 4.2 ± 3.3 | 4.7 ± 2.7 | 8.6 ± 2.0 | 0.003 |
| Ishak fibrosis stage ± SD | 1.9 ± 1.9 | 1.9 ± 1.9 | 1.5 ± 1.3 | 4.1 ± 1.5 | 0.007 |
Mutant, T1762 and A1764; wild, A1762 and T1764. χ2 test was used for variables of gender, HBV genotype, precore and basal core promoter mutations, while Mann-Whitney U test was used for other variables. AST: aspartate aminotransferase. ALT: alanine aminotransferase. BCP: basal core promoter. HBV: hepatitis B virus.
Figure 2A to 2D shows the illustration of semiquantitative measurement of HBsAg expression. There was no patient having scale 4+ of HBsAg expression in this study. Reciprocal relationship between viral replication and liver histology was observed. Patients with 2+/3+ scales of HBsAg expression had lower levels of HBsAg titers and HBV DNA levels, but significantly severe necroinflammation grade and fibrosis stage than patients with 1+ scale of HBsAg expression and negative HBsAg staining (Figure 2E). Those patients exhibited Knodell necroinflammation grade ≥ 5 score or Ishake fibrosis stage ≥ 1 had significantly higher percentages of HBsAg expression (Figure 3).
 0% (0), (B) 1-10% (C) 11-25% (2+), and (D) 25-50% (3+) of examined hepatocytes. Correlations of HBsAg expression level and serum HBV DNA (Ea) and HBsAg levels (Eb), and Knodell necroinflammation grade (Ec) and Ishak fibrosis stage (Ed). Comparisons among groups were analyzed by Kruskal-Wallis ANOVA.")
HBsAg expression measured semi-quantitatively according to the proportion of immunolabelled cells, on a 0 to 3+ scale, corresponding to positivity in (A) 0% (0), (B) 1-10% (C) 11-25% (2+), and (D) 25-50% (3+) of examined hepatocytes. Correlations of HBsAg expression level and serum HBV DNA (Ea) and HBsAg levels (Eb), and Knodell necroinflammation grade (Ec) and Ishak fibrosis stage (Ed). Comparisons among groups were analyzed by Kruskal-Wallis ANOVA.
 and Ishak fibrosis stage (B). Comparisons between groups were analyzed by Mann-Whitney U test.")
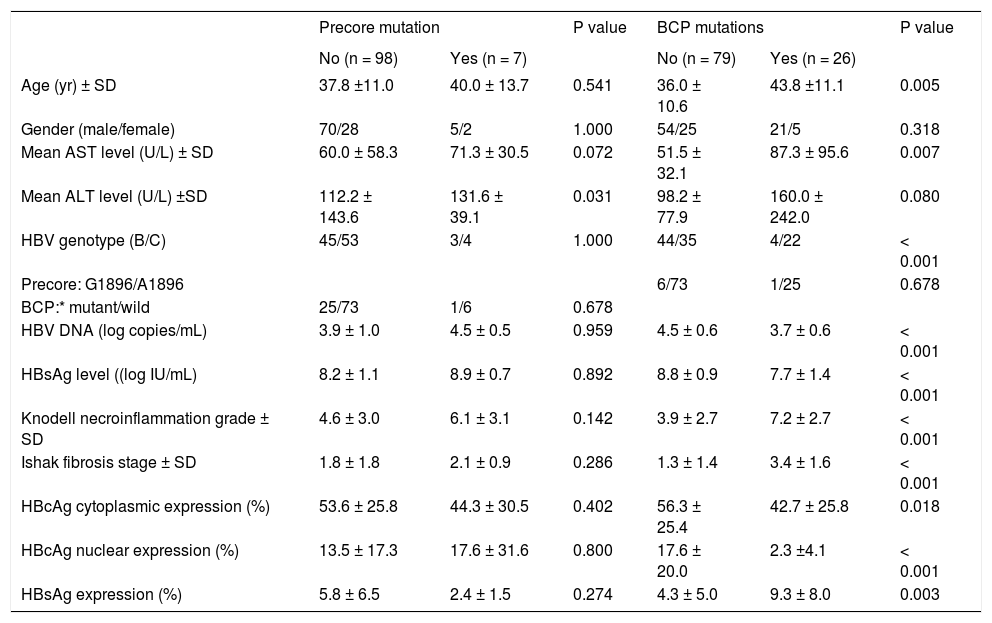
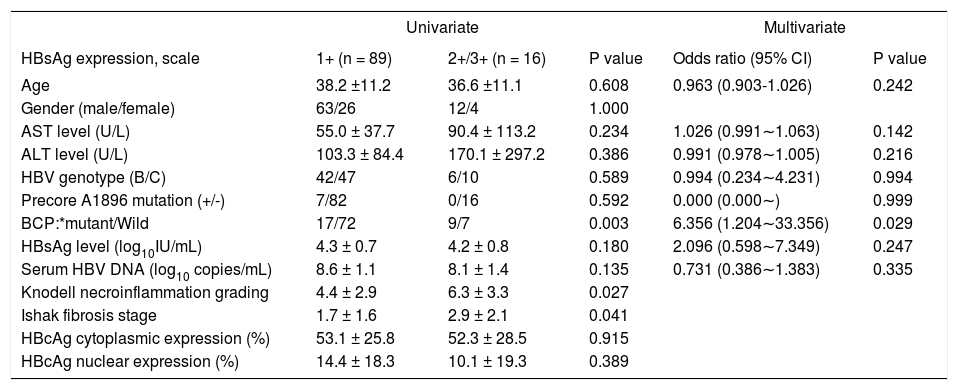
Firstly, we examined the association of viral factors and HBcAg/HBsAg expression. HBsAg expression, not HBcAg expression, showed a significant lower level in the presence of precore mutation (P = 0.001). Patients with genotype C exhibited greater liver fibrosis stage (P = 0.004). In patients with BCP T1762/A1764 mutations, there was a significantly greater necroinflammation grade and fibrosis stage, and lower HBcAg expression either in cytoplasm or in nucleus. All these observations indicated an active liver injury. Additionally, patients with BCP T1762/A1764 mutations exhibited higher intrahepatic HBsAg expression (9.3 ± 8.0% vs. 4.3 ± 5.0%, P = 0.008) (Table 3). Furthermore, we examined factors that may associate with levels of HB-sAg expression. In table 4, there were 16 patients exhibited 2+/3+ scales of HBsAg expression and 1+ scale in that of 89 patients. An univariate analysis showed 2+/3+ scales of HBsAg expression was associated with BCP T1762/A1764 mutations, and more severe liver necroinflammation and fibrosis. A multivariate regression analysis revealed that the BCP T1762/A1764 mutations was the independent factor that was associated with 2+/3+ scales of intrahepatic HBsAg expression.
Clinical, virological, and histological features of patients with or without viral mutants.
| Precore mutation | P value | BCP mutations | P value | |||
|---|---|---|---|---|---|---|
| No (n = 98) | Yes (n = 7) | No (n = 79) | Yes (n = 26) | |||
| Age (yr) ± SD | 37.8 ±11.0 | 40.0 ± 13.7 | 0.541 | 36.0 ± 10.6 | 43.8 ±11.1 | 0.005 |
| Gender (male/female) | 70/28 | 5/2 | 1.000 | 54/25 | 21/5 | 0.318 |
| Mean AST level (U/L) ± SD | 60.0 ± 58.3 | 71.3 ± 30.5 | 0.072 | 51.5 ± 32.1 | 87.3 ± 95.6 | 0.007 |
| Mean ALT level (U/L) ±SD | 112.2 ± 143.6 | 131.6 ± 39.1 | 0.031 | 98.2 ± 77.9 | 160.0 ± 242.0 | 0.080 |
| HBV genotype (B/C) | 45/53 | 3/4 | 1.000 | 44/35 | 4/22 | < 0.001 |
| Precore: G1896/A1896 | 6/73 | 1/25 | 0.678 | |||
| BCP:* mutant/wild | 25/73 | 1/6 | 0.678 | |||
| HBV DNA (log copies/mL) | 3.9 ± 1.0 | 4.5 ± 0.5 | 0.959 | 4.5 ± 0.6 | 3.7 ± 0.6 | < 0.001 |
| HBsAg level ((log IU/mL) | 8.2 ± 1.1 | 8.9 ± 0.7 | 0.892 | 8.8 ± 0.9 | 7.7 ± 1.4 | < 0.001 |
| Knodell necroinflammation grade ± SD | 4.6 ± 3.0 | 6.1 ± 3.1 | 0.142 | 3.9 ± 2.7 | 7.2 ± 2.7 | < 0.001 |
| Ishak fibrosis stage ± SD | 1.8 ± 1.8 | 2.1 ± 0.9 | 0.286 | 1.3 ± 1.4 | 3.4 ± 1.6 | < 0.001 |
| HBcAg cytoplasmic expression (%) | 53.6 ± 25.8 | 44.3 ± 30.5 | 0.402 | 56.3 ± 25.4 | 42.7 ± 25.8 | 0.018 |
| HBcAg nuclear expression (%) | 13.5 ± 17.3 | 17.6 ± 31.6 | 0.800 | 17.6 ± 20.0 | 2.3 ±4.1 | < 0.001 |
| HBsAg expression (%) | 5.8 ± 6.5 | 2.4 ± 1.5 | 0.274 | 4.3 ± 5.0 | 9.3 ± 8.0 | 0.003 |
Mutant, T1762 and A1764; wild, A1762 and T1764. χ2 test was used for variables of gender, HBV genotype, precore and basal core promoter mutations, while Mann-Whitney U test was used for other variables. AST: aspartate aminotransferase. ALT: alanine aminotransferase. BCP: basal core promoter. HBV: hepatitis B virus.
The association of demographic characteristics and degrees of HBsAg expression.
| Univariate | Multivariate | ||||
|---|---|---|---|---|---|
| HBsAg expression, scale | 1+ (n = 89) | 2+/3+ (n = 16) | P value | Odds ratio (95% CI) | P value |
| Age | 38.2 ±11.2 | 36.6 ±11.1 | 0.608 | 0.963 (0.903-1.026) | 0.242 |
| Gender (male/female) | 63/26 | 12/4 | 1.000 | ||
| AST level (U/L) | 55.0 ± 37.7 | 90.4 ± 113.2 | 0.234 | 1.026 (0.991∼1.063) | 0.142 |
| ALT level (U/L) | 103.3 ± 84.4 | 170.1 ± 297.2 | 0.386 | 0.991 (0.978∼1.005) | 0.216 |
| HBV genotype (B/C) | 42/47 | 6/10 | 0.589 | 0.994 (0.234∼4.231) | 0.994 |
| Precore A1896 mutation (+/-) | 7/82 | 0/16 | 0.592 | 0.000 (0.000∼) | 0.999 |
| BCP:*mutant/Wild | 17/72 | 9/7 | 0.003 | 6.356 (1.204∼33.356) | 0.029 |
| HBsAg level (log10IU/mL) | 4.3 ± 0.7 | 4.2 ± 0.8 | 0.180 | 2.096 (0.598∼7.349) | 0.247 |
| Serum HBV DNA (log10 copies/mL) | 8.6 ± 1.1 | 8.1 ± 1.4 | 0.135 | 0.731 (0.386∼1.383) | 0.335 |
| Knodell necroinflammation grading | 4.4 ± 2.9 | 6.3 ± 3.3 | 0.027 | ||
| Ishak fibrosis stage | 1.7 ± 1.6 | 2.9 ± 2.1 | 0.041 | ||
| HBcAg cytoplasmic expression (%) | 53.1 ± 25.8 | 52.3 ± 28.5 | 0.915 | ||
| HBcAg nuclear expression (%) | 14.4 ± 18.3 | 10.1 ± 19.3 | 0.389 | ||
Mutant, T1762 and A1764; wild, A1762 and T1764. Univariate analysis: χ2 test was used for variables of gender, HBV genotype, precore and basal core promoter mutations, while Mann-Whitney U test was used for other variables. Multivaiate analysis: Logistic regression analysis expressed as Odds ratio with 95% confidence interval and P values. AST: aspartate aminotransferase. ALT: alanine aminotransferase. BCP: basal core promoter. HBV: hepatitis B virus.
Intrahepatic HBsAg expression is associated with different replicative stages and disease evolution during natural course of chronic hepatitis B.7,10,23 Type I GGH predominantly presented in active hepatitis stage whereas type II GGH mainly in inactive or cirrhosis stage.8 In this study we demonstrated that type II GGH exhibited to associate with more severe of liver histology, accompanied with significantly lower serum HBV DNA levels and HBsAg titers, and relatively higher levels of intrahepatic HBsAg expression. This reciprocal relationship between liver histology and HBV replication indicated that the occurrence of type II GGH might be a marker of advanced liver disease during disease evolution in HBeAg positive chronic hepatitis B. Patterns of HB-sAg expression have been reported to be related with distinct viral mutations that have impacts on regulation of HBV replication and defect of surface antigen secretion from hepatocytes.9,24 Type II GGH consistently harbored Pre-S2 deletion mutations that decreased synthesis of middle surface proteins and then resulted in accumulation of large surface proteins in hepatocytes and defect of HBsAg secretion.25 In this study we performed correlation of serum HBsAg and HBV DNA between patients with or without type II GGH. Moderate correlation between the two HBV replication indicators exhibited in patient without type II GGH (r = 0.686, P < 0.001), but no correlation in patients with type II GGH (P = 0.513). The result indirectly implicated that type II GGH may have defective HBsAg secretion from hepatocytes. In addition, pre-S deletion have been reported to associate with advanced liver disease. Pre-S deletion is one of the viral factors that related to development of liver cirrhosis.26,27 Pre-S deletion could lead to ER stress and activate stress-related signal transduction. Oxidative damage of hepatocyte DNA and then stimulated DNA repair mechanisms might result in genomic instability that worsens the liver damage and is predisposed to carcinogenesis.28
In addition to patterns of HBsAg expression, we found that higher expression levels accompanied with more severe of liver histological activities and higher rate of BCP T1762/A1764 mutations. BCP T1762/A1764 mutations are strongly associated with severe liver histological activities and liver cancer.29,30 To our knowledge, there is a strong linkage between genotype C and the presence of BCP T1762/ A1764 mutations.30 In this study, genotype C seemed to play no role in HBsAg expression level. In contrast, BCP T1762/A1764 mutations showed strongly related with the HBsAg expression. With regard to viral mutation, BCP T1762/A1764 mutations may provide bases for other HBV mutations including pre-S deletion and complex mutants frequently encountered in the presence of BCP T1762/ A1764 mutations. Complex HBV mutants showed partial or complete defects in e, core, and surface protein expression and secretion.31 The reduced hepatitis B surface antigen secretion correlated with aberrant localization of surface proteins in ER and resulted in high expression of HBsAg. In addition, BCP T1762/A1764 mutation is considered to be a consequence of viral fitness because of selection pressure of the immune surveillance of the host. Similarly, pre-S2 mutations, harbor in type II GGH, coincide with the human leukocyte antigen-restricted T and B-cell epitopes.32 There is usually no cell necrosis or T lymphocyte infiltration around the type II GGHs, suggesting that HBV with the emergence of the pre-S2 deletion mutation is also a possibly novel escape mutants.33 However, the accumulation of surface antigen in hepatocytes could happen without carrying any of the known viral mutations in pre-S or S genomes or in surface promoters.31,34 Therefore, HBsAg expression could be a sequence in association with or without viral mutations.
This study had several potential limitations. The observations in this study were based on a retrospective cross-sectional design, but no longitudinal follow-up was conducted. The expression level of HBsAg in hepatocytes and histological severity may vary among various parts of the liver in a single patient; liver biopsy per se cannot exactly represent any liver tissue except for the biopsy core.
In summary, patients exhibited type II GGH pattern or higher levels of intrahepatic HBsAg expression exhibited the reciprocal relationship between more severe liver histology activities and lower HBV replication capacity. The strong association between intrahepatic HBsAg expression and BCP T1762/A1764 mutations indicated that HBsAg expression possibly could be regarded as the histological manifestation during HBV genomic evolution under host immune pressure.
Abbreviations- •
BCP: basal core promoter.
- •
GGH: ground glass hepatocyte.
- •
HBcAg: hepatitis B core antigen.
- •
HBeAg: hepatitis B e antigen.
- •
HBsAg: hepatitis B surface antigen.
- •
HBV: hepatitis B virus.
T.-T. C. has received research funding from Gilead Sciences, Bristol-Myers Squibb Company, Glaxo-SmithKline, Merck Sharp & Dohme (I.A.) Corporation and Pfizer Inc. There is no conflict of interest for the remaining authors.
Source of FundingP.-N. C. received grants from National Science Council of Taiwan (Grant number: NSC 100-2314-B-006-063) and National Cheng Kung University Hospital (Grand number: NCKUH- 10203036).


