


This study aims to measure the values of spleen stiffness (SS) in healthy subjects, the inter-operator agreement in SS measurement, and to detect statistically significant correlations between SS and age, sex, weight, BMI, portal vein dynamics and splenic dimensions.
Materials and methodsThe study included 100 healthy volunteers who had no substantial alcohol intake (<30g/daily for man, <20g/daily women), were negative on hepatitis B, hepatitis C, HIV blood serology, and had any history of lymphoproliferative disorders. Abdominal ultrasound, liver and spleen elastography were performed on each patient to search for focal splenic lesions, bile tract or portal vein dilatation, moderate/severe liver steatosis, and to measure liver and spleen stiffness.
ResultsThe mean value was 18.14 (±3.08) kPa. In the group of men (n=49), the mean was 17.73 (±2.91) kPa, whereas in the group of women (n=51) it was 16.72 (±3.32) kPa. Statistical analyses showed no correlation between spleen stiffness and sex, age, weight, and BMI. Regarding their splenoportal axis, statistically significant differences in SS were found in the means of the two subgroups of subjects stratified by their portal flow velocity (p=0.003) and spleen area (p<0.001).
Spearman's rank showed a weak association between SS and portal flow velocty (r=0.271) and splenic area (r=−0.237). ICC showed excellent (0.96) inter-operator agreement and Bland–Altman plot demonstrated no systematic over/under-estimation of spleen stiffness values.
ConclusionsOur results may serve as a reference point in the evaluation of SS especially in patients affected by advanced liver disease.
Elastography allows the detection of the mechanical properties of tissues, in an entirely non-invasive way. There are four main elastographic techniques: transient elastography (TE), point Shear Wave Elastography (pSWE), two-dimensional Shear Wave Elastography (2D-SWE) and magnetic resonance Elastography. In SWE, stiffness values are the results of elastic return forces in a tissue that acts against a deformation force (shear force). SWE determine the mechanical properties of tissues by monitoring the speed of shear waves generated by the ultrasound-induced acoustic radiation force [1]. The rationale on the use of elastography comes from the idea that tissues affected by specific diseases become “harder” than healthy tissues, (the stiffer the tissue, the higher the shear wave speed) [2].
Elastography has been widely used in the assessment of liver fibrosis, making liver biopsy almost unnecessary [3]. As for the application of spleen elastography, many centers have focused on the use of splenic elastography in patients with liver disease, correlating spleen stiffness (SS) values with the stage of liver fibrosis [4], and in the clinical work-up of patients affected by liver cirrhosis and its consequences, especially the degree of portal hypertension [5,6]. Other applications of spleen elastography include the assessment of portal hypertension and liver dysfunction after Kasai portoenterostomy [7], the monitoring of transjugular intrahepatic portosystemic shunt (TIPS) function after its placement [8], and the estimate of spleen involvement in patients with myelofibrosis [9,10].
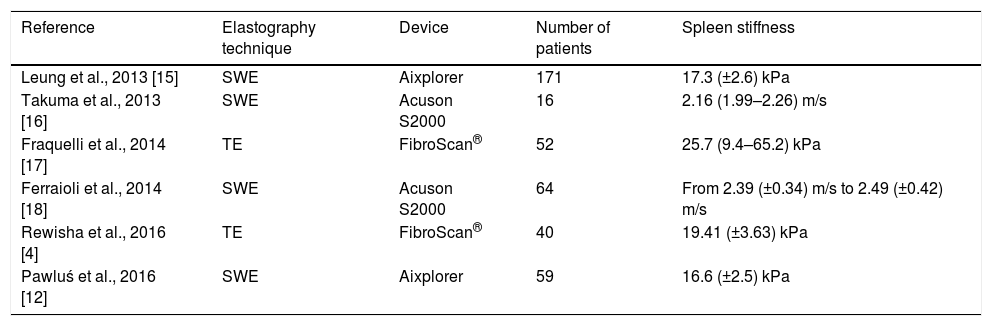
Despite the constant study of the spleen in patients affected by liver diseases, the characterization of SS in healthy individuals had been neglected, and only a few investigators have tried to determine stiffness values in healthy individuals (see Table 1). No correlation between gender and elasticity of the spleen has been detected, although some studies suggest that gender may influence stiffness values measured by SWE [11]. Authors have also evaluated the dependence of the SS on its size and did not find interconnection [12]. SS dependence on age has not been consistently established. The results of measurements performed in adults pointed out no difference between age groups, whereas some age-related correlations were described in children <18 years old [13,14].
Review of the current state of the art on spleen stiffness values in healthy individuals performed with different elastographic techniques and devices.
| Reference | Elastography technique | Device | Number of patients | Spleen stiffness |
|---|---|---|---|---|
| Leung et al., 2013 [15] | SWE | Aixplorer | 171 | 17.3 (±2.6) kPa |
| Takuma et al., 2013 [16] | SWE | Acuson S2000 | 16 | 2.16 (1.99–2.26) m/s |
| Fraquelli et al., 2014 [17] | TE | FibroScan® | 52 | 25.7 (9.4–65.2) kPa |
| Ferraioli et al., 2014 [18] | SWE | Acuson S2000 | 64 | From 2.39 (±0.34) m/s to 2.49 (±0.42) m/s |
| Rewisha et al., 2016 [4] | TE | FibroScan® | 40 | 19.41 (±3.63) kPa |
| Pawluś et al., 2016 [12] | SWE | Aixplorer | 59 | 16.6 (±2.5) kPa |
The aim of this study is to measure the values of splenic stiffness in healthy subjects, not affected by hepatic and/or hematologic diseases and to detect if there are statistically significant correlations with age, sex, weight, BMI, diameter of the portal vein, portal flow velocity, splenic longitudinal diameter and splenic surface detected at the organ's hilum.
2Materials and methodsThe study was carried out following the guidelines of the local Ethics Committee, for conducting research involving humans. 112 healthy volunteers were recruited. The studied group consisted mostly of the hospital staff, students, or their relatives older than 18 years. They were all volunteers who had no substantial past medical history of chronic liver disease and/or hematological disorder. They had no substantial alcohol intake (<30g/daily for man, <20g/daily women) and had negative hepatitis B, hepatitis C, and HIV blood serology. This original group underwent ultrasound screening for focal splenic and hepatic lesions, bile tract or portal vein dilatation, moderate/severe liver steatosis, and liver stiffness measurement. Subjects with focal splenic lesions, bile tract or portal vein dilatation, moderate/severe liver steatosis (Hamaguchi score≥3 [19]) and liver stiffness values>6.34kPa [20] were excluded from SS measurement.
2.1Ultrasonographic examinationThe ultrasound examination was conducted with a Philips Affiniti 70 instrument using a 1–5MHz convex probe, and a complete evaluation of the liver and the spleno-portal axis was performed.
Portal flow velocity was sampled at the hepatic hilum level with a probe positioned in the intercostal window, and acquisition of at least three values. The portal caliber was evaluated at the level between the portal vein and the hepatic artery with the probe positioned at the epigastric-sub-focal level. Portal vein diameter was expressed in cm, while the portal vein flow velocity was expressed in cm/s. The spleen was evaluated with supine decubitus patient via the intercostal window trying to acquire the broadest possible scan that included the splenic hilum. Both the bipolar spleen diameter (expressed in cm) and the splenic area (expressed in cm2) were measured at the organ hilum.
2.2Elastrographic examinationIn order to avoid confounding factors in stiffness measurement, patients were to arrive while fasting for at least 3h and with no caffeine intake during the previous hour [21–23].
Liver and spleen elastography was performed with the same instrument using the ElastPQ evaluation protocol. Two operators independently performed measurements of liver and spleen stiffness. Operator 1 had four years of experience in ultrasound and elastography, whereas Operator 2 had one year of experience in ultrasound and elastography examinations.
Patients were positioned in supine decubitus with the right arm (LS) or left arm (SS) in maximal abduction in order to increase the intercostal acoustic window. The region of interest (ROI) was placed between the VII and VIII segments at least 1.5cm from the hepatic capsule (LS) and preferably at the splenic lower pole at least 1cm from the splenic capsule (SS). The ROI was accurately located in an area without large liver vessels, bile ducts, and rib shadows. During the acquisition, the patient was requested to hold his/her breath for 5s. All measures obtained after a deep inspiration, maximal expiration and Valsalva maneuver were discarded [24,25]. If required, breath hold was practiced with the patient prior to initiating elastography.
The measure obtained was acquired only if its standard deviation was <30%. Ten different valid elastographic measurements were obtained in all subjects both in the liver and in the spleen, and the median value was used.
According to Boursier et al., LS measurements were considered poorly reliable when they showed a a≥0.35 interquartile (IQR)/median (M) ratio; reliable when they showed 0.15≤IQR/M<0.35 and very reliable if IQR/M<0.15 [26]. We used the same reference intervals for SS measurement. Besides, “technical failure” was defined as the impossibility to obtain any value or an IQR/M≥0.35.
2.3Statistical analysisAccording to the size of our sample, the Shapiro–Wilk test was performed to verify the normal distribution of variables. According to the test, only body weight is normally distributed within the study sample. To analyze spleen stiffness correlation with age, portal vein diameter, portal flow velocity, spleen bipolar diameter, splenic area measured at hilum, body weight and BMI, patients were dichotomically divided into two subgroups according to the median value of the considered variable and then the U Mann–Whitney test was performed to compare the means of the two subgroups.
Besides, the Spearman's rank correlation coefficient [27] was used to measure the strength and direction of the linear relationship between spleen stiffness and age, portal vein dynamics, spleen dimensions, body weight, and BMI.
Bland–Altmann test and calculation of correlation coefficient were analyzed to estimate the repeatability of splenic stiffness measurements. The inter-observer agreement of liver and spleen stiffness measurements were obtained by comparing the results of two sets of ten measurements obtained from 50 and 25 patients respectively. According to Cicchetti et al., the intraclass correlation coefficient (ICC) was classified as poor (0.00–0.40), fair (0.40–0.59), good (0.60–0.74) or excellent (ICC>0.75) [28]. Bland–Altman was analyzed by plotting the difference (value 1−value 2) between the measurements of two operators on the same patient against the mean of the two values (mean of value 1 and value 2) [29]. For all analyses, two-sided statistical significance was defined as p<0.05. Data were analyzed using SPSS (Statistical Package for Social Science) version 25.0 (IBM SPSS Statistics for MAC OS. Armonk, NY: IBM Corp.).
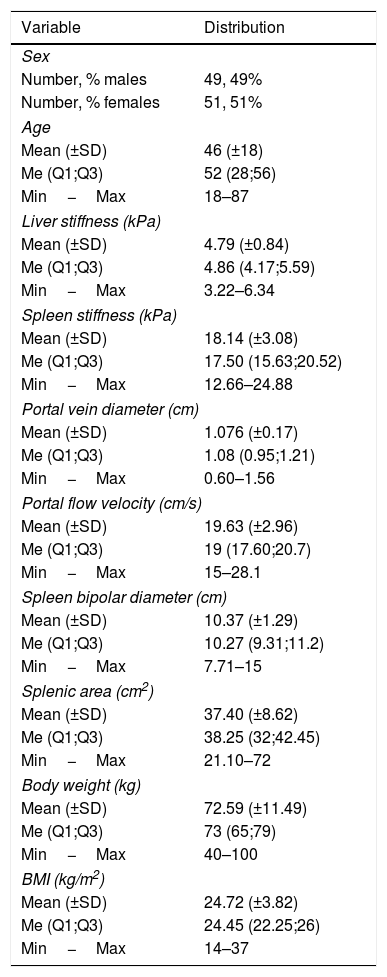
3ResultsFrom the 112 initial volunteers, 4 (3.57%) had LS values>6.34kPa and 8 (7.14%) had SS IQR/M>0.35. As a result, only 100 individuals had both LS and SS accurate measurements. The enrolled population consisted of 51 females (51%) and 49 males (49%). Their mean age was 46 (±18), with a minimum of 18 and a maximum of 87. The mean of LS and SS were 4.79 (±0.84) kPa and 18.14 (±3.08) kPa respectively. Mean portal vein diameter was 1.076 (±0.17) cm, whereas mean portal flow velocity was 19.63 (±2.96) cm/s. Spleen bipolar diameter was found to have a mean of 10.37 (±1.29) cm, while splenic area mean was 37.40 (±8.62) cm2. Regarding body weight and BMI values of our sample, they were 72.59 (±11.49) kg and 24.72 (±3.82) kg/m2 respectively (Table 2).
Distribution and frequencies of sex, age, LS, SS, portal vein diameter, portal flow velocity, splenic dimensions, body weight and BMI.
| Variable | Distribution |
|---|---|
| Sex | |
| Number, % males | 49, 49% |
| Number, % females | 51, 51% |
| Age | |
| Mean (±SD) | 46 (±18) |
| Me (Q1;Q3) | 52 (28;56) |
| Min−Max | 18–87 |
| Liver stiffness (kPa) | |
| Mean (±SD) | 4.79 (±0.84) |
| Me (Q1;Q3) | 4.86 (4.17;5.59) |
| Min−Max | 3.22–6.34 |
| Spleen stiffness (kPa) | |
| Mean (±SD) | 18.14 (±3.08) |
| Me (Q1;Q3) | 17.50 (15.63;20.52) |
| Min−Max | 12.66–24.88 |
| Portal vein diameter (cm) | |
| Mean (±SD) | 1.076 (±0.17) |
| Me (Q1;Q3) | 1.08 (0.95;1.21) |
| Min−Max | 0.60–1.56 |
| Portal flow velocity (cm/s) | |
| Mean (±SD) | 19.63 (±2.96) |
| Me (Q1;Q3) | 19 (17.60;20.7) |
| Min−Max | 15–28.1 |
| Spleen bipolar diameter (cm) | |
| Mean (±SD) | 10.37 (±1.29) |
| Me (Q1;Q3) | 10.27 (9.31;11.2) |
| Min−Max | 7.71–15 |
| Splenic area (cm2) | |
| Mean (±SD) | 37.40 (±8.62) |
| Me (Q1;Q3) | 38.25 (32;42.45) |
| Min−Max | 21.10–72 |
| Body weight (kg) | |
| Mean (±SD) | 72.59 (±11.49) |
| Me (Q1;Q3) | 73 (65;79) |
| Min−Max | 40–100 |
| BMI (kg/m2) | |
| Mean (±SD) | 24.72 (±3.82) |
| Me (Q1;Q3) | 24.45 (22.25;26) |
| Min−Max | 14–37 |
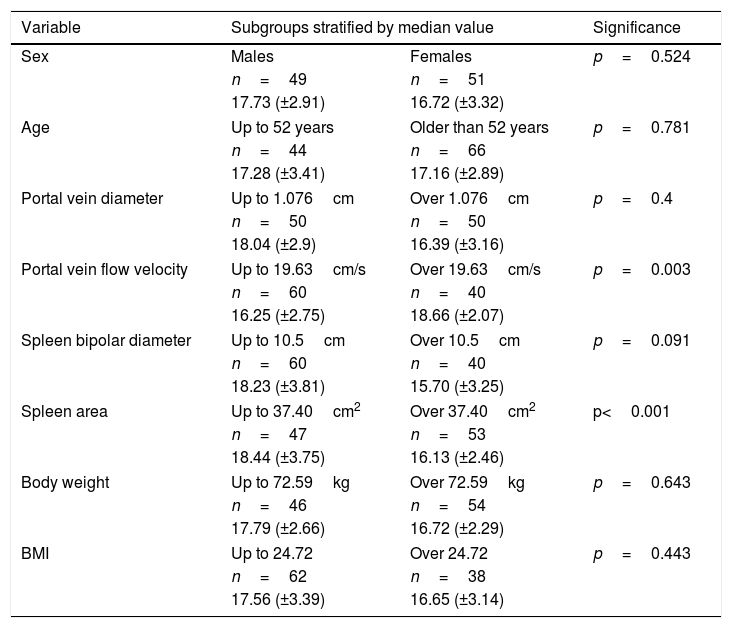
The median value of spleen stiffness was 18.14 (±3.08) kPa. In the group of women, the mean value of spleen stiffness was 16.72 (±3.32) kPa, and in the group of men, it was 17.73 (±2.91) kPa. There was no statistically significant difference between these two groups (p=0.524).
In the subgroup including individuals up to the age of 52, the mean value of spleen stiffness was 17.28 (±3.41) kPa, whereas, in subjects older than 52 years old, it was 17.16 (±2.89) kPa. No statistically difference between these two subgroups was observed (p=0.781).
Volunteers were divided into subgroups according to portal vein diameter and portal vein flow velocity. The data indicates that in the group with portal vein diameter up to 1.076cm, spleen stiffness was 18.04 (±2.9) kPa, while in subjects with a portal vein broader than 1.076cm, spleen stiffness was 16.39 (±3.16) kPa. There was no statistically significant difference between these two groups (p=0.4). In the group with a portal flow lower than 19.63cm/s, spleen stiffness was 16.25 (±2.75) kPa, whereas with a flow faster than 19.63cm/s, spleen stiffness was 18.66 (±2.07) kPa. The median of two groups are statistically different (p=0.003).
Patients were divided according to the median value of spleen bipolar diameter and splenic area. In the group with bipolar spleen diameter up to 10.5cm, the average spleen stiffness was found to be 18.23 (±3.81) kPa, while in the group with a bipolar spleen diameter above 10.5cm, it was 15.70 (±3.25) kPa. No statistically difference between these two subgroups was observed (p=0.091). In the group with a spleen area measured at hilum smaller than 37.40cm2, spleen stiffness was 18.44 (±3.75) kPa; in the group with a spleen surface higher than 37.40cm2, spleen stiffness was 16.13 (±2.46) kPa. The means of the patient with smaller splenic area appeared to be statistically significantly higher than the group with a broader splenic area (p<0.001).
Subjects were stratified according to body weight and BMI. The data shows that in the subgroup with a weight up to 72.59kg, spleen stiffness was 17.79 (±2.66) kPa, while it was 16.72 (±2.29) kPa in subjects heavier than 72.59kg. No statistically difference between these two subgroups was observed in the two groups (p=0.643). In the subgroup with a BMI lower than 24.72, spleen stiffness was 17.56 (±3.39) kPa, whereas it was 16.65 (±3.14) kPa in individuals with a BMI higher than 24.72. There was no statistically significant difference between the two groups (p=0.443) (Table 3).
Mann–Whitney test results. Patients were stratified according to the median value of each variable and then means of each subgroup were compared. The medians of portal vein flow velocity (p=0.003) and spleen area (p<0.001) in the two subgroups are statistically different.
| Variable | Subgroups stratified by median value | Significance | |
|---|---|---|---|
| Sex | Males | Females | p=0.524 |
| n=49 | n=51 | ||
| 17.73 (±2.91) | 16.72 (±3.32) | ||
| Age | Up to 52 years | Older than 52 years | p=0.781 |
| n=44 | n=66 | ||
| 17.28 (±3.41) | 17.16 (±2.89) | ||
| Portal vein diameter | Up to 1.076cm | Over 1.076cm | p=0.4 |
| n=50 | n=50 | ||
| 18.04 (±2.9) | 16.39 (±3.16) | ||
| Portal vein flow velocity | Up to 19.63cm/s | Over 19.63cm/s | p=0.003 |
| n=60 | n=40 | ||
| 16.25 (±2.75) | 18.66 (±2.07) | ||
| Spleen bipolar diameter | Up to 10.5cm | Over 10.5cm | p=0.091 |
| n=60 | n=40 | ||
| 18.23 (±3.81) | 15.70 (±3.25) | ||
| Spleen area | Up to 37.40cm2 | Over 37.40cm2 | p<0.001 |
| n=47 | n=53 | ||
| 18.44 (±3.75) | 16.13 (±2.46) | ||
| Body weight | Up to 72.59kg | Over 72.59kg | p=0.643 |
| n=46 | n=54 | ||
| 17.79 (±2.66) | 16.72 (±2.29) | ||
| BMI | Up to 24.72 | Over 24.72 | p=0.443 |
| n=62 | n=38 | ||
| 17.56 (±3.39) | 16.65 (±3.14) | ||
Spearman's rank test showed that portal vein flow velocity has a weak positive correlation (ρ=0.271) with spleen stiffness. At the same time spleen size appeared to have a negative correlation with spleen stiffness, in particular, the correlation between SS and spleen bipolar diameter was very weak (ρ=0.151) and weak between SS and splenic area (ρ=−0.237). No correlation was found between SS and portal vein diameter (ρ=−0.022), body weight (ρ=−0.033) and BMI (ρ=−0.046) (Fig. 1).
3.3Repeatability of liver and spleen stiffness examination
The ICC of 50 LS measurements was 0.935 for single measures (95% 0.88–0.96), and 0.97 (95% C.I. 0.94–0.98) for average measures which indicates excellent interoperator agreement. The ICC of 25 SS measurement was 0.92 for single measures (95% C.I. 0.84–0.96), and 0.96 (95% C.I. 0.92–0.98) for average measures which indicates excellent interoperator agreement. Bland–Altmann plot showed no systematic overestimation or underestimation between the two operators in both liver and spleen stiffness measurements. Mean difference for LS measurements was 0.46, with 95% limits of agreement between −0.375 and 0.46. Mean difference for SS measurements was 0.029, with 95% limits of agreement between −0.50 and 0.56(Fig. 2).
4Discussion
Elastography is a cutting-edge methodology, which has brought great enthusiasm to the study of tissue elasticity. Liver elastography has already been considered, not only as an excellent tool for assessing liver fibrosis but also as a good surrogate for portal pressure assessment [30]. For this reason, LS has made its way into the guidelines for the diagnosis, stratification, and classification of liver diseases. In the setting of portal hypertension, SS appeared to be more accurate to detect esophageal varices if compared to LS and other non-invasive combined scores (such as PSR and LSPS) [31,32]. In particular, a recent metanalysis showed that SS is a better predictor than LS in the detection of esophageal varices [33]. This difference may be interpreted by the different pathophysiology of stiffness increase between liver and spleen. The liver parenchyma becomes stiffer by the deposition of collagen fibers that follows hepatic damage [34]. On the long term, this leads to increased intrahepatic resistance and development of portal hypertension [35]. Anatomically, the portal vein arises by the confluence of the superior mesenteric and splenic veins; therefore the liver vasculature is directly connected with the splenic vein. Consequently, disorders in portal blood flow (i.e., portal hypertension) may lead to spleen congestion, increasing its stiffness [36]. We could say that SS may serve as a surrogate for the dynamic component of portal hypertension, thus resulting in a better performance in discriminating clinically significant portal hypertension (if compared to LS). Our data showed a positive correlation between SS and portal flow velocity, thus confirming that portal flow may directly affect SS values. Besides, SS values appeared to be higher in those with a narrower splenic area, and this may suggest that in a smaller spleen the same amount of blood flows in more confined parenchyma, thus slightly increasing its stiffness.
The mean value of SS obtained in our center was 18.14 (±3.08) kPa, and it was similar to the one obtained by other researchers (see Table 1). Besides, we did not find any correlation between SS and age, sex, and anthropometric characteristics.
One initial criticism made to spleen elastography is related to its unfeasibility in patients with smaller spleens. For example, Procopet et al. experienced a failure rate of 40% in patients without splenomegaly [37]. Studies which assessed the effect of training on failure rate and repeatability of SS pointed out the importance of the operator's expertise, and that a learning curve in pSWE acquisition should be taken into account [18]. Accordingly, we selected two operators who had the best expertise in SS measurements (having performed more than 3000 single measurements of SS each), and we did not experience such failure rates even in smaller spleens. In our study, the ICC for SS was 0.96, which was slightly lower than the one obtained with LS (0.97). Furthermore, from what emerged from the Blond-Altman plot, neither of the two operators systemically overestimated or underestimated LS and SS values.
Another critique regards the concordance of stiffness values between different elastography techniques. Even systems that use similar techniques but are manufactured by different companies can provide different measurement different reference values. Manufacturers have demonstrated that differences in measurements between machines and observers can vary on the order of 12% [38]. This means that results from different studies are not always directly applicable in other settings.
Hence, we believe that our findings may serve as a comparison to determine normal SS values in clinical settings that utilize pSWE with Philips Affiniti 70.AbbreviationsSS spleen stiffness liver stiffness body mass index intraclass correlation coefficient transient elastography point shear wave elastography two-dimensional shear wave elastography transjugular intrahepatic portosystemic shunt platelet count to spleen diameter ratio liver stiffness-spleen size-to-platelet ratio
Conception or design of the work: Mauro Giuffrè, Daniele Macor, Lory Saveria Crocè.
Data collection: Mauro Giuffrè, Daniele Macor, Riccardo Patti, Matteo Rossano Buonocore, Anna Colombo, Alessia Visintin, Michele Campigotto.
Data analysis and interpretation: Mauro Giuffrè, Fabio Tinè.
Drafting the article: Mauro Giuffrè, Daniele Macor, Flora Masutti, Cristiana Abazia, Lory Saveria Crocè.
Critical revision of the article: Mauro Giuffrè, Daniele Macor, Flora Masutti, Cristiana Abazia, Fabio Tinè, Riccardo Patti, Matteo Rossano Buonocore, Anna Colombo, Alessia Visintin, Michele Campigotto, and Lory Saveria Crocè.
Final approval of the version to be published: Mauro Giuffrè, Daniele Macor, Flora Masutti, Cristiana Abazia, Fabio Tinè, Riccardo Patti, Matteo Rossano Buonocore, Anna Colombo, Alessia Visintin, Michele Campigotto, and Lory Saveria Crocè.
Conflict of interestThe authors declare no conflict of interest.


