


It has been proposed that plasma concentration of bilirubin, an endogenous antioxidant, is protective against diseases mediated by increased oxidative stress, including cardiovascular diseases (CVD) and cancer. To examine this hypothesis, we investigated the relationship between plasma bilirubin concentrations and bilirubin UDP-glucuronosyl transferase (UGT1A1) promoter gene variations (associated with increased bilirubin concentrations) with total/CVD and cancer mortality.
Materials and methodsA nested case–control study was conducted within the Polish arm of the HAPIEE cohort. At baseline in 2002–2005, participants were examined in detail. Mortality follow-up (median (IQR) between blood draw and death was 3.7 (2.1–5.1) years) was performed by linkage with regional and national death registers. Plasma biomarkers were analysed in all subjects who died from any cause (cases, n=447) and in a random subsample of survivors (controls, n=1423).
ResultsThere was a strong negative association between plasma bilirubin levels and total and cancer mortality, expressed more profoundly in men. The adjusted OR of deaths from all causes and cancer, comparing the highest vs. lowest plasma bilirubin categories were 0.61 (95% CI: 0.42–0.87) and 0.39 (0.24–0.65), respectively. There was no association of bilirubin with CVD mortality. The UGT1A1*28 allele, a genetic marker of raised bilirubin, was also negatively associated with total/cancer mortality, although the associations were not statistically significant.
DiscussionBoth the observational and genetic associations support the negative relationship between bilirubin and total mortality; this association appears to be driven by cancer mortality, while that with CVD mortality is not evident.
The role of increased oxidative stress in the pathogenesis of cardiovascular disease (CVD) and cancer, and the associated effects of various antioxidants, have been intensively discussed in the literature [1,2]. In this context, bilirubin, the final product of the heme catabolic pathway in the intravascular compartment, is recognised as one of the most potent endogenous antioxidants. Elevated systemic concentrations of bilirubin were for decades considered an ominous sign of liver diseases, but recent data suggest that mildly increased bilirubin concentrations might exert potent protective effects against oxidative stress-related diseases, including cardiovascular and cancer diseases [3–5], and this may result in lower risk of total mortality [3]. This protective relationship appears to be linear; it has been reported that each unit increase of systemic bilirubin concentrations has been associated with decrease in cardiovascular and cancer risk [6,7] while plasma bilirubin concentrations below 10μmol/L, although still within the current physiological range, appear to confer increased risks of a variety of oxidative stress-mediated diseases [8].
Bilirubin is metabolised in the liver tissue by the conjugation enzyme UGT1A1 (bilirubin UDP-glucuronosyl transferase 1), whose gene (OMIM accession no. 191740) is the major genetic determinant of its systemic bilirubin concentrations [9]. In fact, inherited mild deficiency of UGT1A1 is the basis of a Gilbert syndrome (OMIM accession no. 143500), also known as benign hyperbilirubinemia. In most of Caucasian subjects, Gilbert syndrome is caused by the functional (TA) repeat variation located within the ATATAA element in the promoter UGT1A1 gene region. In comparison with the shorter wild-type (TA)6 allele, the presence of the longer allele (TA)7 (known also as UGT1A1*28 allele) is associated with lower gene expression and bilirubin concentrations in (TA)7 homozygotes are significantly higher than in carriers of at least one (TA)6 allele [10]. It is important to stress, that the penetrance of Gilbert syndrome genotype is only 50% (virtually only ½ of these subjects manifest with mild unconjugated hyperbilirubinemia) [10], a phenomenon confounding results of studies evaluating the effect of UGT1A1 gene mutations on various phenotypes.
The aim of our study was thus to analyse the prospective associations between the plasma concentrations of bilirubin, the TA UGT1A1 promoter gene tandem repeat polymorphism, and total, cardiovascular and cancer mortality in a nested case–control study established within a large population-based cohort study in Poland.
1Material and methods1.1Subjects in the cohort and in the nested case–control studyThis study used data collected by the Polish arm of the multicentre HAPIEE (Health, Alcohol, and Psychosocial factors in Eastern Europe) cohort study [11,12]. At baseline in 2002–2005, the study examined a random sample of men and women aged 45–69 years living in 4 districts of the city of Krakow, Poland. A total of 10,728 individuals were recruited (response rate 61%), 8860 of whom provided a blood sample. All examined subjects were of self-reported Caucasian ethnicity. The study complied with the Helsinki Declaration and was approved by the Ethics Committees of University College London and the Jagiellonian University, Krakow. All subjects provided a written informed consent.
Since there was not sufficient funding for laboratory analyses of all blood samples, this report is based on a nested case–control study established within this cohort. The nested case–control has been described in detail elsewhere (including 3 other cohorts without bilirubin measurements cohort) [13]. Briefly, cases were all subjects who died from any cause during the follow-up (cases, n=447), and controls were a random subsample of survivors (controls, n=1423). Controls were chosen from participants who were alive at the time when the analytical sample was selected. The date of this was the 31st December 2010, which was, on average, 7 years after baseline data collection.
1.2Measurements and mortality follow-upParticipants completed a face-to-face interview, covering their medical history, healthy behaviours and socio-demographic and psychosocial characteristics, underwent an examination and provided a venous blood sample. Local and national death registers in Krakow were used to identify mortality rates amongst the participants. Causes of death were determined using the 10th revision of the International Classification of Diseases (ICD): CVD (I00-I99), cancer (C00-D48) or causes other than those above (all other ICD codes). Follow-up time for each participant was calculated as the time between enrolment to the study and date of either death or the last contact (for those who did not die); the mean follow-up of subjects in the nested case–control study was 6.4 years. The median (IQR) follow-up time of cases was 3.7 years (2.1–5.1).
1.3Laboratory analysesBilirubin, ALT, urea and CRP in frozen baseline plasma samples were determined on automatic analyser (UniCel DxC 800 Synchron Clinical Systems, Beckman Coulter, UK) using commercially available kits and reference materials from Beckman Coulter at Wageningen University (The Netherlands). DNA has been isolated by a modified salting-out method [14]. TA repeat polymorphism within the UGT1A1 gene has been genotyped by the KASP™ technology custom assay (www.lgcgroup.com). This method is unable to detect rare alleles obtaining the 5 and 8 repeats, but as these subjects represent less than 1% of the general population (https://www.ncbi.nlm.nih.gov/projects/SNP/snp_ref.cgi?rs=8175347), they were neglected in the further analyses.
1.4Statistical analysesThe associations of plasma bilirubin concentrations with mortality outcomes were analysed by multivariable adjusted logistic regression in several steps. We categorised plasma bilirubin concentrations using 17 and 10μmol/L cut-offs in order to make the results more meaningful for clinical practice and comparable with previous studies (the value of 17μmol/L is the upper limit of the normal bilirubin concentration, while levels lower than 10μmol/L have been proposed by previous studies as a potential risk factor for cardiovascular mortality [15]).
In model 1, the relationships were adjusted for participants’ age and sex (the basic confounders which are adjusted for in most epidemiological studies). In model 2, the odds ratios were further adjusted for education, marital status, alcohol intake, smoking, body mass index, energy intake and the ratio of total/HDL cholesterol (usually found to be related to the exposure (plasma bilirubin) or the outcome (mortality) in most studies and therefore considered as potential confounders). In model 3, odds ratios were further adjusted for plasma ALT, GGT, CRP and urea as potential biomarkers (which have also been shown to be related to bilirubin and mortality, in order to assess the strength of the associations independently of these factors). The analyses of mortality by the UGT1A1 genotype were adjusted for age and sex (model 1, as above) and additionally for bilirubin concentrations to assess whether the effect of genotype on mortality was explained by bilirubin, or whether there is another pathway linking the genotype with the outcome (model 2). This part of the analysis was a Mendelian randomisation study where a genetic marker of a specific phenotype (e.g. plasma bilirubin) is used to test a potential causal association between the phenotype and disease. The Mendelian randomisation method is often seen as a close parallel to randomised controlled trial and, if the assumptions are fulfilled, it should provide unbiased and unfounded estimates between the two variables [16,17].
The interaction between sex and bilirubin concentrations, as well as between sex and UGT1A1 genotype, were tested in the association with mortality by the likelihood ratio test which compared the nested models with or without multiplicative interaction term. There were no statistically significant interactions with sex in any of the examined associations. Therefore, men and women were analysed together.
All statistical analyses were carried out using the 13.1 version of the statistical software STATA (StataCorp, Texas, USA), p-values <0.05 were considered statistically significant.
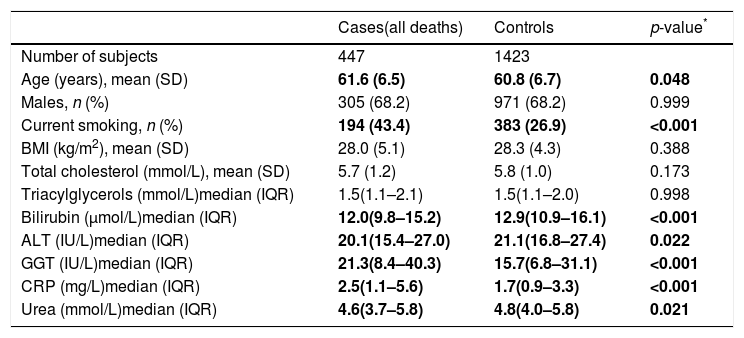
2ResultsThe nested case–control study consisted from 1870 individuals, of whom 447 were cases (i.e. they died from any cause, of which 139 were from CVD and 211 from cancer); the 1423 survivors served as controls. Descriptive characteristics of subjects included in the nested case–control study are shown in Table 1. The median plasma bilirubin concentration in the overall sample was 12.8μmol/L (13.5μmol/L in men, 11.6μmol/L in women). Compared to controls subjects who died had significantly lower plasma bilirubin concentrations (Table 1). Clinically important elevations of ALT and GGT activities were seen in 8.6% and 19.5% of subjects, respectively.
Descriptive characteristics of the study sample.
| Cases(all deaths) | Controls | p-value* | |
|---|---|---|---|
| Number of subjects | 447 | 1423 | |
| Age (years), mean (SD) | 61.6 (6.5) | 60.8 (6.7) | 0.048 |
| Males, n (%) | 305 (68.2) | 971 (68.2) | 0.999 |
| Current smoking, n (%) | 194 (43.4) | 383 (26.9) | <0.001 |
| BMI (kg/m2), mean (SD) | 28.0 (5.1) | 28.3 (4.3) | 0.388 |
| Total cholesterol (mmol/L), mean (SD) | 5.7 (1.2) | 5.8 (1.0) | 0.173 |
| Triacylglycerols (mmol/L)median (IQR) | 1.5(1.1–2.1) | 1.5(1.1–2.0) | 0.998 |
| Bilirubin (μmol/L)median (IQR) | 12.0(9.8–15.2) | 12.9(10.9–16.1) | <0.001 |
| ALT (IU/L)median (IQR) | 20.1(15.4–27.0) | 21.1(16.8–27.4) | 0.022 |
| GGT (IU/L)median (IQR) | 21.3(8.4–40.3) | 15.7(6.8–31.1) | <0.001 |
| CRP (mg/L)median (IQR) | 2.5(1.1–5.6) | 1.7(0.9–3.3) | <0.001 |
| Urea (mmol/L)median (IQR) | 4.6(3.7–5.8) | 4.8(4.0–5.8) | 0.021 |
SD=standard deviation, IQR=interquartile range.
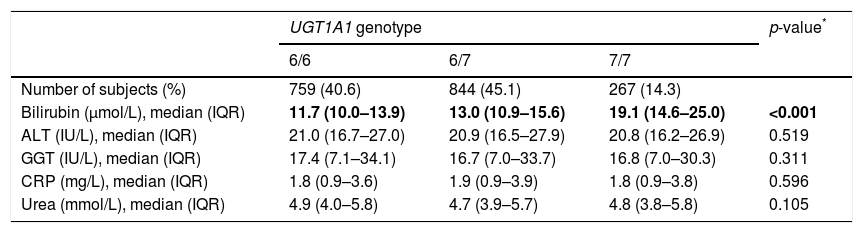
The distribution of UGT1A1 genotypes was in agreement with HW equilibrium (p=0.19), and the allele frequencies were similar to the other Caucasian populations (Table 2) [10]. As expected, there was an association between the UGT1A1 genotypes and plasma bilirubin concentrations; 7/7 homozygotes had significantly higher plasma bilirubin concentrations compared to carriers of at least one allele 6 (Table 2). Other biochemical and anthropometrical parameters of interest (ALT, GGT, CRP, urea) were distributed independently of the UGT1A1 repeat polymorphism.
Distribution of UGT1A1 genotypes in the study sample (cases and controls combined) and values of bilirubin, ALT, GGT, CRP and urea by UGT1A1 genotype.
| UGT1A1 genotype | p-value* | |||
|---|---|---|---|---|
| 6/6 | 6/7 | 7/7 | ||
| Number of subjects (%) | 759 (40.6) | 844 (45.1) | 267 (14.3) | |
| Bilirubin (μmol/L), median (IQR) | 11.7 (10.0–13.9) | 13.0 (10.9–15.6) | 19.1 (14.6–25.0) | <0.001 |
| ALT (IU/L), median (IQR) | 21.0 (16.7–27.0) | 20.9 (16.5–27.9) | 20.8 (16.2–26.9) | 0.519 |
| GGT (IU/L), median (IQR) | 17.4 (7.1–34.1) | 16.7 (7.0–33.7) | 16.8 (7.0–30.3) | 0.311 |
| CRP (mg/L), median (IQR) | 1.8 (0.9–3.6) | 1.9 (0.9–3.9) | 1.8 (0.9–3.8) | 0.596 |
| Urea (mmol/L), median (IQR) | 4.9 (4.0–5.8) | 4.7 (3.9–5.7) | 4.8 (3.8–5.8) | 0.105 |
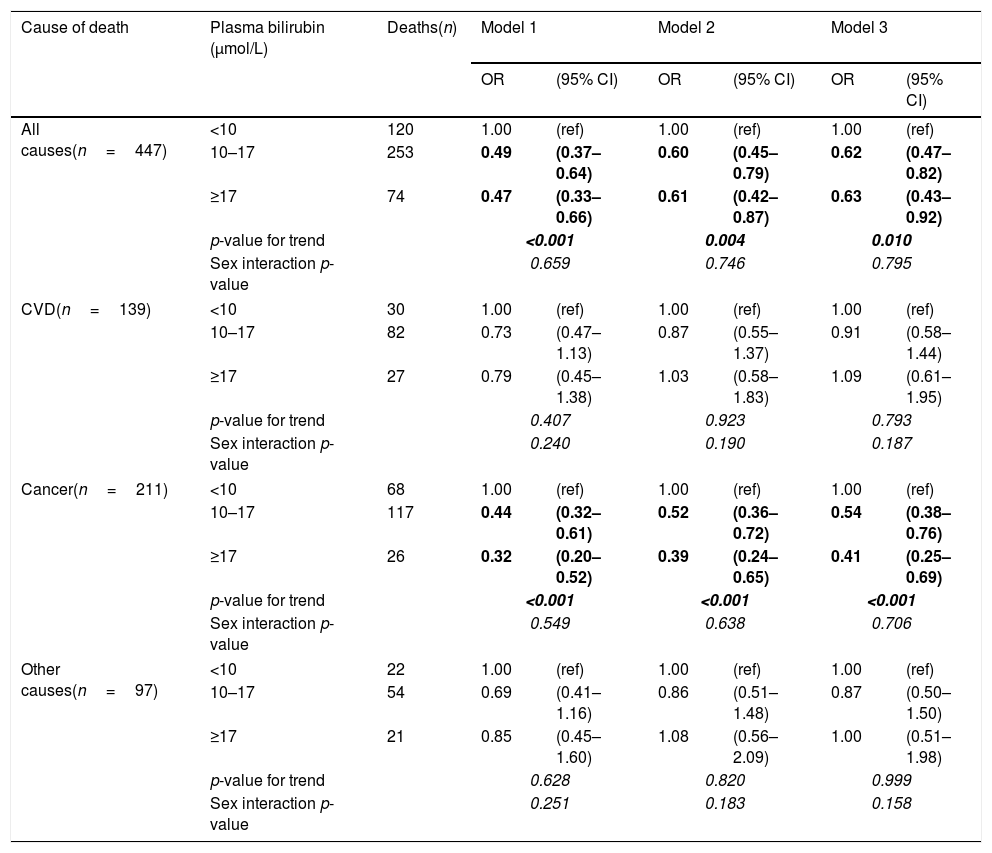
After controlling for age and sex, there was a strong negative association of plasma bilirubin categories with risk of death from all causes and cancer mortality but not from CVD (Table 3). These results remained significant even after adjusting for potential confounders, including age, education, marital status, alcohol intake, smoking, BMI, energy intake, total/HDL cholesterol ratio (model 2). In the adjusted model, the odds ratios in the highest vs. lowest bilirubin categories for death from all causes, cancer and CVD were 0.61 (95% CI: 0.42–0.87), 0.39 (0.24–0.65) and 1.03 (0.58–1.83), respectively (Table 3). After additionally adjusting for elevated plasma ALT, GGT activities, as well as CRP and urea concentrations (model 3), the pattern of results remained similar, although the confidence intervals became wider due to loss of statistical power in the multivariable model. All the studies on the association between bilirubin and clinical outcomes published so far have paid extreme attention to gender with female sex having negligible relationship, whereas males almost always having benefits from higher bilirubin concentrations. For this reason we also conducted gender-specific analyses. In these additional analyses, investigated associations were stronger in men than women (Table 4), although the interactions between bilirubin and sex were not statistically significant.
Odds ratios (OR) and 95% confidence intervals (95% CI) of mortality by plasma bilirubin concentrations calculated with logistic regression models.
| Cause of death | Plasma bilirubin (μmol/L) | Deaths(n) | Model 1 | Model 2 | Model 3 | |||
|---|---|---|---|---|---|---|---|---|
| OR | (95% CI) | OR | (95% CI) | OR | (95% CI) | |||
| All causes(n=447) | <10 | 120 | 1.00 | (ref) | 1.00 | (ref) | 1.00 | (ref) |
| 10–17 | 253 | 0.49 | (0.37–0.64) | 0.60 | (0.45–0.79) | 0.62 | (0.47–0.82) | |
| ≥17 | 74 | 0.47 | (0.33–0.66) | 0.61 | (0.42–0.87) | 0.63 | (0.43–0.92) | |
| p-value for trend | <0.001 | 0.004 | 0.010 | |||||
| Sex interaction p-value | 0.659 | 0.746 | 0.795 | |||||
| CVD(n=139) | <10 | 30 | 1.00 | (ref) | 1.00 | (ref) | 1.00 | (ref) |
| 10–17 | 82 | 0.73 | (0.47–1.13) | 0.87 | (0.55–1.37) | 0.91 | (0.58–1.44) | |
| ≥17 | 27 | 0.79 | (0.45–1.38) | 1.03 | (0.58–1.83) | 1.09 | (0.61–1.95) | |
| p-value for trend | 0.407 | 0.923 | 0.793 | |||||
| Sex interaction p-value | 0.240 | 0.190 | 0.187 | |||||
| Cancer(n=211) | <10 | 68 | 1.00 | (ref) | 1.00 | (ref) | 1.00 | (ref) |
| 10–17 | 117 | 0.44 | (0.32–0.61) | 0.52 | (0.36–0.72) | 0.54 | (0.38–0.76) | |
| ≥17 | 26 | 0.32 | (0.20–0.52) | 0.39 | (0.24–0.65) | 0.41 | (0.25–0.69) | |
| p-value for trend | <0.001 | <0.001 | <0.001 | |||||
| Sex interaction p-value | 0.549 | 0.638 | 0.706 | |||||
| Other causes(n=97) | <10 | 22 | 1.00 | (ref) | 1.00 | (ref) | 1.00 | (ref) |
| 10–17 | 54 | 0.69 | (0.41–1.16) | 0.86 | (0.51–1.48) | 0.87 | (0.50–1.50) | |
| ≥17 | 21 | 0.85 | (0.45–1.60) | 1.08 | (0.56–2.09) | 1.00 | (0.51–1.98) | |
| p-value for trend | 0.628 | 0.820 | 0.999 | |||||
| Sex interaction p-value | 0.251 | 0.183 | 0.158 | |||||
Model 1: Adjusted for age and sex.
Model 2: Additionally adjusted for education, marital status, alcohol intake, smoking, BMI, energy intake, total cholesterol/HDL ratio.
Model 3: Adjusted for all variables in model 2 and plasma ALT and GGT activities, and CRP and urea concentration.
Values in bold and italics are highlighting stadistical significance of the results.
Odds ratios (OR) and 95% confidence intervals (95% CI) of mortality by plasma bilirubin concentrations by sex, calculated with logistic regression.
| (a) men | ||||||||
|---|---|---|---|---|---|---|---|---|
| Causes of death | Plasma bilirubin (μmol/L) | Deaths(n) | Model 1 | Model 2 | Model 3 | |||
| OR | (95% CI) | OR | (95% CI) | OR | (95% CI) | |||
| All cause(n=305) | <10 | 71 | 1.00 | (ref) | 1.00 | (ref) | 1.00 | (ref) |
| 10–17 | 173 | 0.44 | (0.31–0.62) | 0.55 | (0.39–0.80) | 0.57 | (0.40–0.83) | |
| ≥17 | 61 | 0.42 | (0.28–0.63) | 0.58 | (0.38–0.90) | 0.59 | (0.38–0.92) | |
| p-value for trend | <0.001 | 0.024 | 0.031 | |||||
| CVD(n=98) | <10 | 21 | 1.00 | (ref) | 1.00 | (ref) | 1.00 | (ref) |
| 10–17 | 55 | 0.55 | (0.33–0.95) | 0.65 | (0.37–1.14) | 0.72 | (0.41–1.26) | |
| ≥17 | 22 | 0.61 | (0.33–1.16) | 0.81 | (0.41–1.56) | 0.92 | (0.46–1.79) | |
| p-value for trend | 0.184 | 0.606 | 0.868 | |||||
| Cancer(n=134) | <10 | 39 | 1.00 | (ref) | 1.00 | (ref) | 1.00 | (ref) |
| 10–17 | 75 | 0.37 | (0.23–0.57) | 0.44 | (0.28–0.70) | 0.45 | (0.28–0.71) | |
| ≥17 | 20 | 0.26 | (0.15–0.47) | 0.35 | (0.19–0.64) | 0.35 | (0.19–0.64) | |
| p-value for trend | <0.001 | <0.001 | 0.001 | |||||
| Other cause(n=73) | <10 | 11 | 1.00 | (ref) | 1.00 | (ref) | 1.00 | (ref) |
| 10–17 | 43 | 0.97 | (0.49–1.92) | 1.27 | (0.62–2.60) | 1.24 | (0.60–2.58) | |
| ≥17 | 19 | 1.16 | (0.54–2.50) | 1.51 | (0.67–3.40) | 1.31 | (0.56–3.03) | |
| p-value for trend | 0.641 | 0.316 | 0.560 | |||||
| (b) Women | ||||||||
|---|---|---|---|---|---|---|---|---|
| Causes of death | Plasma bilirubin (μmol/L) | Deaths(n) | Model 1 | Model 2 | Model 3 | |||
| OR | (95% CI) | OR | (95% CI) | OR | (95% CI) | |||
| All cause(n=142) | <10 | 49 | 1.00 | (ref) | 1.00 | (ref) | 1.00 | (ref) |
| 10–17 | 80 | 0.57 | (0.37–0.87) | 0.66 | (0.43–1.03) | 0.71 | (0.45–1.11) | |
| ≥17 | 13 | 0.58 | (0.29–1.16) | 0.61 | (0.29–1.27) | 0.63 | (0.30–1.35) | |
| p-value for trend | 0.022 | 0.078 | 0.128 | |||||
| CVD(n=41) | <10 | 9 | 1.00 | (ref) | 1.00 | (ref) | 1.00 | (ref) |
| 10–17 | 27 | 1.19 | (0.54–2.60) | 1.51 | (0.67–3.41) | 1.57 | (0.69–3.59) | |
| ≥17 | 5 | 1.37 | (0.44–4.27) | 1.58 | (0.47–5.21) | 1.57 | (0.46–5.32) | |
| p-value for trend | 0.568 | 0.356 | 0.348 | |||||
| Cancer(n=77) | <10 | 29 | 1.00 | (ref) | 1.00 | (ref) | 1.00 | (ref) |
| 10–17 | 42 | 0.54 | (0.32–0.91) | 0.59 | (0.34–1.01) | 0.63 | (0.37–1.10) | |
| ≥17 | 6 | 0.48 | (0.19–1.22) | 0.49 | (0.19–1.29) | 0.52 | (0.19–1.40) | |
| p-value for trend | 0.025 | 0.050 | 0.088 | |||||
| Other cause(n=24) | <10 | 11 | 1.00 | (ref) | 1.00 | (ref) | 1.00 | (ref) |
| 10–17 | 11 | 0.39 | (0.17–0.92) | 0.45 | (0.19–1.11) | 0.48 | (0.19–1.20) | |
| ≥17 | 2 | 0.44 | (0.10–2.06) | 0.47 | (0.10–2.34) | 0.50 | (0.10–2.57) | |
| p-value for trend | 0.064 | 0.126 | 0.164 | |||||
Model 1: Adjusted for age.
Model 2: Additionally adjusted for education, marital status, alcohol intake, smoking, BMI, energy intake, total cholesterol/HDL ratio.
Model 3: Adjusted for all variables in model 2 and plasma ALT and GGT activities, and CRP and urea concentration.
Values in bold and italics are highlighting stadistical significance of the results.
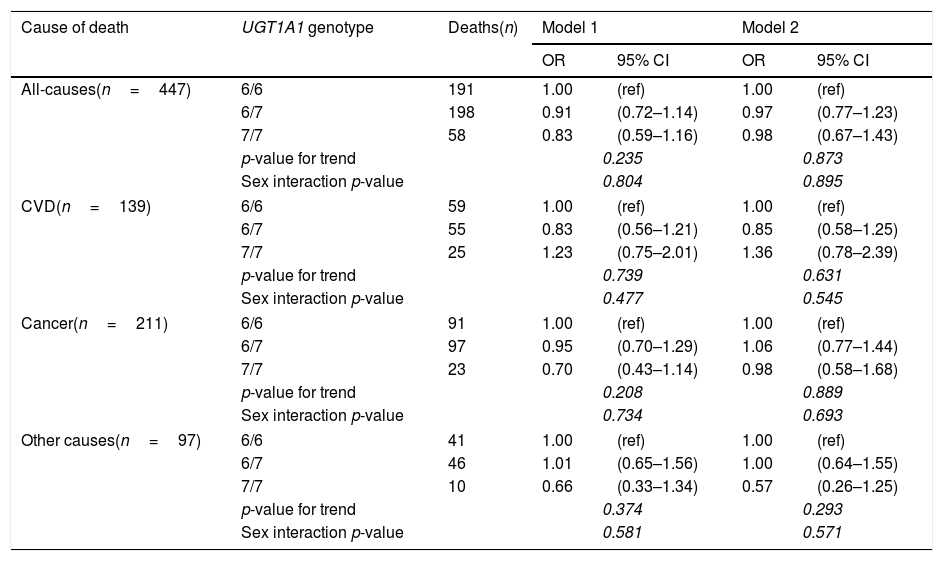
The associations of the UGT1A1*28 allele (a genetic marker of systemic bilirubin concentrations) with mortality risks showed similar patterns as plasma bilirubin concentrations, although the associations did not reach statistical significance (Table 5). Importantly, the adjustment for plasma bilirubin almost attenuated the (non-significant) associations of the polymorphism with all-cause and cancer mortality; indicating that the effect of genotype was, as hypothesised, driven predominantly by plasma bilirubin concentrations.
Relationship between UGT1A1 promoter gene status and mortality with logistic regression models.
| Cause of death | UGT1A1 genotype | Deaths(n) | Model 1 | Model 2 | ||
|---|---|---|---|---|---|---|
| OR | 95% CI | OR | 95% CI | |||
| All-causes(n=447) | 6/6 | 191 | 1.00 | (ref) | 1.00 | (ref) |
| 6/7 | 198 | 0.91 | (0.72–1.14) | 0.97 | (0.77–1.23) | |
| 7/7 | 58 | 0.83 | (0.59–1.16) | 0.98 | (0.67–1.43) | |
| p-value for trend | 0.235 | 0.873 | ||||
| Sex interaction p-value | 0.804 | 0.895 | ||||
| CVD(n=139) | 6/6 | 59 | 1.00 | (ref) | 1.00 | (ref) |
| 6/7 | 55 | 0.83 | (0.56–1.21) | 0.85 | (0.58–1.25) | |
| 7/7 | 25 | 1.23 | (0.75–2.01) | 1.36 | (0.78–2.39) | |
| p-value for trend | 0.739 | 0.631 | ||||
| Sex interaction p-value | 0.477 | 0.545 | ||||
| Cancer(n=211) | 6/6 | 91 | 1.00 | (ref) | 1.00 | (ref) |
| 6/7 | 97 | 0.95 | (0.70–1.29) | 1.06 | (0.77–1.44) | |
| 7/7 | 23 | 0.70 | (0.43–1.14) | 0.98 | (0.58–1.68) | |
| p-value for trend | 0.208 | 0.889 | ||||
| Sex interaction p-value | 0.734 | 0.693 | ||||
| Other causes(n=97) | 6/6 | 41 | 1.00 | (ref) | 1.00 | (ref) |
| 6/7 | 46 | 1.01 | (0.65–1.56) | 1.00 | (0.64–1.55) | |
| 7/7 | 10 | 0.66 | (0.33–1.34) | 0.57 | (0.26–1.25) | |
| p-value for trend | 0.374 | 0.293 | ||||
| Sex interaction p-value | 0.581 | 0.571 | ||||
Model 1: adjusted for age and sex.
Model 2: adjusted for age, sex and bilirubin concentrations.
Values in italics are highlighting stadistical significance of the results.
This case–control study, nested in a population-based cohort in a Krakow urban population sample, found strong negative associations of plasma bilirubin with all-cause mortality driven predominantly by the effect on cancer but not CVD mortality. These observational associations were supported by the Mendelian randomisation analyses; although non-significant, the patterns of associations of mortality with a genetic marker of raised bilirubin were similar to results of analyses using plasma bilirubin. In theory, with data available on bilirubin, genotypes and mortality outcomes in the same dataset, it would be possible to formally conduct a one sample Mendelian randomisation using a two-stage least squares regression analysis. However, a larger sample size and/or higher number of deaths would be necessary to achieve sufficient statistical power.
There is growing evidence from experimental and clinical studies [3,4] that mildly elevated systemic bilirubin concentrations have potent anti-atherogenic [5], anti-proliferative [7,18], and anti-ageing [19] effects. This association, however, seems to be valid only when the elevated bilirubin is not a consequence of an underlying liver disease [6]. Indeed, elevated liver enzyme activities predict cardiovascular events [20,21], thus underlying liver disease clearly eliminates the potential beneficial effects of bilirubin. It is important to note, that the prevalence of elevated liver enzymes in the general population is as high as 10–20% [22], which is exactly what we found in our current study.
The beneficial effects of bilirubin on mortality have been shown in several epidemiological studies. The first study, in 2001, a 10-year follow-up retrospective investigation of more than 11,000 Belgian men and women [23], reported a significant negative association of bilirubin with all-cause and cancer mortality in men but not in women; surprisingly, no association was found with CVD mortality. Another large study by Fulks et al., included almost 2 million insurance applicants, found an negative association between all-cause mortality and bilirubin levels [24]. Serum bilirubin levels had a strong and independent protective impact on the association with all-cause and CVD mortality in a study by Ajja et al. in a male population [25]. In a prospective study by Horsfall et al. [26] in a statin-treated population of approximately 130,000 participants, a negative relationship between bilirubin concentrations and all-cause mortality risk was observed, whereas the relationship between bilirubin and CVD/myocardial infarction events was U-shaped [26]. In a second report, the same group analysed mortality rates in participants diagnosed with Gilbert syndrome; these subjects had half the mortality rate compared to controls [27]. Protective effects of bilirubin on overall mortality were reported also from a prospective study on haemodialysed patients by Chen et al. [28]. Importantly, subjects with Gilbert syndrome genotype (UGT1A1*28 homozygosity) had one fourth the risk for all-cause mortality as compared to the wild-type allele carriers. A significant negative correlation between serum bilirubin and all-cause mortality was observed also in NHANES study on elderly population [29], although no detailed analysis was provided. Consistently, serum bilirubin concentrations below 10.5μmol/L were found to be a risk factor for cardiovascular mortality in a small Serbian older population [30].
On the other hand, no survival advantage of higher serum bilirubin concentrations was observed among older persons by Boland et al. [31] and, higher baseline bilirubin levels predicted slightly increased mortality in the Ludwigshafen Risk and Cardiovascular Health study (although confusingly, a UGT1A1*28 gene variant predicted lower overall mortality [32]. No significant associations between serum bilirubin and either all-cause, CVD or non-CVD mortality were observed in Diabetes Heart Study [33]. Similarly, bilirubin was not associated with cancer mortality in the EPIC-Heidelberg cohort [34]. Overall, although not completely consistent, most available studies suggest a beneficial effect of bilirubin on all-cause mortality, driven predominantly by the effect on cancer, but in some studies also on CVD.
Our results confirm data from previous studies since they are consistent with the majority of published reports. In our study, the association with all-cause mortality was driven mainly by cancer mortality, while that with cardiovascular mortality was not observed. One of the reasons for this observation may lie in the relatively young age of the examined population (61.6±6.5 years), in which cancer was found a leading mortality cause.
The association between UGT1A1 promoter gene variations and mortality rates was not significant (most likely due to low penetrance of UGT1A1*28 mutation [10]) but the direction of the association also suggests protective effects. The observation that the adjustment for bilirubin virtually eliminated the (non-significant) effect of the genotype is important because it confirms that bilirubin is (1) strongly associated with the genotype, and (2) responsible for the protective effect of the UGT1A1*28 gene variation.
Our findings are further supported by clinical studies of cancer morbidity. For example, in a large Chinese study on patients with colorectal cancer, the prevalence of Gilbert syndrome genotype was very low, reaching only 1.4% [35]. Similarly low prevalence of this Gilbert syndrome genotype (4.7%) was found in a study of colon cancer by Liu et al. [36]. Serum bilirubin concentrations were reported to be negatively associated with non-dermatological malignancies, and this effect was the most pronounced for colorectal cancer; subjects with Gilbert syndrome phenotype had 4-times lower risk compared to individuals with normal bilirubin levels [18]. Similarly, in our previous study low serum bilirubin levels were associated with an increased risk of colorectal cancer in both males and females, whereas UGT1A1*28 allele carrier status was proved to be protective against the development of colorectal cancer in males [7].
The main limitation of our study is the relatively small number of events, particularly deaths from specific causes. The average follow-up time of 6.4 years can also be considered short for the development of chronic diseases and may be partly responsible for some of the non-significant findings. Further limitation is the fact that site-specific cancer rates could not be assessed. Giving the large variation within this disease group in terms of risk factor profile, future analyses should explore the link between bilirubin and specific types of cancer. On the other hand, the prospective design minimises the reverse causation bias, and the extensive set of data on participants allows effective control for confounding. In addition, the combination of observational and Mendelian randomisation design, and the consistency of these two sets of findings, supports the validity of our findings.
In conclusion, our study is consistent with earlier reports that plasma bilirubin concentrations is negatively related to total mortality; in our data, this association was mostly driven by the effect on a cancer, rather than CVD. These findings were further supported by the (non-significant) pattern of associations between mortality and the UGT1A1 promoter gene polymorphism which was largely explained by plasma bilirubin. Larger epidemiological studies, presumably on older populations, are needed to confirm our as well as previously published data on lacking relationship between bilirubin and CVD mortality, and to reveal the reasons for this phenomenon.AbbreviationsCVD cardiovascular diseases bilirubin UDP-glucuronosyl transferase Health, Alcohol, and Psychosocial factors in Eastern Europe International Classification of Diseases
The authors have no conflicts of interest to declare.
The study was supported by Ministry of Health of the Czech Republic, grant no. 15-28895A. All rights reserved.


