


The prevalence of food allergy is on the rise on a global scale.
ObjectiveTo determine the prevalence of food hypersensitivity (FHS) and probable food allergy (PFA), as well as the foods and factors associated with these occurrences.
MethodsA cross-sectional study was carried out among 1992 adolescents (aged 15–18 years). Each adolescent answered a structured questionnaire. A multivariate analysis was used to identify the association between the variables.
ResultsThe prevalence of FHS was 10.6% (the most commonly associated foods were shrimp, cow's milk and avocado) and the PFA was 7.8% (shrimp, cow's milk and pecan). The prevalences of oral allergy syndrome, food-associated urticaria and systemic reaction were 4.9%, 3.6% and 1.5%, respectively. The following factors were associated with FHS: personal history of asthma (OR 1.63; 95% CI: 1.11–2.41), allergic rhinitis (OR 2.60; 95% CI: 1.75–3.87), atopic dermatitis (OR 2.07; 95% CI: 1.25–3.43), maternal history of asthma (OR 1.80; 95% CI: 1.02–3.16), atopic dermatitis (OR 6.11; 95% CI: 2.45–15.29), and female sex (OR 1.89; 95% CI: 1.38–2.59). PFA was associated with a personal history of asthma (OR 1.65; 95% CI: 1.06–2.56), allergic rhinitis (OR 2.46; 95% CI: 1.56–3.88), atopic dermatitis (OR 2.02; 95% CI: 1.15–3.54), paternal allergic rhinitis (OR 2.52; 95% CI: 1.15–5.51), maternal atopic dermatitis (OR 7.46; 95% CI: 2.93–19.00), and female sex (OR 1.89; 95% CI: 1.31–2.72).
ConclusionThe adverse reactions associated with foods among late adolescents are a frequent occurrence, and the most commonly associated factor is atopy.
The prevalence of food allergy is increasing worldwide,1 and can have an important effect on the quality of life, as food allergy is likely to provoke systemic reactions.2
Globally, the prevalence of self-reported hypersensitivity to food in children and adults has been estimated at 3–35%.3 In Latin America, there is a lack of population-based studies dedicated to establishing the prevalence of adverse food reactions. Nevertheless, one of the first of such studies occurred in Colombia, where the prevalence of food allergies in children aged 9–16 was 12.6%.4 Additional studies showed that preschool-aged Brazilian children had a prevalence of 23.5%,5 Chile reported a prevalence of 5.5% for school-aged children,6 and the prevalence in Mexico was 10%.7 Among early teens in Australia, the prevalence was 5.5%.8
Some of the foods that were most commonly associated with food hypersensitivity (FHS) and probable food allergy (PFA) were peanut, tree nuts, cow's milk and shellfish, among others.4–10 However, these can vary based on the geographic region, food availability, eating habits, and cultural customs.
While the factors associated with food allergy may vary, the most consistent factor is genetics.4,9,10 Furthermore, women exhibit these symptoms more frequently than men do.11–13
To our knowledge, FHS and PFA in late adolescence (the final stage of childhood) have not been previously studied. Our objectives consisted of determining the prevalence of FHS and PFA, as well as their clinical characteristics, the foods that are involved, and the factors associated with them.
MethodsDesignIn our cross-sectional study, we analyzed data that correspond to 1992 adolescents, aged 15–18 years. These students were enrolled in high schools within Guadalajara, Mexico, one of the nine cities that constitute the metropolitan area of the same name. The city of Guadalajara includes 1.5 million out of the approximate five million inhabitants throughout the entire metropolitan area; its large population is representative of the diverse socioeconomic strata in the region.
SampleThe samples were collected from April to June of 2016 through probabilistic sampling that was stratified and then clustered. To do so, we divided the city of Guadalajara into seven strata, and from each of these, we randomly selected at least one school (cluster); each stratum contributed a sub-sample of students through the proportional selection technique, by multiplying the complete sample size by the proportion of students that were enrolled in each stratum. To obtain a representative sample for each selected school, each school grade was considered a new stratum, and from each of these, we randomly selected a group. Lastly, we randomly selected students to participate in the study.
QuestionnaireThe data were obtained through a structured questionnaire that was previously used and validated within the Mexican population.10 Said questionnaire includes questions regarding age, sex, personal history of atopic and non-atopic diseases of each participant, and the family history of allergic diseases of each participant's parents.
DefinitionsWe utilized the following question to identify self-reported FHS: Did you experience an allergic reaction after eating foods or drinking something?10 This study included all cases in which the student responded affirmatively, regardless of a prior history of allergy testing.14 To define PFA, we adopted the definition proposed by Sicherer et al.; a probable allergic reaction was considered positive if the organs and the manifested symptoms were typical allergic reactions (urticaria and angioedema, difficulty breathing, wheezing, swelling of the throat, vomiting and diarrhea) and if these occurred within two hours of having ingested the allergy-causing food.15 This definition allows us to detect up to 93% of the subjects that have specific IgE antibodies that react to the implied foods.16 If a participant had two or more organs that were affected, we considered this to be a systemic reaction.
Statistical analysesTo estimate the prevalence of FHS, we divided the frequency of affirmative answers to the question, Do you suffer from allergic reactions after ingesting food or drinking something?, by the total number of people who completed the questionnaire. The same procedure was utilized to estimate the prevalence of PFA, except in this case, we utilized the previously mentioned definition. We employed the chi-square test or Fisher's exact test, as deemed necessary, in order to compare the categorical variables. We estimated the confidence intervals at 95% (95% CI) for the proportions. The data were analyzed by using the IBM SPSS Statistics version 20.0 (IBM Co., Armonk, NY, USA) program for Windows.
To identify the association between variables, we utilized two multivariate model groups in which the dependent variables were FHS and PFA, respectively. In both groups, the independent covariates were personal, paternal or maternal history of asthma, allergic rhinitis, atopic dermatitis, and the female sex. The strength of the association between variables was evaluated by estimating the odds ratio (OR) and the 95% CI through adjusted binary logistic regression with the use of the forward conditional method. The value of p<0.05 was considered to be statistically significant.
EthicsThe authors certify that this research was done under full compliance with all government policies and the Helsinki Declaration (2013). The Committee of Research Ethics at the Hospital Civil de Guadalajara approved this study. Prior to distributing our questionnaire, we explained our objective to each school district and their teachers and obtained their consent in order to be able to survey their students. If they accepted, we sought the same permission from the students, and when students agreed to participate, they were given detailed information about our study and were asked to give their verbal consent to participate.
ResultsOverall, we analyzed data that corresponded to 963 men (47.0%) and 1056 women (53.0%). With regards to the personal history of allergic diseases among adolescents, we registered asthma at 12.7%, allergic rhinitis at 9.0% and atopic dermatitis at 5.2%. Where their family history was concerned, we found that the paternal history was as follows: asthma 2.6%, allergic rhinitis 2.1% and atopic dermatitis 0.7%. Maternal history corresponded to 4.5%, 3.4% and 1.1%, respectively.
The self-reported prevalence of FHS was 10.6% (95% CI: 9.4–12.1%), whereas the prevalence of PFA was 7.8% (95% CI: 6.7–9.0%). Once again, these types of reactions were predominant among women (10.1% of females vs. 5.1% of males, p<0.001).
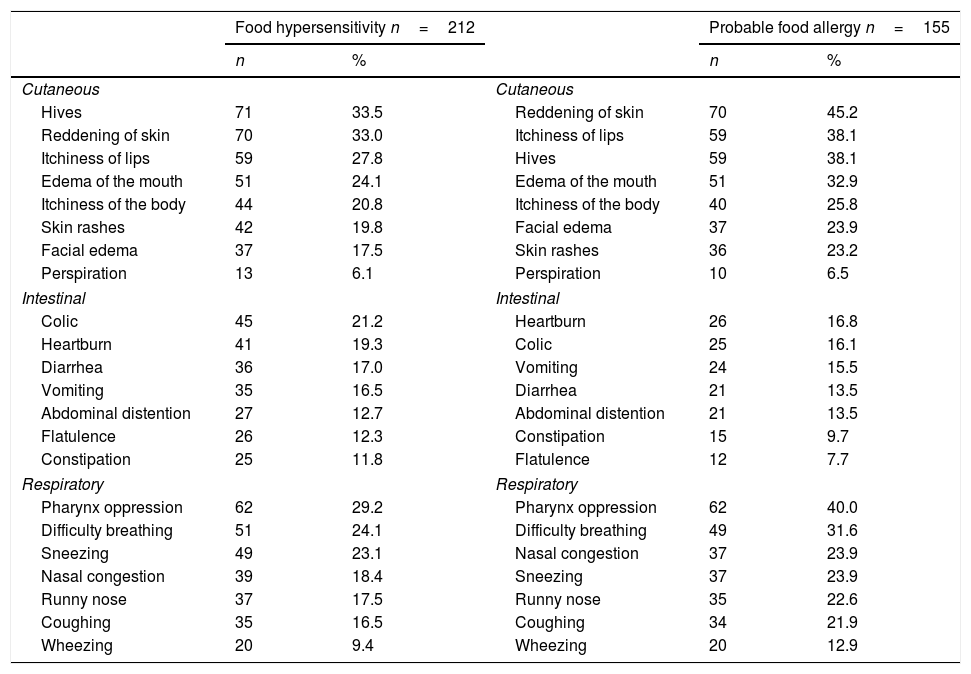
The most common self-reported symptoms for FHS were cutaneous (hives and reddening of the skin), followed by respiratory ailments (oppression of the pharynx and difficulty breathing) and lastly intestinal discomfort (abdominal pain and heartburn) (Table 1). In PFA, cutaneous symptoms were predominant (hives and reddening of the skin), followed by respiratory ailments (oppression of the pharynx and difficulty breathing) and intestinal discomfort (abdominal pain and heartburn).
Frequency of self-reported clinical manifestations associated to the ingestion of foods amongst 1992 late adolescents.
| Food hypersensitivity n=212 | Probable food allergy n=155 | ||||
|---|---|---|---|---|---|
| n | % | n | % | ||
| Cutaneous | Cutaneous | ||||
| Hives | 71 | 33.5 | Reddening of skin | 70 | 45.2 |
| Reddening of skin | 70 | 33.0 | Itchiness of lips | 59 | 38.1 |
| Itchiness of lips | 59 | 27.8 | Hives | 59 | 38.1 |
| Edema of the mouth | 51 | 24.1 | Edema of the mouth | 51 | 32.9 |
| Itchiness of the body | 44 | 20.8 | Itchiness of the body | 40 | 25.8 |
| Skin rashes | 42 | 19.8 | Facial edema | 37 | 23.9 |
| Facial edema | 37 | 17.5 | Skin rashes | 36 | 23.2 |
| Perspiration | 13 | 6.1 | Perspiration | 10 | 6.5 |
| Intestinal | Intestinal | ||||
| Colic | 45 | 21.2 | Heartburn | 26 | 16.8 |
| Heartburn | 41 | 19.3 | Colic | 25 | 16.1 |
| Diarrhea | 36 | 17.0 | Vomiting | 24 | 15.5 |
| Vomiting | 35 | 16.5 | Diarrhea | 21 | 13.5 |
| Abdominal distention | 27 | 12.7 | Abdominal distention | 21 | 13.5 |
| Flatulence | 26 | 12.3 | Constipation | 15 | 9.7 |
| Constipation | 25 | 11.8 | Flatulence | 12 | 7.7 |
| Respiratory | Respiratory | ||||
| Pharynx oppression | 62 | 29.2 | Pharynx oppression | 62 | 40.0 |
| Difficulty breathing | 51 | 24.1 | Difficulty breathing | 49 | 31.6 |
| Sneezing | 49 | 23.1 | Nasal congestion | 37 | 23.9 |
| Nasal congestion | 39 | 18.4 | Sneezing | 37 | 23.9 |
| Runny nose | 37 | 17.5 | Runny nose | 35 | 22.6 |
| Coughing | 35 | 16.5 | Coughing | 34 | 21.9 |
| Wheezing | 20 | 9.4 | Wheezing | 20 | 12.9 |
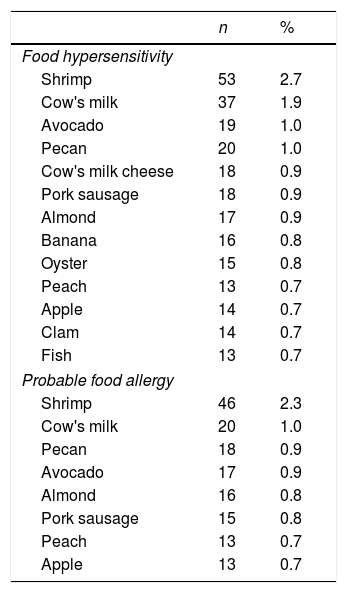
The foods that were most commonly associated with self-reported FHS were shrimp, cow's milk, avocado, pecan, and cow's milk cheese; for PHF, they were shrimp, cow's milk, pecan, avocado and almond (Table 2).
Foods most frequently associated with food hypersensitivity and probable food allergy amongst 1992 late adolescents.
| n | % | |
|---|---|---|
| Food hypersensitivity | ||
| Shrimp | 53 | 2.7 |
| Cow's milk | 37 | 1.9 |
| Avocado | 19 | 1.0 |
| Pecan | 20 | 1.0 |
| Cow's milk cheese | 18 | 0.9 |
| Pork sausage | 18 | 0.9 |
| Almond | 17 | 0.9 |
| Banana | 16 | 0.8 |
| Oyster | 15 | 0.8 |
| Peach | 13 | 0.7 |
| Apple | 14 | 0.7 |
| Clam | 14 | 0.7 |
| Fish | 13 | 0.7 |
| Probable food allergy | ||
| Shrimp | 46 | 2.3 |
| Cow's milk | 20 | 1.0 |
| Pecan | 18 | 0.9 |
| Avocado | 17 | 0.9 |
| Almond | 16 | 0.8 |
| Pork sausage | 15 | 0.8 |
| Peach | 13 | 0.7 |
| Apple | 13 | 0.7 |
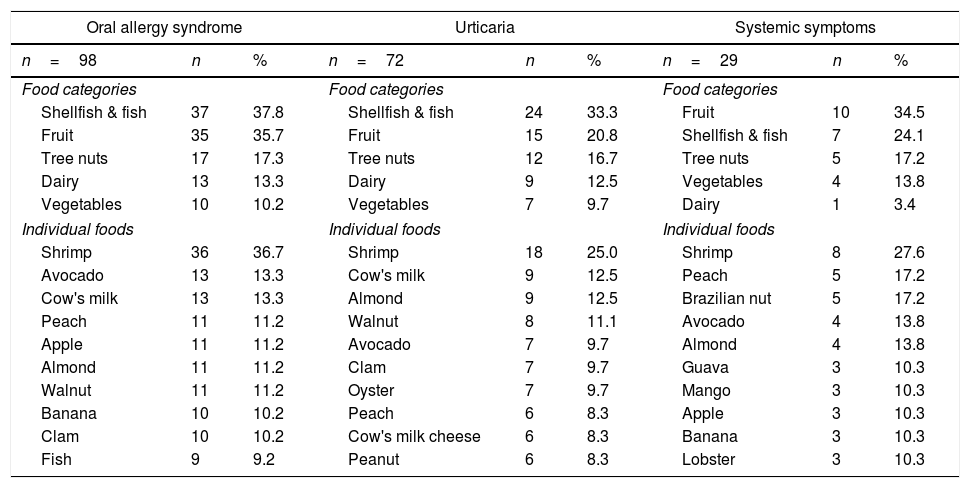
The prevalence of diseases that are likely regulated by IgE and the main ailments that were associated with them were oral allergy syndrome 4.9% (95% CI: 4.1–6.0%), where shellfish and fish (primarily shrimp) were the most frequent triggering agents (Table 3). The prevalence of urticaria was 3.6% (95% CI: 2.9–4.5%), and once again, shrimp was the main culprit. The frequency of systemic symptoms was 1.5% (95% CI: 1.0–2.1%), and in this case, both shrimp and peach were the primary factors.
Primary foods associated with probable allergy symptoms that are regulated by IgE.
| Oral allergy syndrome | Urticaria | Systemic symptoms | ||||||
|---|---|---|---|---|---|---|---|---|
| n=98 | n | % | n=72 | n | % | n=29 | n | % |
| Food categories | Food categories | Food categories | ||||||
| Shellfish & fish | 37 | 37.8 | Shellfish & fish | 24 | 33.3 | Fruit | 10 | 34.5 |
| Fruit | 35 | 35.7 | Fruit | 15 | 20.8 | Shellfish & fish | 7 | 24.1 |
| Tree nuts | 17 | 17.3 | Tree nuts | 12 | 16.7 | Tree nuts | 5 | 17.2 |
| Dairy | 13 | 13.3 | Dairy | 9 | 12.5 | Vegetables | 4 | 13.8 |
| Vegetables | 10 | 10.2 | Vegetables | 7 | 9.7 | Dairy | 1 | 3.4 |
| Individual foods | Individual foods | Individual foods | ||||||
| Shrimp | 36 | 36.7 | Shrimp | 18 | 25.0 | Shrimp | 8 | 27.6 |
| Avocado | 13 | 13.3 | Cow's milk | 9 | 12.5 | Peach | 5 | 17.2 |
| Cow's milk | 13 | 13.3 | Almond | 9 | 12.5 | Brazilian nut | 5 | 17.2 |
| Peach | 11 | 11.2 | Walnut | 8 | 11.1 | Avocado | 4 | 13.8 |
| Apple | 11 | 11.2 | Avocado | 7 | 9.7 | Almond | 4 | 13.8 |
| Almond | 11 | 11.2 | Clam | 7 | 9.7 | Guava | 3 | 10.3 |
| Walnut | 11 | 11.2 | Oyster | 7 | 9.7 | Mango | 3 | 10.3 |
| Banana | 10 | 10.2 | Peach | 6 | 8.3 | Apple | 3 | 10.3 |
| Clam | 10 | 10.2 | Cow's milk cheese | 6 | 8.3 | Banana | 3 | 10.3 |
| Fish | 9 | 9.2 | Peanut | 6 | 8.3 | Lobster | 3 | 10.3 |
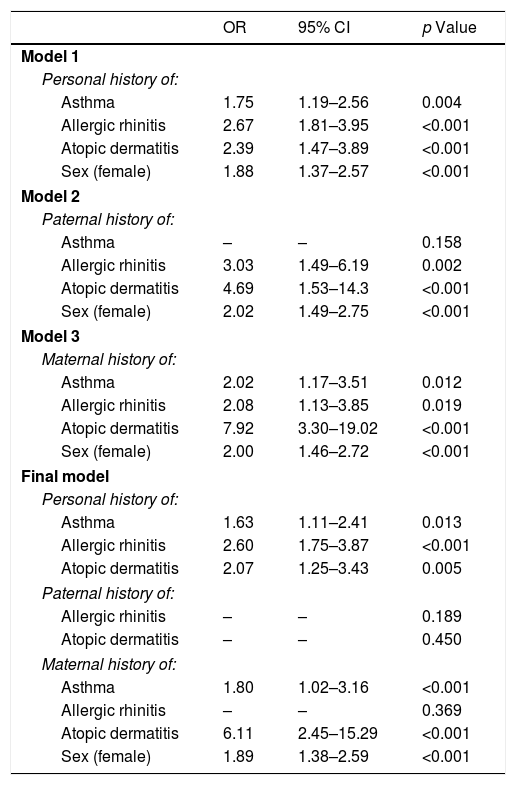
The factors that were associated with FHS are shown in Table 4. We adjusted Model 1 to the personal history of allergic disease and sex; as a result, asthma (OR 1.75, p=0.004), allergic rhinitis (OR 2.67, p<0.001), atopic dermatitis (OR 2.39, p<0.001) and female sex (OR 1.88, p<0.001) were associated with FHS. Models 2 and 3 show that a paternal history of allergic rhinitis (OR 3.03, p=0.002) and atopic dermatitis (OR 4.69, p<0.001) was associated with FHS, as was a maternal history of asthma (OR 2.02, p=0.012), allergic rhinitis (OR 2.08, p=0.019) and atopic dermatitis (OR 7.92, p<0.001). The final model, which was based on the previously identified covariates, shows that a personal history of asthma, allergic rhinitis and atopic dermatitis, along with a maternal history of asthma or atopic dermatitis and female sex, remained associated with FHS.
Multivariate model of factors associated with food hypersensitivity.
| OR | 95% CI | p Value | |
|---|---|---|---|
| Model 1 | |||
| Personal history of: | |||
| Asthma | 1.75 | 1.19–2.56 | 0.004 |
| Allergic rhinitis | 2.67 | 1.81–3.95 | <0.001 |
| Atopic dermatitis | 2.39 | 1.47–3.89 | <0.001 |
| Sex (female) | 1.88 | 1.37–2.57 | <0.001 |
| Model 2 | |||
| Paternal history of: | |||
| Asthma | – | – | 0.158 |
| Allergic rhinitis | 3.03 | 1.49–6.19 | 0.002 |
| Atopic dermatitis | 4.69 | 1.53–14.3 | <0.001 |
| Sex (female) | 2.02 | 1.49–2.75 | <0.001 |
| Model 3 | |||
| Maternal history of: | |||
| Asthma | 2.02 | 1.17–3.51 | 0.012 |
| Allergic rhinitis | 2.08 | 1.13–3.85 | 0.019 |
| Atopic dermatitis | 7.92 | 3.30–19.02 | <0.001 |
| Sex (female) | 2.00 | 1.46–2.72 | <0.001 |
| Final model | |||
| Personal history of: | |||
| Asthma | 1.63 | 1.11–2.41 | 0.013 |
| Allergic rhinitis | 2.60 | 1.75–3.87 | <0.001 |
| Atopic dermatitis | 2.07 | 1.25–3.43 | 0.005 |
| Paternal history of: | |||
| Allergic rhinitis | – | – | 0.189 |
| Atopic dermatitis | – | – | 0.450 |
| Maternal history of: | |||
| Asthma | 1.80 | 1.02–3.16 | <0.001 |
| Allergic rhinitis | – | – | 0.369 |
| Atopic dermatitis | 6.11 | 2.45–15.29 | <0.001 |
| Sex (female) | 1.89 | 1.38–2.59 | <0.001 |
OR: Odds ratios obtained through logistical regression using forward conditional method.
ORs were not calculated for variables excluded from the model.
All covariates were introduced as categorical variables (with and without the characteristic of interest).
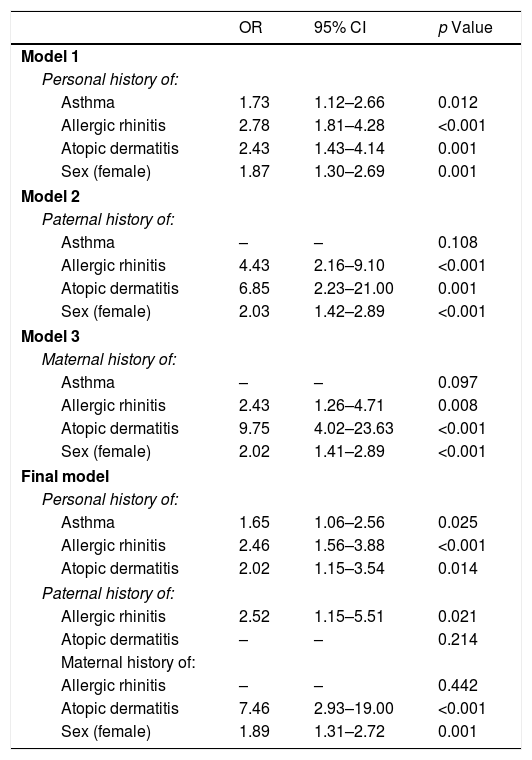
Table 5 displays the various models that were designed to identify the associated factors in the PFAs. Model 1 once again shows that the personal history of asthma, allergic rhinitis, atopic dermatitis and female sex were associated with PFA.
Multivariate model of factors associated with probable food allergy.
| OR | 95% CI | p Value | |
|---|---|---|---|
| Model 1 | |||
| Personal history of: | |||
| Asthma | 1.73 | 1.12–2.66 | 0.012 |
| Allergic rhinitis | 2.78 | 1.81–4.28 | <0.001 |
| Atopic dermatitis | 2.43 | 1.43–4.14 | 0.001 |
| Sex (female) | 1.87 | 1.30–2.69 | 0.001 |
| Model 2 | |||
| Paternal history of: | |||
| Asthma | – | – | 0.108 |
| Allergic rhinitis | 4.43 | 2.16–9.10 | <0.001 |
| Atopic dermatitis | 6.85 | 2.23–21.00 | 0.001 |
| Sex (female) | 2.03 | 1.42–2.89 | <0.001 |
| Model 3 | |||
| Maternal history of: | |||
| Asthma | – | – | 0.097 |
| Allergic rhinitis | 2.43 | 1.26–4.71 | 0.008 |
| Atopic dermatitis | 9.75 | 4.02–23.63 | <0.001 |
| Sex (female) | 2.02 | 1.41–2.89 | <0.001 |
| Final model | |||
| Personal history of: | |||
| Asthma | 1.65 | 1.06–2.56 | 0.025 |
| Allergic rhinitis | 2.46 | 1.56–3.88 | <0.001 |
| Atopic dermatitis | 2.02 | 1.15–3.54 | 0.014 |
| Paternal history of: | |||
| Allergic rhinitis | 2.52 | 1.15–5.51 | 0.021 |
| Atopic dermatitis | – | – | 0.214 |
| Maternal history of: | |||
| Allergic rhinitis | – | – | 0.442 |
| Atopic dermatitis | 7.46 | 2.93–19.00 | <0.001 |
| Sex (female) | 1.89 | 1.31–2.72 | 0.001 |
OR: Odds ratios obtained through logistical regression using forward conditional method.
ORs were not calculated for variables excluded from the model.
All covariates were introduced as categorical variables (with and without the characteristic of interest).
In Models 2 and 3, the paternal and maternal history of allergic rhinitis and atopic dermatitis, along with the female sex, were associated with PFA in the surveyed individuals. In the final model, a history of asthma, allergic rhinitis, and atopic dermatitis among adolescents, as well as paternal allergic rhinitis, maternal atopic dermatitis, and the female sex, remained as significant, independently associated factors with PFA.
DiscussionStudies aimed at estimating the prevalence of FHS and PFA in Latin America, primarily among adolescents, are scarce. This is one of the first studies to analyze this matter in our region. We observed that the prevalence of FHS was slightly over 10% and that PFA was at 8%, and in both cases, shrimp and cow's milk were the most common triggering agents. Interestingly, in addition to shrimp, peaches were associated with systemic reactions. Moreover, we were able to identify that a personal and a family history of allergic disease, especially on the mother's side, as well as female sex, were the main factors associated with both FHS and PFA.
In Melbourne, Australia, a recent cross-sectional study that included adolescents aged 10–14 showed that the prevalence of food allergy was 5.5% (determined with the use of a questionnaire), However, when skin-prick tests or oral challenge test were applied, there was a slight decrease to 4.5%.8 An additional study in Japan analyzed the prevalence of food allergies among female adolescents with the use of a questionnaire and reported a frequency of 8.2%.17 In Latin America, a cross-sectional questionnaire-based study proved that the prevalence of FHS among individuals aged 9–16 was 12.6%.4 In our country, there are limited efforts focused on researching the adverse reactions of food ingestion, and there are none that focus on adolescents. However, there was a study of young university students that identified adverse reactions to foods by utilizing the questionnaire that we have employed for this study. The university-based study recorded the prevalence of FHS at 30.1%. Interestingly, the frequency of PFA was quite different, at only 6%. An additional study analyzed the prevalence of FHS in young adults with the use of a questionnaire; their reported prevalence was 17%.9 Notably, this makes our study the first to report the prevalence of food allergies among late adolescents in Mexico.
For both FHS and PFA, the most commonly associated adverse foods were shrimp and cow's milk. It seems that this could be a constant among the general population of our country, as there have been two prior studies in two different geographic regions, in which these foods were the most frequently reported triggering agents.9,10 In a study carried out among early adolescents, the most commonly associated foods were peanuts and tree nuts.8 In a study that included children, adolescents and adults from various European countries, hazelnuts and apples were the foods that caused the most hypersensitivity; interestingly, neither shrimp nor cow's milk were significant factors.18
Something similar was observed in Canada, where the most commonly associated foods among children and adults were peanuts and tree nuts.19 A Mexican diet, which is primarily based on corn tortillas, beans and the low consumption of refined grains, usually does not include the regular consumption of shrimp and cow's milk. Consequently, we suggest that this diet is a risk factor and increases the probability of developing an allergy to these foods within our population, since in comparison to other populations, our time of exposure to such foods is considerably shorter.20 Foods such as peanuts, which in other parts of the world are a major agent of allergic reaction,2,8,9,21 are not a major culprit in our population, although the pecan is.
Although there were differences in age groups, the prevalence of OAS, urticaria and systemic reactions associated with foods, these were similar to the findings among adults in our city.9 In a population of late adolescents, OAS was the most common clinical entity, and notably, it was linked to the ingestion of shellfish (mainly shrimp). However, it is likely that we are only observing the natural history of the disease among these patients, in which the persistence of a stimulated allergen begins with oral symptoms, followed by urticaria and the triggering of anaphylaxis. Up to 1.5% of late adolescent symptoms were compatible with anaphylaxis after ingesting foods, and shrimp and peaches were among the foods most related to this event. Previous epidemiological studies have shown similar findings.4,18,22–24 Notably, none of these late adolescents had been informed by a physician that these symptoms were characteristics of an anaphylactic reaction.
In our study, various factors were significantly associated with FHS and FPA. One such factor was a personal history of an allergic disease. Notably, previous studies have had similar results to our own.4,9,10 Moreover, a maternal history of atopic dermatitis acts as a conducive agent, which we had previously observed among university students in our country,10 although we have yet to find an explanation for this occurrence.
Lastly, the predominance of FHS and FPA among women, which is reported in our study, is similar to that observed for asthma, allergic rhinitis, or atopic dermatitis, among others.11–13 It seems that within our adolescent population, these reactions are triggered during the final stage of adolescence and not during adulthood. Some of the factors that might help explain the prevalence of adverse reactions to foods among women are: hormonal (primarily estrogens), psychological sensitivity, the use of medications (such as antacids), food preferences, and the processing of information, among others.25,26 While various hypotheses have emerged to explain the causes of food allergies, some of the most reoccurring are the hypothesis of fatty diets and allergies, the antioxidant hypothesis, the vitamin D hypothesis, the hygiene hypothesis, the exposure to food allergens, and recently the dual exposure to allergen hypothesis.27,28
An important limitation of studies based on self-reported symptoms that are compatible with adverse reactions and are associated with food ingestion is that they tend to overestimate or underestimate the prevalence, because most of these occurrences lack objective tests (clinical history, specific identification of IgE, or oral challenge tests). In this study, as we only included adolescents that were from an industrialized city, the generalization of our results is limited when considering rural regions, or places that do not have access to the same types of foods. Two additional limitations of our study involve the lack of data related to the triggers of allergic rhinitis symptoms in students and the inability of the questionnaire to identify a student with symptoms related to the consumption of foods containing baked or cooked milk. On the other hand, given that this is the first epidemiological study of its kind based on probabilistic sampling, our results can be extrapolated among the population of late adolescents in our city.
In conclusion, the adverse reactions associated with foods among late adolescents in Guadalajara, Mexico are a common occurrence. The prevalence of FHS was calculated at 10.6%, while FPA was estimated at 7.8%. Shrimp and cow's milk were the primary allergens in this age group. Notably, the prevalence of compatible symptoms with a systemic reaction linked to a single food was calculated at 1.5%. The most important risk factors associated with FHS and FPA were a prior personal history, a relative with an allergic disease, and the female sex.
Funding sourceNone declared.
Conflict of interestThe authors have no conflict of interest to declare.
