


Edited by: Abbas Mardari
More infoThe low-carbon city pilot (LCCP) policy is an essential strategy for China to combat climate change, attain the carbon neutrality target, and achieve comprehensive green transformation, which will inevitably have an impact on many areas of the economic system. The digital economy has given a new impetus to green development and sustainable growth in China, becoming an essential indicator of green transformation. Promoting the digital economy's growth is essential to successful green development. Does China's LCCP policy support digital economy growth while reducing energy use and emissions? This study evaluates digital economy growth in China's 277 cities from 2002 to 2019 using the principal component analysis method and employing the difference-in-differences method to assess how the LCCP policy affects digital economy growth. The empirical results demonstrate that the LCCP policy encourages digital economy growth, which then promotes green development. The conclusion remains tenable following several robustness tests, including parallel trend, placebo, and endogeneity tests. A heterogeneity analysis demonstrates that the LCCP policy has a more profound influence on digital economy growth in coastal, non-resource-based, and large-scale cities. A mechanism test indicates that the LCCP policy positively encourages digital economy growth by promoting technological innovation and changing the industrial structure. This study offers new empirical evidence that LCCP policy can advance the achievement of green development.
Given the recent and extensive contemporary application of digital technology in various fields, the digital economy has become a vital entry point for realizing green development and sustainable growth (Dabbous & Tarhini, 2021; Martínez et al., 2022). The digital economy has unique green attributes, such as low marginal cost (Skare & Soriano, 2021), green sharing, openness (Adamides & Karacapilidis, 2020), and high permeability. It guides green technology innovation and product development, effectively improves resource utilization, and reduces resource consumption as a powerful driving force in green government affairs, green consumption, and green production, producing innovative approaches and feasible paths for advancing green development (Feng & Liao, 2020; Huong et al., 2022). The Chinese government seeks to establish a new green, low-carbon, and sustainable development model, and the pursuit of green development has been prioritized as a significant objective in current economic development planning. The digital economy, which is one of China's most dynamic areas, is a crucial engine for achieving the transformation of the old and new dynamics and green economic development is significantly influenced by the digital economy. Therefore, the digital economy is considered to be an essential indicator for achieving green development (Luo et al., 2022).
The Chinese economy is at a critical stage in moving toward green development, which has led to a greater emphasis on the role of low-carbon development as a driver of green development. As the highest carbon-emitting country in the world, the Chinese government has integrated low-carbon development into its national medium and long-term development plan (Song et al., 2020). For example, the National Development and Reform Commission (NDRC) issued three lists of pilot provinces and cities for low-carbon development in 2010, 2012, and 2017. By exploring policies and routes to realize low-carbon development in various areas, the low-carbon city pilot (LCCP) policy is crucial for fostering the growth of a sustainable urban ecological civilization (Song et al., 2020). It is an essential approach for addressing climate change and transitioning to a greener economic growth model while achieving economic growth (Zhang et al., 2022). The contribution of the LCCP policy to critical economic variables, such as environmental pollution control, industrial structure upgrading, and achieving green development is unquestionable; however, limited research has examined the connection between LCCP policy and green development from a digital industry perspective.
Green development is a relatively comprehensive concept that considers economic, ecological, and social concerns, and no unified definition of how to assess the growth level of green development has emerged. However, most existing empirical studies on green development have revolved around green total factor productivity (GTFP), such as Cheng et al. (2019), Qiu et al. (2021), and Chen and Wang (2022). GTFP balances economic efficiency with ecological constraints, and its improvement is crucial to achieving green development (Xu & Deng, 2022). GTFP produces a holistic overview of production, living, and ecological levels and different methods have been used to measure it, including data envelopment analysis, principal component analysis, and the Delphi method (Wang et al., 2022). Some scholars have analyzed other influencing factors of green development, such as technological progress, environmental regulation, and industrial structure change (Wang et al., 2022). However, studies that investigate the impact of national policy implementation on green development based on the digital industry level are relatively rare. Does the LCCP policy promote digital economy growth and contribute to green development? If so, how does this impact carry through? Is there heterogeneity in effect across regions? Previous research does not provide clear answers to these questions.
To analyze the impact of the LCCP policy on digital economy growth, this study uses empirical methodologies and a panel data sample of 277 Chinese cities covering the years 2002–2019. The primary conclusions are as follows. First, the time-varying difference-in-differences (DID) model reveals that the LCCP policy has greatly encouraged digital economy growth and advanced green development, encouraging 22.87% digital economic growth in pilot cities in comparison to non-pilot cities. This conclusion remains tenable following several robustness tests, such as propensity score matching (PSM)-DID, parallel trend, and placebo tests. Second, the LCCP policy has different impacts on different cities. For coastal areas, non-resource-based cities, and large cities, the policy effect of LCCP policy on the digital economy is more obvious. Third, mechanism analysis reveals that the LCCP policy can contribute to digital economy growth and advance green development by increasing research and development (R&D) capital investment, enhancing technological innovation capabilities, and adjusting the industrial structure.
In contrast to earlier studies, the primary contributions of this research are twofold. First, this study demonstrates that the LCCP policy encourages digital economy growth and advances green development through empirical analysis, adding to the research regarding the effects of LCCP policy. Previous literature related to the LCCP policy can be divided into three categories, first; some scholars estimate the LCCP policy effect from the perspective of carbon emissions. Wen et al. (2022) integrated complete statistical data, including information on urban industry, carbon emissions, and climate index to comprehensively investigate how the LCCP policy affected emissions reduction. The results showed that the LCCP policy could contribute to promoting carbon emissions efficiency, and the impact is significantly diverse from region to region. Fu et al. (2021) confirmed that the LCCP policy could substantially reduce carbon emissions using the PSM-DID model; however, the carbon emissions efficiency does not improve quickly and the policy may exacerbate disparities between cities. Second, other scholars employed the DID model to estimate the policy impact from the perspectives of economic development, enterprises’ energy-saving behavior, total factor productivity, and economic growth (Chen & Wang, 2022). The LCCP policy is affirmed to generate economic effects. In addition, other scholars evaluated implementation performance by constructing an index system. Based on survey data of low-carbon pilot cities, Shen et al. (2021) assessed the effectiveness of pilot cities using the Capability Maturity Model. To explore the policy impact of the LCCP policy, Du et al. (2022) constructed evaluation indicators of the LCCP policy in five dimensions, including optimizing industrial structure, increasing carbon sink level, adjusting energy structure, enhancing energy efficiency, and promoting low-carbon management mechanisms. To summarize, a minimal research has investigated how the LCCP policy has affected digital economy growth. This study bridges a gap in the current literature by offering fresh perspectives and approaches for investigating the effect of LCCP policy.
Second, this study expands the pertinent literature associated with the driving forces of the digital economy from the low-carbon policy perspective. Two main types of research have been conducted regarding the digital economy. The first is related to digital economy measurement. For example, Li and Liu (2021) constructed indicators in three dimensions of building digital infrastructure, cultivating digital talent, and developing digital industry, using the entropy method to calculate digital economy growth in China from 2003 to 2018. Li et al. (2022) constructed indicators for the growth of digital finance and internet penetration and the digital economy's growth level in China's 277 prefecture cities using principal component analysis. Wu et al. (2021) only used the degree of internet development to represent the digital economy, which is a comparatively simpler method. The other research has emphasized the various factors that influence digital economy growth. For example, based on enterprise-level data, Lyu et al. (2022) argued that social capital facilitates access to external resources and stimulates innovation, which has a significant impact on enterprises’ digital transformation process. Artificial intelligence, cloud computing, big data, blockchain, and other technical factors can affect digital economy growth (Ma et al., 2019). Generally speaking, with China's proposed carbon neutrality goal, and the trend of combining the digital economy and traditional manufacturing industry, the digital economy is expected to become a new engine for China's future economic development. Formulating environmental policies that are compatible with advancing the digital economy is essential to foster future digital economy growth in China. Therefore, investigating how environmental policies can promote digital economy growth is of practical importance. This study investigates the influence of the LCCP policy on digital economy growth, as well as how the digital industry is evolving toward carbon neutrality.
The structure of this paper is as follows: Section 2 presents a description of the theoretical analysis and research hypothesis. The methodology and data are presented in Section 3, and the empirical, and robustness test results are provided in Section 4. In Section 5, the heterogeneity analysis is detailed. Section 6 shows how the LCCP policy affects digital economy growth. Section 7 presents the conclusion and policy implications.
Theoretical analysis and research hypothesesThe core connotation of green development is innovation, coordination, openness, and sharing, which involves all fields in the social economy. The digital economy's inherent benefits and fundamental elements, such as high creativity, high permeability, comprehensive coverage, and low marginal cost, have promoted regional economic growth and green development. However, according to the 14th Five-Year Plan for Digital Economy Development released by China in December 2021, digital economy growth must promote intelligent infrastructure upgrades. In addition, some scholars have asserted that input factors, technological progress, industrial structure, human capital, and institutional changes will influence the digital economy's development (Li & Liu, 2021). Therefore, digital economy growth is not only based on the provision of infrastructure and a stable economic environment, but is also affected by industrial structure change, innovation capabilities, and other factors in the context of green development (Chen & Wang, 2022). The LCCP policy advances green development by optimizing the industrial structure and encouraging technological innovation; therefore, the policy can encourage digital economy growth through industrial structure transformation and technological innovation, resulting in green development.
Industrial structure effect of LCCP policyThe LCCP policy contributes to industrial structure change (Zheng et al., 2021). The strict environmental control policy makes industries with high pollution and emissions to suffer from higher environmental compliance costs, which can substantially improve operating costs and access standards (Zhang et al., 2019;Song et al., 2021). In parallel, new digital industries have gained competitive advantages. As a result, under the constraints of environmental policies, high-polluting sectors are forced to migrate or transition to low-carbon and clean production. Considering social and economic benefits, the LCCP policy also internalizes the pollution control cost through market-oriented means, such as levying pollution charges, subsidies, and carbon emissions trading (Shen et al., 2021). These measures fully leverage the market's regulatory role and alter enterprises’ cost–benefit relationship. Under the pressure of short-term costs, while considering long-term economic benefits, enterprises will take the initiative to adjust production structure and technology levels, revise the original allocation of production components and decrease investment in high-carbon emission industries. Therefore, the input of social production factors will flow from high-carbon industries to low-carbon and clean industries. In other words, with upgrading industrial industries, some emerging industries represented by digital technology can rapidly develop. Given this, we contend that the LCCP policy has encouraged industrial structure change, which provides more opportunities for digital economy growth, advancing green development.
Technological innovation effect of LCCP policyThe LCCP policy can enhance technological innovation. Under the constraints of the LCCP policy, operating costs for enterprises with high pollution, high energy consumption, and low production efficiency will rise and profit will decrease. When an enterprise's marginal cost is close to its revenue, it may cease production, relocate, or conduct technological innovation. Due to the irreparability of sunk costs, most enterprises will choose to make up for environmental compliance costs through technological innovation to promote sustainable development (Wu et al., 2022). In other words, LCCP policy enforcement will be supported by the ongoing improvement of enterprises’ capacity for innovation (Zhu & Lee, 2022). Traditional industries use digital technology to achieve sustainable development through controlling the discharge of pollutants and strengthening waste management. There are three ways for traditional industries to rapidly realize low-carbon development. First, to increase production capacity and improve efficiency, enterprises will use emerging information technology to upgrade traditional production equipment. Second, improving traditional functions, and enhancing products’ scientific and technological content. Third, changing the organizational form and management in conventional industries and improving management efficiency through scientific leadership, information management, and intelligent management. The above processes of applying emerging information technology to realize industrial transformation and improve production efficiency are called industrial digitalization. Industrial digitalization is a powerful engine driving the digital economy's explosive growth. In the transformation from traditional to new industries, the requirements for technological innovation have gradually increased, establishing a sustained and persistent market demand for the use of new technology (Peng & Tao, 2022). Furthermore, as technological innovation advances, regional innovation awareness and willingness will rise, encouraging traditional industries to adopt innovation related to digital transformation and advancing digital economy growth. Frontier technological innovation demands a lot of workforce, financial, and material resources, leading to intense uncertainty, long cycle time, high market risk, and positive externality (Huang et al., 2021); thus, it is difficult for enterprises to independently implement digital transformation. Therefore, implementing the LCCP policy requires local governments to have a leading role by formulating fiscal and tax policies that encourage low-carbon development. By making relevant scientific and technological funds available, government departments can help alleviate enterprises’ financial difficulties, reduce the risk of innovation, and encourage enterprises to conduct technology innovation and development (Lian et al., 2022). Furthermore, government subsidies and guidance funds will indicate that the government supports enterprises’ implementation of technological innovation (Ren et al., 2021). Such support will also send a reliable positive signal to venture investors regarding the prospect of digital transformation in traditional industries, which will help enterprises attract more social risk funds for digital transformation, and ultimately encourage digital economy growth to realize green development.
The following hypotheses are proposed:
H1 The LCCP policy may promote digital economy growth and advance green development.
H2 The LCCP policy may encourage digital economy growth by changing industrial structure and promoting technological innovation.
The LCCP policy has noticeable spatial and temporal differences; thus, we apply time-varying DID models to precisely determine the influence of policy implementation on digital economy growth, which also helps to alleviate potential endogenous problems. The DID method is widely used to analyze to compare the significant difference between intervention and the control groups before and after implementation. ReferencingQiu et al. (2021), we construct a bi-directional city–year fixed effect model to assess the policy effect. Specifically, the following model was set in this study:
where i represents the city and t represents the year; the explained variable, Digei,t, is digital economy growth; and Piloti,t represents the LCCP policy, which is the core explanatory variable, taking a value of 1 if city i is a low-carbon pilot city in year t, and 0 otherwise. β indicates the contrast in the policy impacts on the experimental and control groups. If β is significantly positive, the LCCP policy could contribute to digital economy growth and achieve green development. Zi,t represents several time-varying control variables at the city level. δi is the city fixed effect and ψt is the year fixed effect, both of which are used to control the differences between cities caused by the passage of time. εit is the random disturbance term.Variable descriptionExplained variable
At present, like Chen and Wang (2022), the majority of research has concentrated on applying a digital economy growth index at the provincial level, some of which has used a short period. Most of the existing literature has selected indicators to assess the digital economy based on digital industry attributes, rather than considering the reality of different functions for diverse economic subjects, such as families, and enterprises. The function of the digital economy on consumer and supply sides varies, so it is difficult to measure with a unified digital transformation index. The method constructed for this study addresses this deficiency, as it is divided into consumer digital economy and supply digital economy indices according to different economic subjects, further expanding the digital economy index. The consumer digital economy index primarily reflects the coverage of digital users, including traditional, and mobile internet. Therefore, in this study, the ratio of internet broadband access users to the total population represents the penetration rate of traditional internet, and the ratio of mobile phone users to the entire population is chosen to represent the penetration rate of mobile phones. The data for the two indicators are standardized using the principal component analysis method and then reduced to measure digital economy growth on the consumer side. The supply side digital economy index is measured by the digital information sector's development level, which is defined by the ratio of the digital sector in the total output value or the proportion of employment to total employees. Considering data availability, we use two indicators, including the ratio of urban employment in digital industries and the per capita total telecommunications business. The data for both indicators are standardized using principal component analysis and then reduced in dimensionality to measure digital economy growth on the supply side. Finally, the digital economy's growth level is measured using secondary dimensionality reduction on the supply and consumer sides.
Explanatory variableTo examine the practices and experiences of developing the economy, improving people's livelihoods, combating climate change, and advancing true green development, the NDRC approved five provinces and eight cities, including Guangdong, Hubei, and Tianjin, as the first group of low-carbon pilot provinces and cities in 2010. Announced in 2012, the second batch of pilots included one province and 28 cities, and in January 2017, the third group of pilots consisted of 41 cities and 4 counties. At present, Chain has selected 81 of the 298 prefecture-level cities as pilot regions for low-carbon development. As the second group was released in October 2012, considering the lag effect of policy, the launch time for the second group is defined in 2013 in this study.
Control variablesReferencing Tian et al. (2021) and Ma and Zhu (2022), we use six control variables. 1) Foreign direct investment (FDI; FDI) is obtained by dividing urban FDI by urban GDP. 2) The degree of economic development (Lgdp) is represented by dividing the city's real GDP by its total population then taking the logarithm. 3) Population density (Populace) is represented by the proportion of the total urban population to the administrative area. 4) The intensity of fiscal expenditure on science and technology (Scitech) is calculated by the proportion of government fiscal spending on science and technology. 5) The degree of government intervention (Gi) is calculated as the proportion of general budget expenditure of local finance in GDP. 6) The financial development index (Fin) is expressed in terms of year-end deposits and loans of financial institutions as a percentage of GDP. Table 1 presents the calculation methods for the above variables.
Definition of main variables.
The annual China City Statistical Yearbook, the China Information Industry Yearbook, and the annual statistical bulletin of each city provide this study's economic data. This study applies three steps to manage the sample data for improved representativeness. (1) We remove the samples from the list that are part of districts or counties. (2) We reject samples with seriously missing data in the list. (3) Some missing data are supplemented using linear interpolation and exponential smoothing methods. The above processing yields balanced panel data of 277 cities from 2002 to 2019, of which 66 low-carbon pilot cities represent the experimental group and the remaining 211 cities are the control group.
Table 2 presents the essential statistical characteristics of the main variables. The results indicate that the mean value of digital economy is 0.0632, the standard deviation is 0.750, the minimum value is −1.736, and the maximum value is 7.668, suggesting that digital economy growth varies considerably between different cities, in accordance with the findings of the current literature (Li & Liu, 2021). The value range of other control variables is also within a reasonable range, and individual differences are relatively noticeable, indicating that the samples have good discrimination.
Descriptive statistics.
We use the time-varying DID method to assess the impact of the LCCP policy on digital economy growth, summarizing the benchmark regression findings inTable 3. Regression (1) represents the ordinary least squares regressions results that do not include control variables, and regressions (2)–(7) describe the estimation results for the stepwise incorporation of control variables impacting the digital economy. The results reveal that the estimated coefficient on the policy effect term Pilot is notably positive at the 1% level, regardless whether the control variables are included. Evidently, pilot cities have higher digital economy growth than non-pilot cities. In accordance with the above results, the LCCP policy improved digital economy growth by 0.2287; thus, H1 is verified.
Benchmark regression results.
In the case of control variables, the estimated coefficient of the Fin is 0.0834 and is remarkable at the 5% level, indicating that digital economy growth has benefited from the judicious use of financial resources. In contrast, the estimated coefficient of government intervention Gi is −0.8776, which is notably negative at the 1% level, and the digital economy index decreases by 0.8776 with each percentage point rise in the ratio of local financial general budget expenditure to GDP, indicating that unreasonable government intervention hampers digital economy growth. The coefficient on science and technology expenditure (Scitech) has the largest absolute value in comparison to the other control variables, suggesting that science, and technology expenditure has a more profound impact on digital economy growth. Meanwhile, the estimated coefficient is markedly positive at the 1% level, indicating that increasing financial investment in science and technology considerably contributes to digital economy growth. Additionally, the regression coefficients of economic development level (Lgdp), population density (Populace), and FDI (FDI) are not significant, demonstrating no significant impact on regions’ digital economy.
Parallel trend testThe above provides a preliminary exploration of the contribution of the LCCP policy to digital economy growth. Knowing that compliance with the parallel trend assumption is an essential condition for applying the DID model, referencing Beck et al. (2010) in this regard, we applied event analysis to assess parallel trends with the following model:
where Di,tkis the dummy variable in the year when the LCCP policy was implemented, k 〈 0 indicates k years prior to policy implementation, and k 〉 0 indicates k years following policy implementation.δi is the city fixed effect, ψt is the year fixed effect, andother control variables follow Eq. (1). This study takes the period prior to the implementation of policy as the benchmark period, and the detection range is −6 < k < 6. The vertical axis denotes the dynamic policy effect, and the horizontal axis denotes the policy time point. This study primarily focuses on the estimated coefficient βk, which measures the impact direction of the LCCP policy on the digital economy. When k < 0, βk is not significantly different from 0,; which indicates that the parallel trend assumption is met. Fig. 1 illustrates the estimated value of each regression coefficient of βk under a 99% confidence interval. The results indicate that the regression coefficient of βk is not statistically significant prior to LCCP policy implementation, passing the parallel trend assumption. Following policy implementation, the regression coefficient of βk is statistically significant and rises steadily. This result demonstrates that the LCCP policy has a noticeable and long-lasting promotional effect on digital economy growth.Robustness testPlacebo test

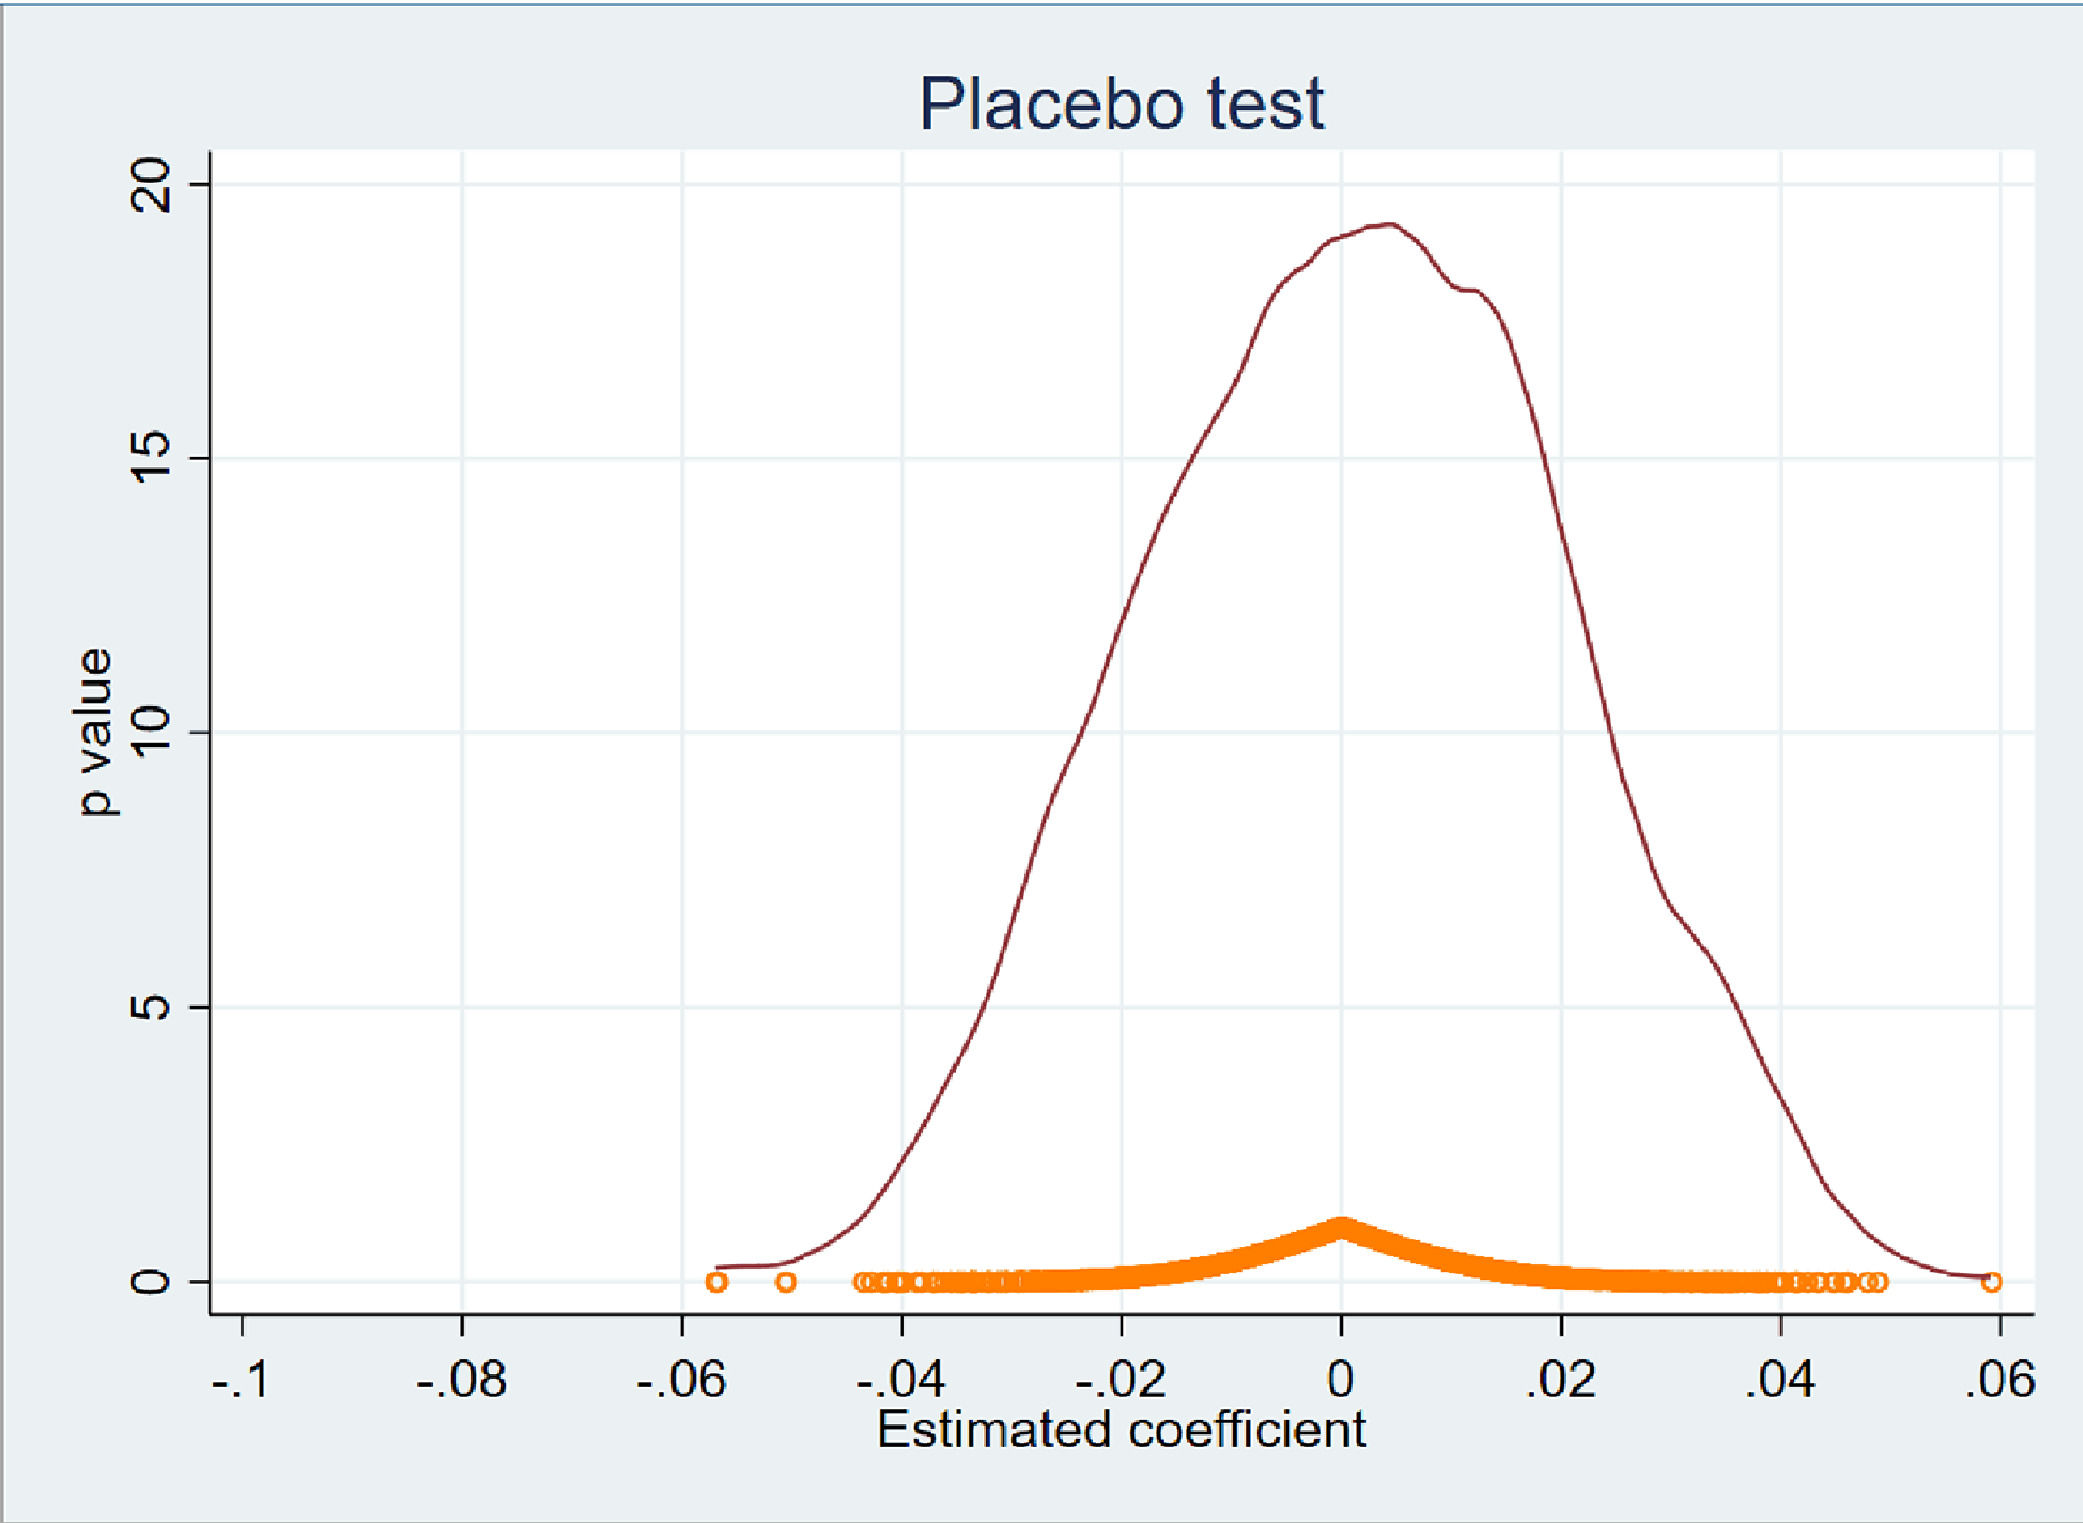
We randomly select virtual experimental and control groups for the placebo test to avoid the possibility that unobservable urban characteristics obstructed the policy effect. Referencing Li et al. (2016), who randomly selected a control group, we grouped the data according to the city first and then randomly selected a year from the year variables in each city as its policy time. Thus, the policy dummy variable is constructed to regress Eq. (1). The above process is repeated 1500 times. Fig. 2 shows the p-value and the parameter estimation value of the policy dummy variable. The findings show that the estimated coefficients of 1500 simulated regressions basically follows the normal distribution, and the benchmark regression coefficient of Eq. (1) is 0.2287, which is far from the estimated value of simulated regression, indicating that the regression results of this study remain tenable.
PSM-DID
While the DID method can separate the net effect of the LCCP policy on the digital economy, it cannot effectively avoid selection bias, whereas PSM can select the samples closest to the features of the treatment and control groups, effectively avoiding selective bias. Therefore, we use the PSM approach to match the control variables for the experimental and control groups year by year.
We need a balance test to demonstrate that the observable variables of the experimental and control groups were not significantly different after matching. The results in Table 4 show that the standardized deviation of majority covariates after 1:2 nearest neighbor matching is less than 5%, indicating that the matching variables are relatively close. Additionally, the p-value after matching is significantly greater than 0.1, indicating that the experimental and control groups were not systematically distinguished, proving that the matching results are more accurate. The DID method is conducted on this basis. The results are presented in column (1) of Table 5, revealing that the policy dummy variable's coefficients are remarkably positive, in alignment with the benchmark regression findings. In addition, radius, and kernel matching methods are used for year-on-year matching. Finally, regression is conducted again based on the matched samples. On the basis of the results in columns (2) and (3) of Table 5, the findings of this study remain solid.
The results of the balance hypothesis test.
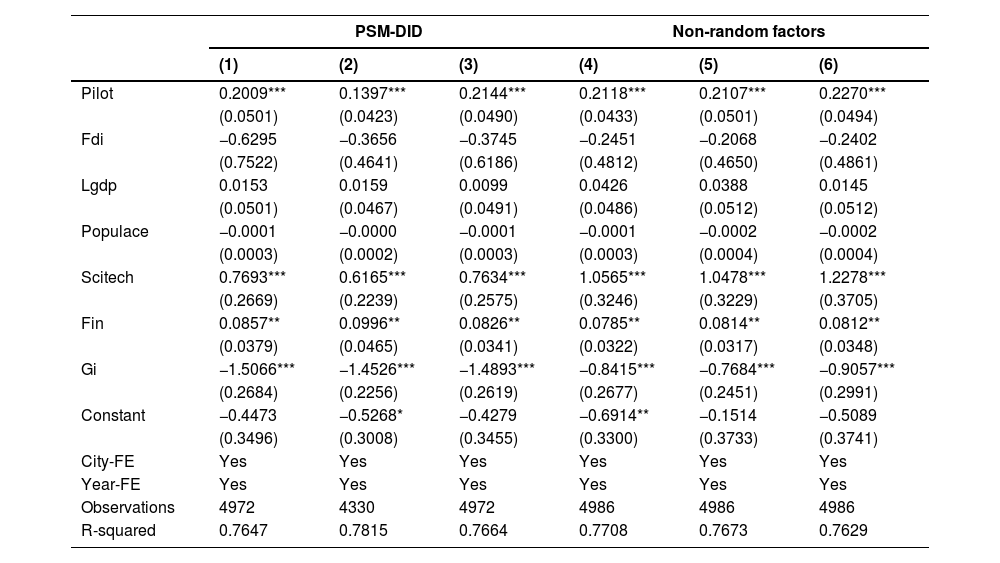
PSM-DID and Non-random factors.
The selection of the low-carbon pilot areas is based on various criteria, including the declared city's basis of work, its exemplary nature, and the representativeness of the pilot layout, and is closely related to factors such the resource endowment, geographical location, economic development, and industrial structure, demonstrating that the selection of pilot cities is non-random. These specific attributes influence digital economy growth to varying degrees over time, leading to estimation bias. To assess the interference of these factors, this study constructed a cross-term between the benchmark factor and the linear time trend, applying it as the control variable. Specifically, we use three factors as benchmark factors, which include whether a city belongs to a Special Economic Zone, whether it belongs to a dual control area, and whether it is located on the right side of the Heihe–Tengchong Line. This enables the impact of intrinsic characteristics differences between cities on the digital economy to be controlled for and alleviates the estimation bias brought by the non-random selection of pilot groups. Columns (4)–(6) of Table 5 present the regression results, and that the estimation coefficient of Pilot is remarkably positive, demonstrating that the estimation results remain valid after considering the possible effect of inherent regional differences between cities.
Tool variable regressionAlthough this study adopted the DID method of two-way fixed effect and the relevant variables that may affect digital economy growth are controlled, it does not totally rule out the endogeneity problem. First, the selection of pilot groups is not random, and factors such as the preliminary work foundation, resource endowment, and the regional representativeness of each region are considered. Second, many factors influence digital economy growth, and it is challenging to be exhaustive by controlling variables, raising the problem of missing variables. Therefore, this study selects urban topographic relief (Rdls) as a tool variable to further test the benchmark regression results. Cities with lower topographical relief, where population and economic activities are more concentrated will affect the choice of low-carbon pilot cities and meet the correlation hypothesis. Moreover, the topography of a region is determined by natural objective factors such as altitude and average area and meets the exogenous hypothesis. This study employs the two-stage least square approach for regression analysis. Column (1) of Table 6 shows the regression results of the first stage, which indicates that pilot cities’ selection is related to topography. The F-value is more than 10, suggesting that the instrumental variables chosen for this study meet the relevant conditions and the question of weak instrumental variables is not present. Column (2) of Table 6 indicates that the second stage regression result is comparable to the previous baseline regression finding and higher than the regression result. This may be because the instrumental variables exclude the non-randomness of pilot cities’ selection, resulting in an increase in the estimation coefficient. The above findings reinforce the fact that digital economy growth can benefit from the application of the LCCP policy.
Tool variable regression and other robustness tests.
Note: ***, **, and * indicate significant at the 1%, 5%, and 10% statistical levels, respectively.
The following methods are used to further examine the robustness of this study. 1) The explanatory and control variables are truncated by 1% and tailed by 1%, considering that extreme values in the sample may affect the benchmark regression results, and the regression results in columns (3) and (4) of Table 6 remain robust. 2) Without considering the policy lag, the time of the three pilot policies was adjusted to 2010, 2012, and 2017 respectively; the empirical results in column (5) of Table 6 basically remain the same as the benchmark conclusions.
Heterogeneous effectsTo further examine the promotional impact of implementing the LCCP policy on the digital economy, this study analyzes heterogeneity in terms of region, urban resource dependence, and city size. We adopt the interaction term to examine heterogeneity to avoid estimation bias brought by sample variation in grouped regressions.
Regional differenceThe cities are classified into coastal and non-coastal regions based on geographical location, assigning a value of 1 for coastal regions and 0 for the non-coastal regions. The results in Table 7 reveal that the LCCP policy has promoted digital economy growth both in the coastal and non-coastal regions; however, the promotional impact is more pronounced in the coastal regions, which is likely due to the superior economic conditions and digital infrastructure in the east. Implementing the LCCP policy has improved the market environment, which further enhances digital economy growth for the coastal region. The non-coastal regions lag behind more in terms of economic development and have a dearth of digital industry compared to coastal regions. Nevertheless, the LCCP policy has created a favorable development environment for new industries in non-coastal regions, which has contributed to digital economy growth.
Heterogeneity analysis of the region.
Note: ***, **, and * indicate significant at the 1%, 5%, and 10% statistical levels, respectively.
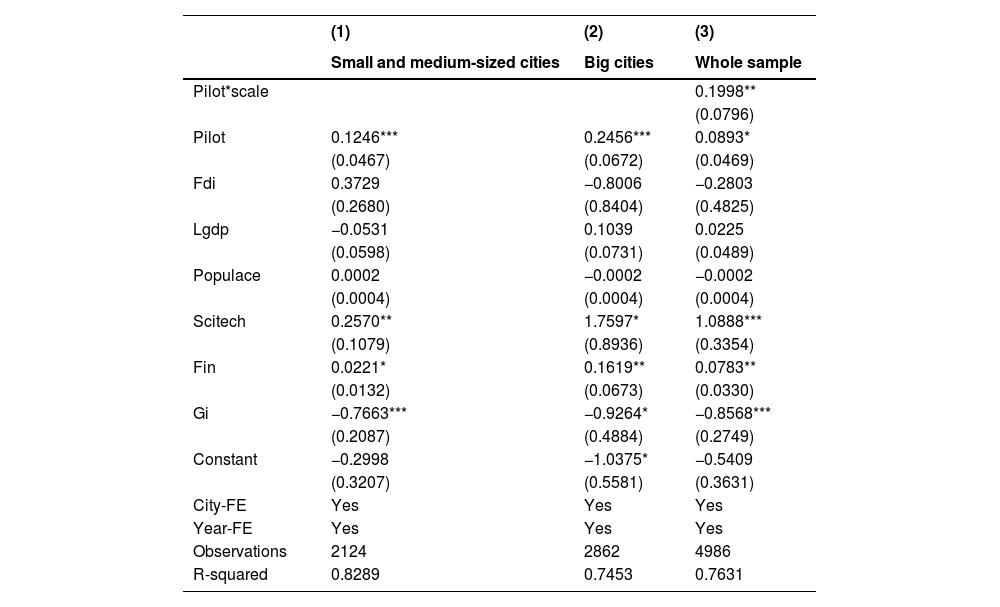
Based on the Notice on Adjusting the Criteria for Classifying City Size, this study defines municipalities with an average annual population of fewer than 1 million with municipal jurisdiction as small and medium-sized cities, and municipalities with an average annual population of more than 1 million under municipal jurisdiction are considered large cities. We explore the policy effects of the LCCP policy based on scale heterogeneity, presenting the specific findings in Table 8. Large cities’ coefficients are higher than smaller cities, indicating that the policy impact is greater in large cities. This result could be because large cities have a well-developed technological innovation system and efficient allocation of innovation resources. Large cities have a superior institutional environment in comparison to small cities; local enterprises have a stronger ability and capability to improve technological innovation efficiency by optimizing resource allocation, increasing R&D subsidies, and promoting the specialized division of labor. Therefore, the LCCP policy has led to higher digital economy growth in large cities. For small and medium-sized cities, although industrial structure, economic development level, and infrastructure construction are not as advanced as those in large-scale cities, such cities can still encourage digital economy growth through special government funding.
Heterogeneity analysis of the urban size.
Note: ***, **, and * indicate significant at the 1%, 5%, and 10% statistical levels, respectively.
We next assign a value of 1 for non-resource-based cities and 0 otherwise on the basis of the Circular on the National Sustainable Development Plan for Resource-based Cities. According to the results in Table 9, the LCCP policy boosts digital economy growth in both non-resource-based and resource-based cities. The former coefficient is higher than the latter, indicating that the effects of the LCCP policy are greater for non-resource-based cities. In comparison to cities with abundant resource endowments, non-resource-based cities could have better industrial structures, more developed digital industries, and a superior innovation base, which are more advantageous to digital economy growth with the support of low-carbon pilot policies. In contrast, resource-based cities have developed a complete industrial system with rich natural resources such as forests and minerals. This system is primarily characterized by high energy and emissions-intensive resource-based sectors, which can lead to such problems as irrational industrial structure and ecological environment deterioration, affecting cities’ sustainable development. Under strict top-down environmental control, increasing the enterprises’ production costs raises market entry barriers. In the short term, this is unfavorable to polluting enterprises’ growth, but resource-based cities must transition traditional industries to achieving long-term low-carbon development through digital economy empowerment.
Heterogeneity analysis of urban resource dependence.
Note: ***, **, and * indicate significant at the 1%, 5%, and 10% statistical levels, respectively.
The previous results demonstrate that the LCCP policy is supportive of digital economy growth and advancing green development. This section examines the intrinsic mechanism of this pilot policy to encourage the digital economy in the light of theoretical analysis. Referencing Baron and Kenny (1986), we build a mediating effect test model to examine the intrinsic mechanism of the policy effect on digital economy growth. The remaining equations are based on Eq. (1), as follows:
where Mi,t represents the mediating variable, which is measured by industry structure (Ind) and technological innovation (Inn). The test step of the three-step approach is based on the significantly positive coefficients β of the core explanatory variables in Eq. (1), if the coefficients τ and ρ2 of Eqs. (3) and (4) are also significantly positive and are smaller than β, this indicates that the enforcement of the LCCP policy has contributed to digital economy growth through upgrading industrial structure change and boosting technological innovation. Table 10 presents the results of the mediation effect test.

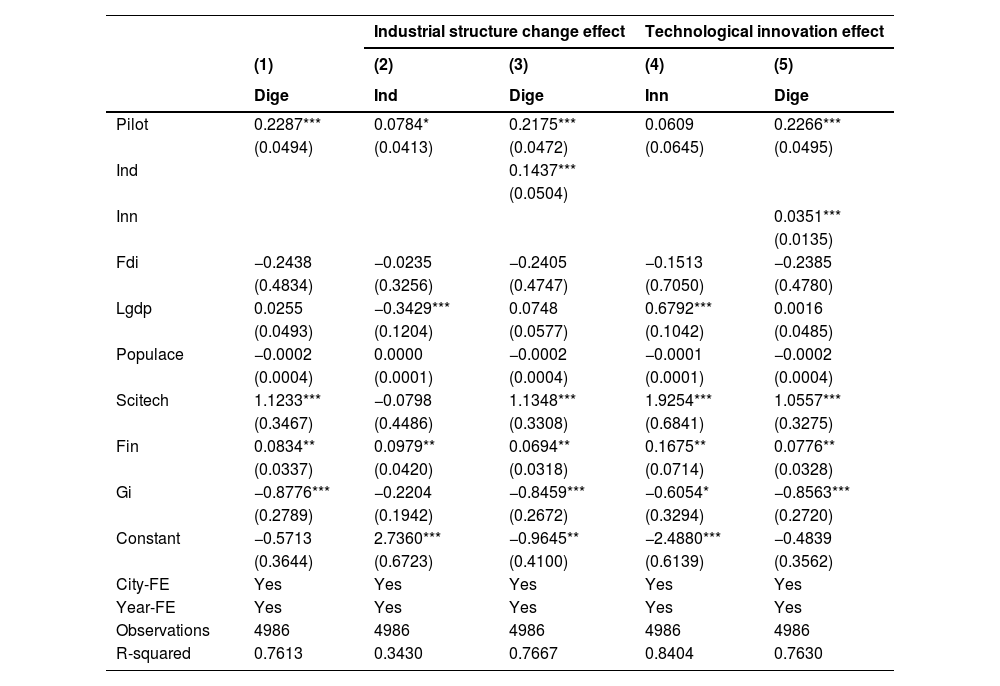
Mechanism test.
This study references Ma and Zhu (2022), calculating the ratio of value added by the secondary and tertiary sectors to measure industrial structural upgrading. According to the results in Table 10, column (1) reflects the effect of the LCCP policy on digital economy growth, and columns (2) and (3) examine the mediating effect of industrial structure change. The findings in column (2) indicate that the LCCP policy has a strong beneficial impact on industrial structure upgrading, which satisfies the basic conditions for the mediating effect model to hold. In column (3), both the policy effect term Pilot and industrial structure upgrading (Ind) have a significant positive connection with digital economy growth. In addition, combining the results of the first two columns, we find that industrial structure change can encourage digital economy growth; however, the coefficient of Pilot decreases from 0.2287 to 0.2175, indicating that industrial structure change has a partial mediating effect. Thus, pilot cities enhance digital economy growth through industrial structure optimization and upgrading.
The technological innovation effectMost scholars evaluate technical innovation using the amount of substantive patent applications. To reduce the effect of heteroskedasticity, we use the logarithm of patent applications to represent technological innovation in cities. Columns (4) and (5) of Table 10 analyze the mediating role of technical advancement. Column (4) shows that the policy effect of the term Pilot is remarkably positive, demonstrating the LCCP policy significantly contributes to technological innovation, satisfying the basic conditions for the mediating effect model to hold. In column (5), both the policy effect term Pilot and technological innovation have a significant positive connection with digital economy growth. Therefore, combining the results of the first two columns, this study determines that technological innovation can encourage digital economy growth; however, the coefficient of Pilot decreases from 0.2287 to 0.2266, showing a partial mediating effect. Thus, increase in the level of urban innovation is a channel through which the LCCP policy encourages digital economy growth, and the above empirical results of the influence mechanism verify H2.
ConclusionCountries are exploring green and sustainable development paths to address extreme environmental tasks (Hosan et al., 2022). The digital economy, with its characteristics of permeability, platform, sharing, and low marginal cost, can effectively empower traditional industries, promote reforms in products, business models, and industrial patterns, and facilitate deep integration of economic growth and green development (Ma & Zhu, 2022). Previous research has ignored the fact that the process of low-carbon development impacts the digital economy. The LCCP policy is essential for China to actively respond to the global green and low-carbon development trend, firmly follow the green and sustainable development path, and achieve carbon emissions reduction and energy conservation (Lou et al., 2019). As an environmental management policy, the LCCP policy benefits energy-saving and emissions reduction, effects that have been confirmed. The policy will also significantly impact economic activities, such as industrial structure, technological innovation, science investment, and a green economy, presenting a significant opportunity for economic restructuring (Wang et al., 2021). Moreover, the digital economy depends on elements like human capital, technology, industrial structure, and government investment in science and technology in each region, and these elements are vital for its development (Li & Liu, 2021). The ways in which the LCCP policy will influence digital economy growth and green development deserves further investigation, meriting additional examination.
Based on consumption and supply sides, this research assesses the policy effect on digital economy growth using the time-varying DID model. The empirical evidence first demonstrates that implementing the LCCP policy promotes digital economy growth in cities, the growth of the digital economy in pilot cities is about 22.87% more than in non-pilot areas, and the promotional effect is more evident with the extension of policy implementation years. Second, the policy effect is influenced by the geospatial location of cities, urban resource endowment, and city scale. The promotional effect on the digital economy of coastal regions, non-resource-based cities, and large-scale cities is more prominent than in other cities. Third, the findings of mechanism identification indicate that the LCCP policy improves the digital economy by increasing policy R&D funding, changing industrial structure, and enhancing technological innovation capacity. The results of this study remain robust following several robustness tests.
This study's findings have some guiding implications for deepening the LCCP policy. First, based on the current green development experience of pilot cities, the government could expand the pilot scope and further improve the low-carbon economic development system. It is also essential to strengthen and clarify policy guidelines for green development, increase support for traditional industries to conduct low-carbon transformation, and lead enterprises to make a clean and low-carbon transition through the empowerment of digital technology. Finally, the government should build a market-oriented technological innovation system to accelerate the development of a low-carbon industrial structure. In this study, we find that urban low-carbon management is primarily driven by upgrading industrial structure and boosting technological innovation to enhance digital economy growth and achieve green production. Consequently, the government should invest more in technological innovation and science and vigorously encourage new energy, environmental protection, and energy conservation industries. We assert that these measures have the dual role of promoting technology and changing structure, which can further advance digital economy growth.
As with any empirical study, ours has some limitations. First, our data are limited in that we only examine a city-level sample, and we do not assess data at the county level; thus, the effect of LCCP policy on digital economy growth at the county level could be further investigated. Second, the research does not consider the spillover effect of LCCP policy on the digital economy's growth, and we plan to examine the spatial impact of pilot policy on the digital economy's growth in light of various degrees of environmental governance in surrounding cities. Third, as with all studies exploring the digital economy's impact, we cannot infer all potential channels that can promote the digital economy's development. Our analysis only focuses on two mechanisms of industrial structure upgrading and technological innovation. We believe a more in depth analysis of these problems could achieve persuasive and relevant conclusions, opening an exciting avenue for future research.
Author contributionsConceptualization, Zeyu Wang and Wenzuixiong Xiong; Methodology, Wenzuixiong Xiong and Yunsi Chen; Software, Wenzuixiong Xiong and Fanbao Xie; Validation, Wenzuixiong Xiong and Feiyan Liang; Formal Analysis, Chengming Li and Zeyu Wang; Investigation, Wenzuixiong Xiong and Zeyu Wang; Resources, Wenzuixiong Xiong and Feiyan Liang; Data Curation, Chengming Li and Zeyu Wang; Writing – Original Draft Preparation, Zeyu Wang, Wenzuixiong Xiong and Feiyan Liang; Writing – Review & Editing, Yunsi Chen, Feiyan Liang and Fanbao Xie; Visualization, Wenzuixiong Xiong; Supervision, Zeyu Wang and Wenzuixiong Xiong; Project Administration, Zeyu Wang and Wenzuixiong Xiong; Funding Acquisition, Wenzuixiong Xiong and Zeyu Wang.
Zeyu Wang, male, holds a doctor's degree in management. He is currently a lecturer at the School of Public Administration, Guangzhou University. His-research interest is digital economy and management innovation.
Feiyan Liang is a master candidate at the School of Economics in Minzu University of China. Her research interests include low-carbon economy and digital economy.
Wenzuixiong Xiong, male, PhD in Media Arts, the School of Art, Wuhan University,and Works in School of Art, Hubei University, research interests include digital media, digital industry,and Virtual Reality.
Chengming Li (PhD) is an assistant professor at the School of Economics in Minzu University of China. His-research interests include corporate finance, digital economy, and environmental economy.
Yunsi Chen is an associate professor of economics at Wuhan Polytechnic University. His-research interests cover a variety of subjects in the quantitative fields with special interests in economics and econometrics. He got his Ph.D. at the Pennsylvania State University. Before that he used to study at North Carolina State University for a Master's. He can be reached at