


Editado por: Dra. Núria Torner CIBER Epidemiologia y Salud Publica CIBERESP Unitat de Medicina Preventiva i Salut Pública Departament de Medicina, Universitat de Barcelona
Más datosThere were many studies conducted to determine how immunization affects people with long-term COVID. The results of those studies have caused debate as they gave rise to varying outcomes. Some evidence indicates a change in, an improvement in, a continuation of, or even a worsening of long-term COVID symptoms following vaccination. The ratio of change in antibody titers was noticeably larger in the group of people whose illnesses became worse. Hence, this study aimed to explore potential post-COVID-19 vaccination syndrome (PCVS) in vaccinated individuals and also to assess their quality of life (QoL).
MethodologyBetween September 2021 and May 2023, an ambidirectional, descriptive, follow-up cohort study was conducted, enrolling participants who were 18 years of age or older, met the vaccination requirements established by the Ministry of Health and Family Welfare, Government of India, and had completed the primary immunization series with the AZD1222® or BBV152® vaccine. The prevalence of PCVS and the QoL measured using EQ-5D-5L were assessed at 1 month, 6 months, and 12 months post-COVID-19 vaccination.
ResultsAZD1222® vaccine was received by 84.28% (343) of the participants, and BBV152® vaccine was received by 15.72% (64) of the study participants. A month after the primary vaccination series, 52.8% (215) of the total participants had at least 1 PCVS, 39.8% (162) at 6 months, and 64.6% (263) at 12 months. Among those who had received vaccinations, the QoL increased at 6 months to 0.975±0.08 and declined at 12 months to 0.94±0.13 from 0.949±0.13 at 1 month after receiving a primary immunization. The overall prevalence of PCVS between AZD1222®-vaccinated individuals and BBV152®-vaccinated individuals at a month post-vaccination was 54.5% vs. 43.8%, at 6 months it was 41.1% vs. 32.8%, and at 12 months it was 65.59% vs. 59.4%. The QoL between AZD1222®-vaccinated individuals and BBV152®-vaccinated individuals at a month post-vaccination was 0.95±0.13 vs. 0.95±0.126, at 6 months it was 0.98±0.08 vs. 0.97±0.07, and at 12 months it was 0.94±0.12 vs. 0.92±0.20. However, there was no statistically significant difference in the prevalence of PCVS and QoL between AZD1222® and BBV152®-vaccinated individuals.
The percentage of participants who had at least one PCVS was 83.9% (146) in the group that got booster doses and 50.2% (117) in the group that did not. The QoL was 0.9±0.15 in the group receiving booster dosages and 0.96±0.11 in the group not receiving them. There was a statistically significant difference in the prevalence of PCVS and QoL between booster dose recipients and no booster dose recipients.
ConclusionIn the study, we observed the prevalence of PCVS and was similar to long-term COVID; it declined over time and increased following booster immunization. Contrary to PCVS prevalence, QoL rises with time and falls after booster doses. There is no difference in the prevalence of PCVS and the quality of life among AZD1222® and BBV152®.
Se realizaron muchos estudios para determinar cómo la inmunización afecta a las personas con COVID a largo plazo. Los resultados de esos estudios han causado debate, ya que dieron lugar a resultados variables. Algunas pruebas indican un cambio, una mejora, una continuación o incluso un empeoramiento de los síntomas de COVID a largo plazo después de la vacunación. La proporción de cambio en los títulos de anticuerpos fue notablemente mayor en el grupo de personas cuyas enfermedades empeoraron. Por lo tanto, este estudio tuvo como objetivo explorar el posible síndrome de vacunación post-19 (PCVS) en individuos vacunados y también evaluar su calidad de vida (CV).
MetodologíaEntre septiembre de 2021 y mayo de 2023, se realizó un estudio de cohorte de seguimiento ambidireccional, descriptivo, que incluyó participantes que tenían 18 años de edad o más, cumplían con los requisitos de vacunación establecidos por el Ministerio de Salud y Bienestar Familiar del Gobierno de la India y habían completado la serie de inmunización primaria con la vacuna AZD1222® o BBV152®. La prevalencia de PCVS y la CV medida con EQ-5D-5L se evaluaron al mes, seis meses y doce meses después de la vacunación contra COVID-19.
ResultadosLa vacuna AZD1222® fue recibida por el 84,28% (343) de los participantes, y la vacuna BBV152® fue recibida por el 15,72% (64) de los participantes del estudio. Un mes después de la serie de vacunación primaria, 52,8% (215) del total de participantes tenían al menos un PCVS, 39,8% (162) a los seis meses y 64,6% (263) a los 12 meses. Entre los que habían recibido vacunas, la CV aumentó a los seis meses a 0,975 ± 0,08 y disminuyó a los 12 meses a 0,94 ± 0,13 de 0,949 ± 0,13 al mes después de recibir una inmunización primaria. La prevalencia general de PCVS entre individuos vacunados con AZD1222® e individuos vacunados con BBV152® un mes después de la vacunación fue de 54.5% vs. 43.8%, a los seis meses fue de 41.1% vs. 32.8%, y a los 12 meses fue de 65.59% vs. 59.4%. La CV entre los individuos vacunados con AZD1222® y los individuos vacunados con BBV152® a un mes después de la vacunación fue de 0,95 ± 0,13 vs. 0,95 ± 0,126, a los seis meses fue de 0,98 ± 0,08 vs. 0,97 ± 0,07, y a los 12 meses fue de 0,94 ± 0,12 vs. 0,92 ± 0,20. Sin embargo, no hubo diferencias estadísticamente significativas en la prevalencia de PCVS y CV entre los individuos vacunados con vacunados con BBV152® un mes y BBV152®.
El porcentaje de participantes que tenían al menos una PCVS fue del 83,9% (146) en el grupo que recibió dosis de refuerzo y del 50,2% (117) en el grupo que no lo hizo. La CV fue de 0,9 ± 0,15 en el grupo que recibió dosis de refuerzo y 0,96 ± 0,11 en el grupo que no las recibió. Hubo una diferencia estadísticamente significativa en la prevalencia de PCVS y CV entre los receptores de dosis de refuerzo y los que no recibieron dosis de refuerzo.
ConclusiónEn el estudio, observamos la prevalencia de PCVS y fue similar a COVID a largo plazo; disminuyó con el tiempo y aumentó después de la inmunización de refuerzo. Contrariamente a la prevalencia de PCVS, la CV aumenta con el tiempo y disminuye después de las dosis de refuerzo. No hay diferencia en la prevalencia de PCVS y la calidad de vida entre AZD1222® y BBV152®.
The pandemic caused by the new SARS-CoV-2 virus has been significantly controlled with vaccination. It has been proven that the neutralizing antibodies produced after immunization reduce the risk of contracting a serious or life-threatening COVID-19 illness or mortality.1–3 However, the neutralizing antibodies decrease and vaccine efficacy drops by 8% after 6 months of vaccination across all age groups, as per the World Health Organization's (WHO) interim statement on booster doses.4 It is similar to the defence created by innate immunity following SARS-CoV-2 infection, which appears to provide 80%–90% protection from reinfection for up to 7 months.5 Both antibodies developed following infection and immunization are capable of preventing viral invasion and are primarily targeted at the surface spike protein.6–8 Individuals who recover from COVID-19 usually have high levels of IgG antibodies to SARS-CoV-2 and higher levels of IL-6,6,7 which is associated with the prevalence of long-term COVID-19.9 Many studies worldwide show a high prevalence of long-term health problems in people who have recovered from COVID-19.10–15 It raises the concern of whether the COVID-19 vaccine has any longer health issues similar to COVID-19 recovered individuals.
Many studies have been done to find out how vaccination impacts those who have had long-term COVID.16–27 The findings of those studies are subject to debate; the data indicate that long-term COVID-19 symptoms have improved, changed, remained unchanged, or worsened. Studies that supported the overall improvement of the long-term symptoms of COVID-19 also reported a certain percentage of worsening symptoms.16–22 Tsuchida et al. reported that the antibody titer change ratio was considerably higher in the group with the worsened condition compared to the group without the worsened condition.27 Peghin et al. observed that vaccinations increase the immunogenicity, antibody titers, and reactogenicity in individuals with a history of infection compared to those who had not previously been infected.14
A study performed by Marschner et al. revealed that a small proportion of people who experienced acute myocarditis after vaccination developed continued cardiac inflammation and edema at 2-month follow-up.28 Thus, the goals of this study were to explore potential post-COVID-19 vaccination syndrome (PCVS) in vaccinated individuals and to assess their quality of life (QoL).
MethodologyStudy settingMandya is located in the southern part of Karnataka, which consists of 7 taluks and home to a population of 19.5 lakhs. On August 23, 2021, this district reported being administered 10 50 510 doses of vaccination, with 2 33 559 of the recipients completing their primary immunization series (Supplementary 1). 83.3% of the population received the AZD1222® vaccine, whereas 15.34% received the BBV152® vaccine, which was a 5.4:1 ratio.29
Study designAfter receiving approval from the Adichunchanagiri Hospital and Research Centre's institutional ethical committee (IEC/AH & RC/022/2021), an ambidirectional, descriptive, follow-up, cohort study was carried out between September 2021 and May 2023. The Clinical Trials Registry of India (CTRI) assigned the study the registration number CTRI/2021/08/035660.
Sample sizeWe considered the total vaccinated individuals who completed a primary immunization series in the Mandya district on August 23, 2021, as a population size for the study. The estimated sample size for the study was 385 with a margin of error of 5%, a confidence interval of 95%, and a response distribution of 50% using the Raosoft® sample size calculator.
Sampling strategyWe used a first-come, first-served strategy to quickly recruit participants. They were then added to the corresponding subpopulations of AZD1222® and BBV152® vaccinations in a ratio of 5.4:1 as participants from the target population indicated interest in taking part in the study up until the required sample sizes were reached.
Study participantsThe study enrolled individuals who were 18 years of age or older and met the immunization criteria established by the Ministry of Health and Family Welfare (https://www.mohfw.gov.in/covid_vaccination/vaccination/index.html). Eligible participants were required to have received a primary immunization series of either AZD1222® or BBV152® at least 1 month prior to enrolment.30
Exclusion criteria for the study included individuals who had received any COVID-19 vaccinations other than the study vaccines, those who had received study vaccinations but not completed primary immunization series, or those who had completed primary immunization series but had not reached 1-month post-vaccination at the time of enrolment. Additionally, individuals who had previously recovered from a COVID-19 infection or had chronic diseases such as diabetes, arthritis, mental illness, asthma, or COPD were also excluded from the study.
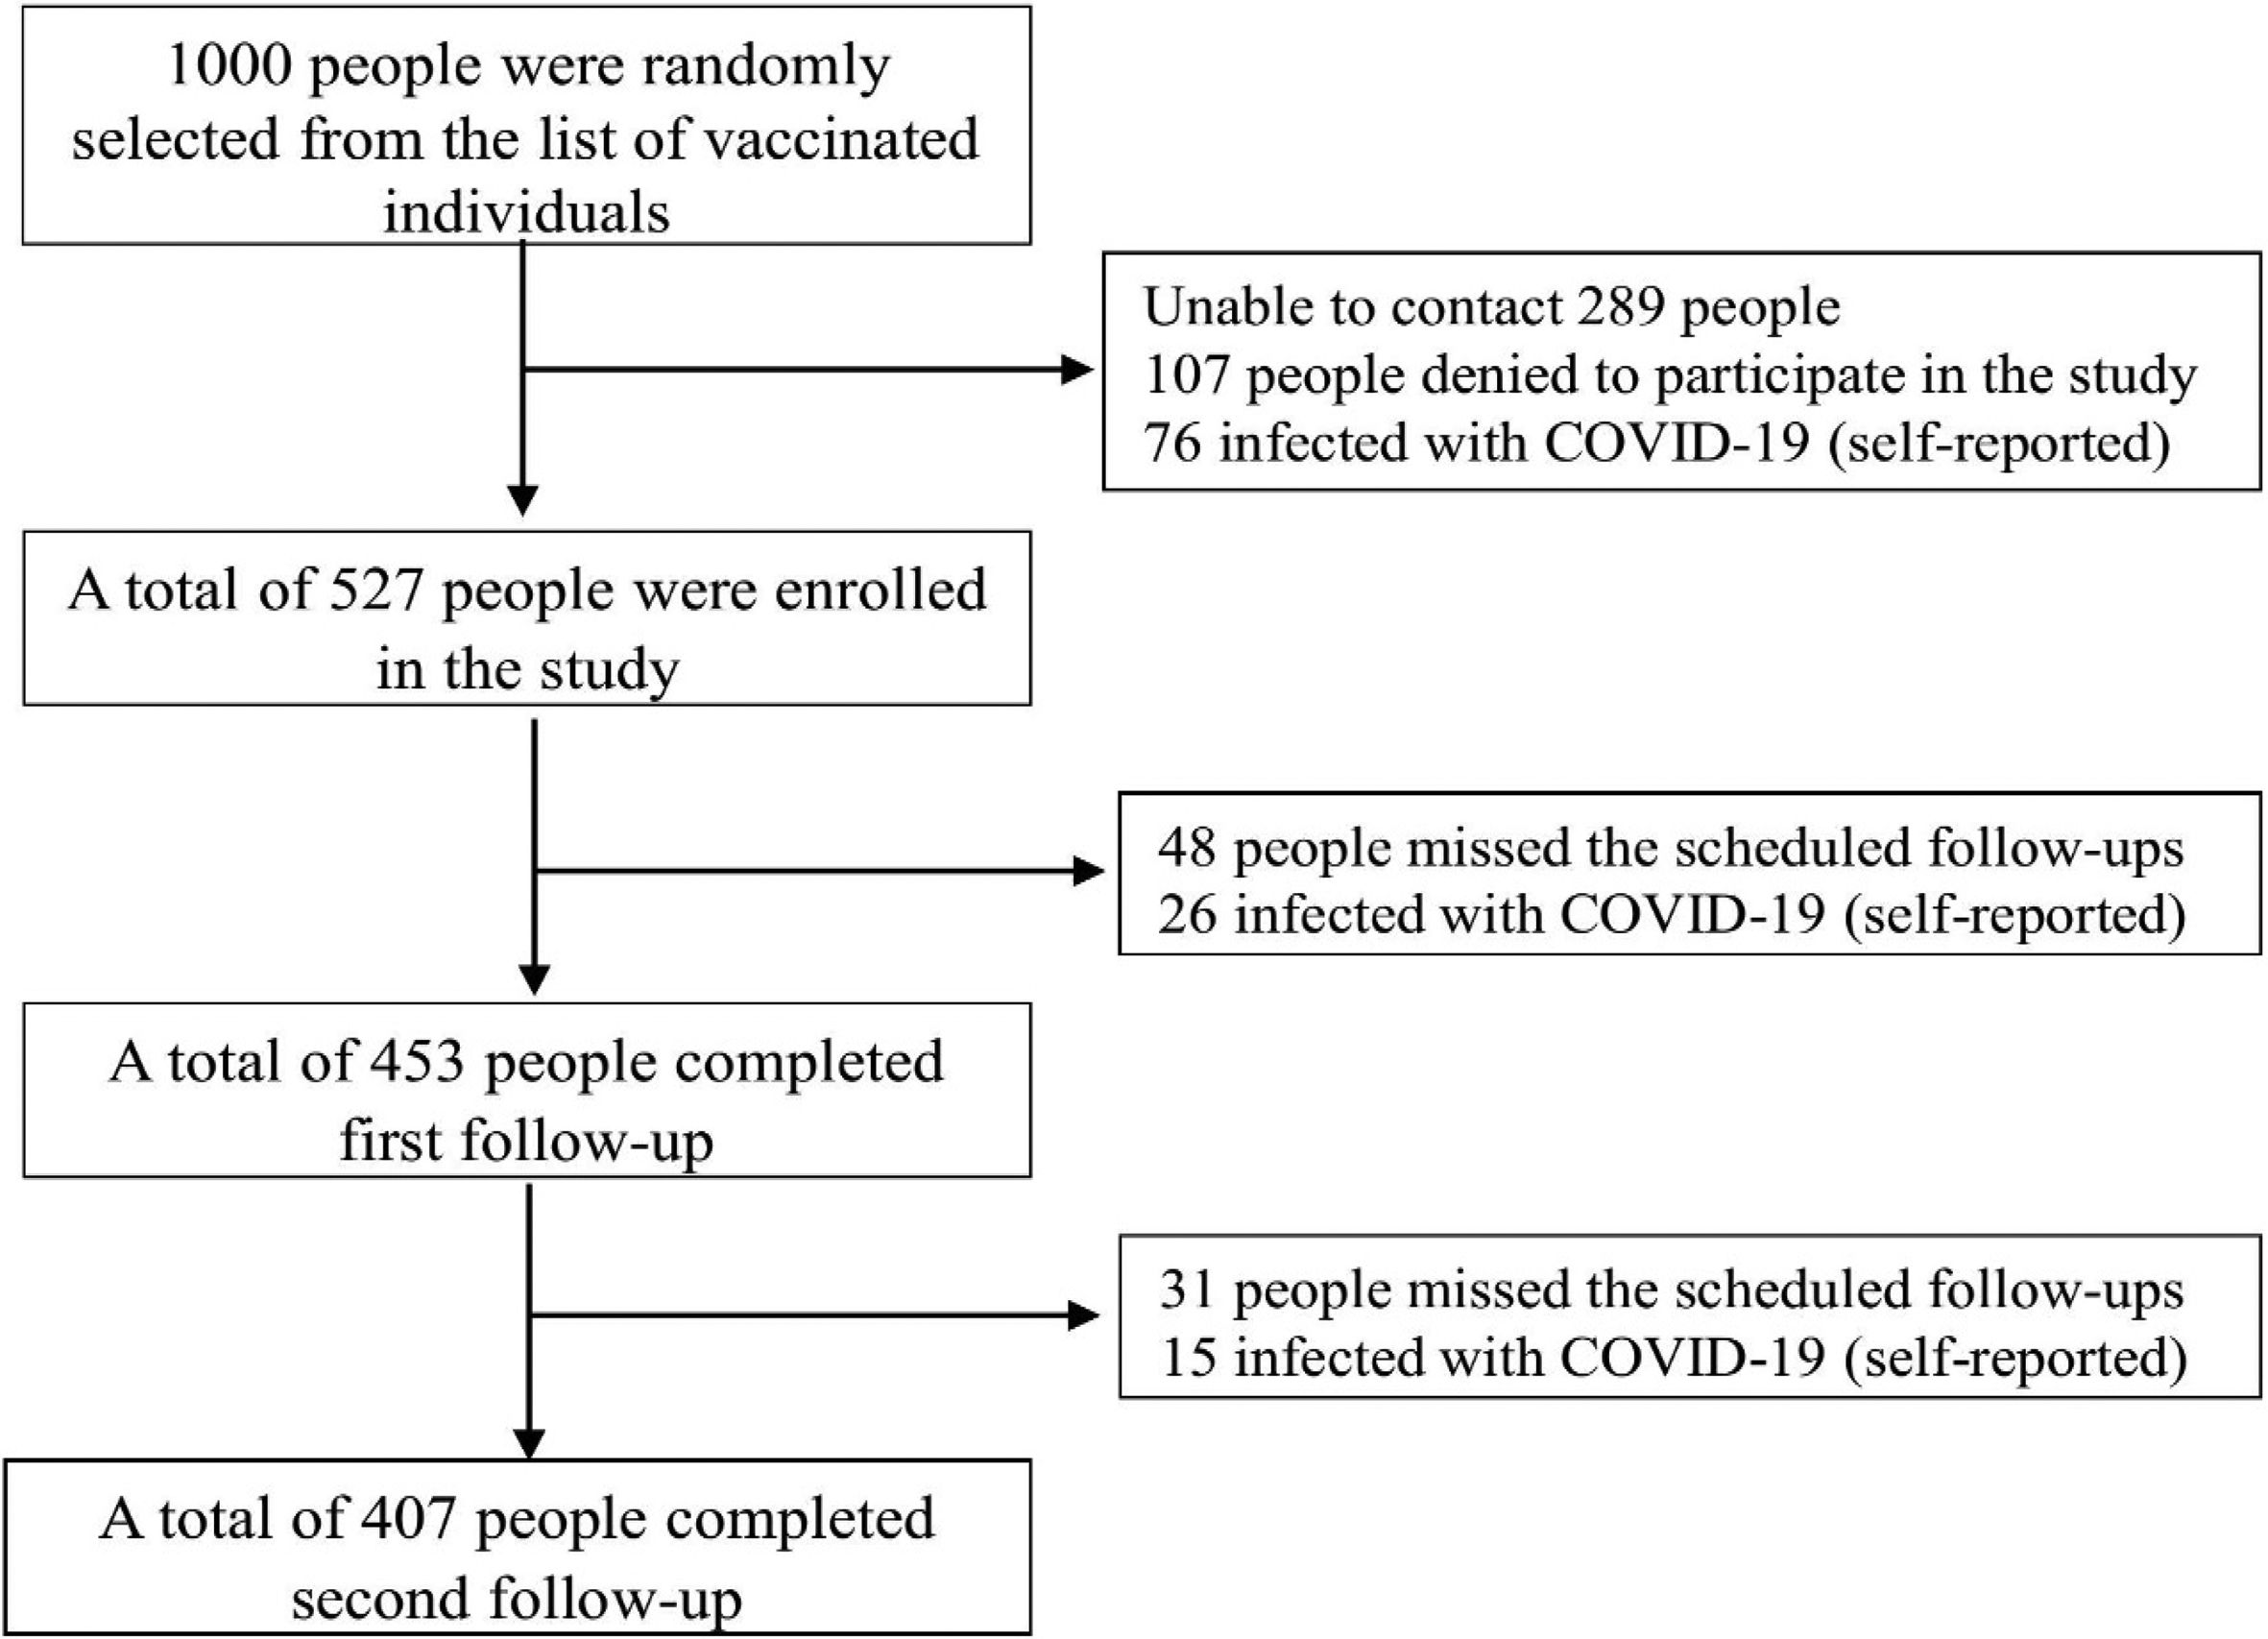
Study procedureThe vaccination centers provided a list of those who had completed the COVID-19 primary immunization series. Among them, 1000 individuals who had completed a month long post-primary immunization series were contacted and invited to take part in the study. Interested individuals underwent screening to determine if they met the inclusion criteria and were then requested to provide their consent to participate. For identification purposes, a 10-digit code (in the format year-month-date-SN) was given to each participant along with a personal profile form.
Face-to-face interviews were used to gather information on demographics and clinical manifestations, which include general symptoms such as fatigue, myalgia, and hair loss; respiratory symptoms such as cough and dyspnea; cardiovascular symptoms such as chest pain and palpitations; neurological symptoms such as insomnia, headache, lack of concentration, paresthesia, and anxiety; and digestive symptoms such as anorexia and indigestion. Additionally, each participant had a physical exam that included measurements of their body weight, blood pressure (BP), body mass index (BMI), and oxygen saturation. The EQ-5D-5L questionnaire31 was administered to determine the QoL of the participants.
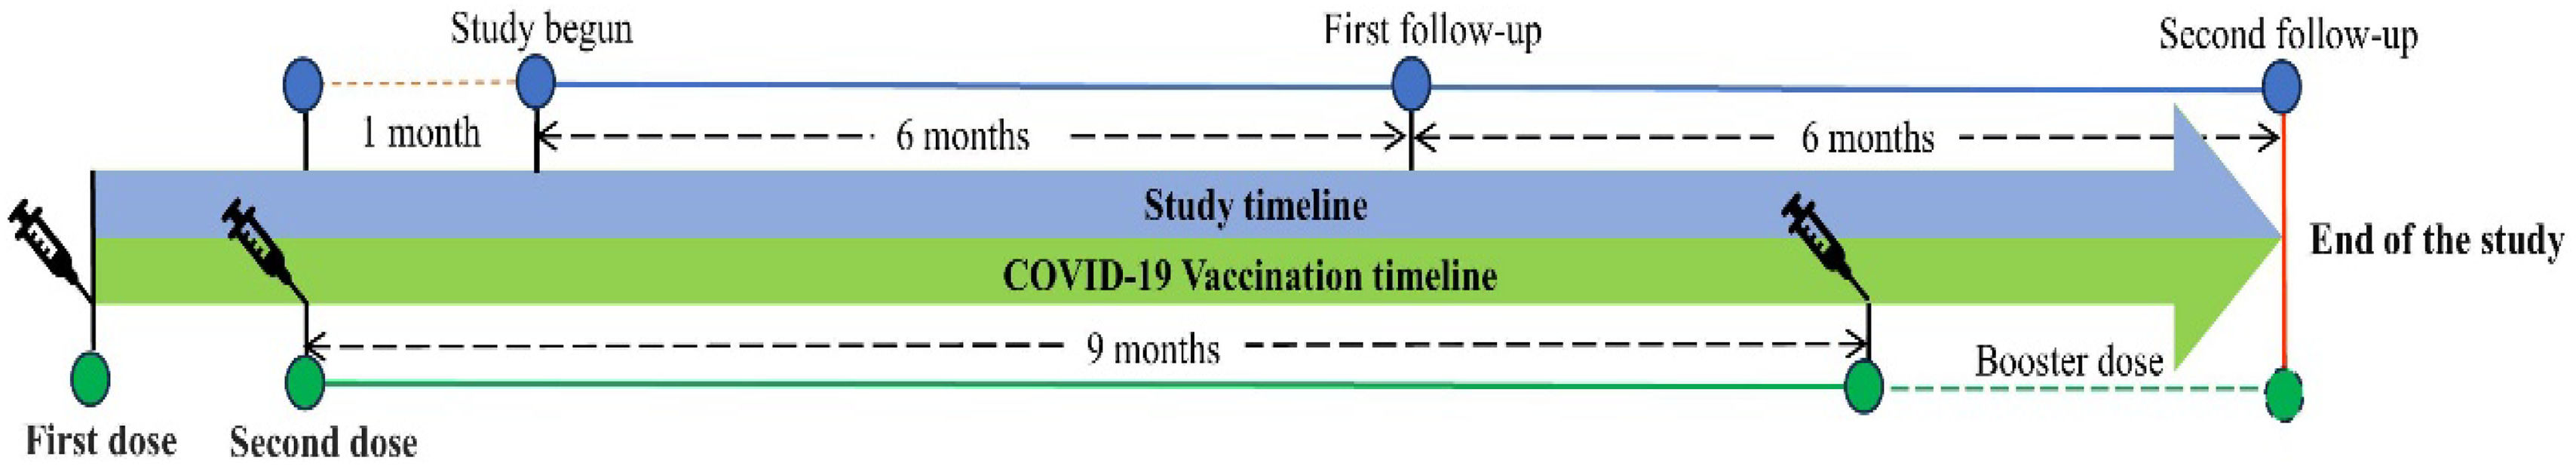
The follow-ups were scheduled every 6 months after the last visit (Fig. 1). Clinical manifestation, physical examination, and assessment of an EQ-5D-5L questionnaire were assessed on every follow-up. The participants were given two chances to reschedule their follow-up.
Statistical analysis
Statistical analysis was performed using the Statistical Package for the Social Sciences (SPSS) version 26 software. Categorical variables including demographical details, vaccines used, side effects of vaccines, medication taken to relieve side effects, leave taken after vaccination, PCVS, and EQ-5D-5L assessments (Supplementary 2) were assessed for frequency and percentage, while numerical variables including age, and QoL were assessed using mean and standard deviation (S.D). Independent samples t-test or Mann–Whitney U test was used to compare the quality of life between vaccines. Chi square or Fisher's exact was used to determine the relationship between various vaccine variables. The odds ratio was measured based on the prevalence of PCVS between individuals who received AZD1222® or BBV152®. The McNemar test was used to compare the prevalence of clinical manifestations between the follow-ups, considering 0.05 as a significant level.
ResultsThe study comprised a total of 527 COVID-19 vaccination recipients who met the predetermined criteria for inclusion. The first and subsequent follow-up evaluations were successfully completed by 77.23% of these participants. The final study participants for the study were 407 individuals (Fig. 2).
Demographic details
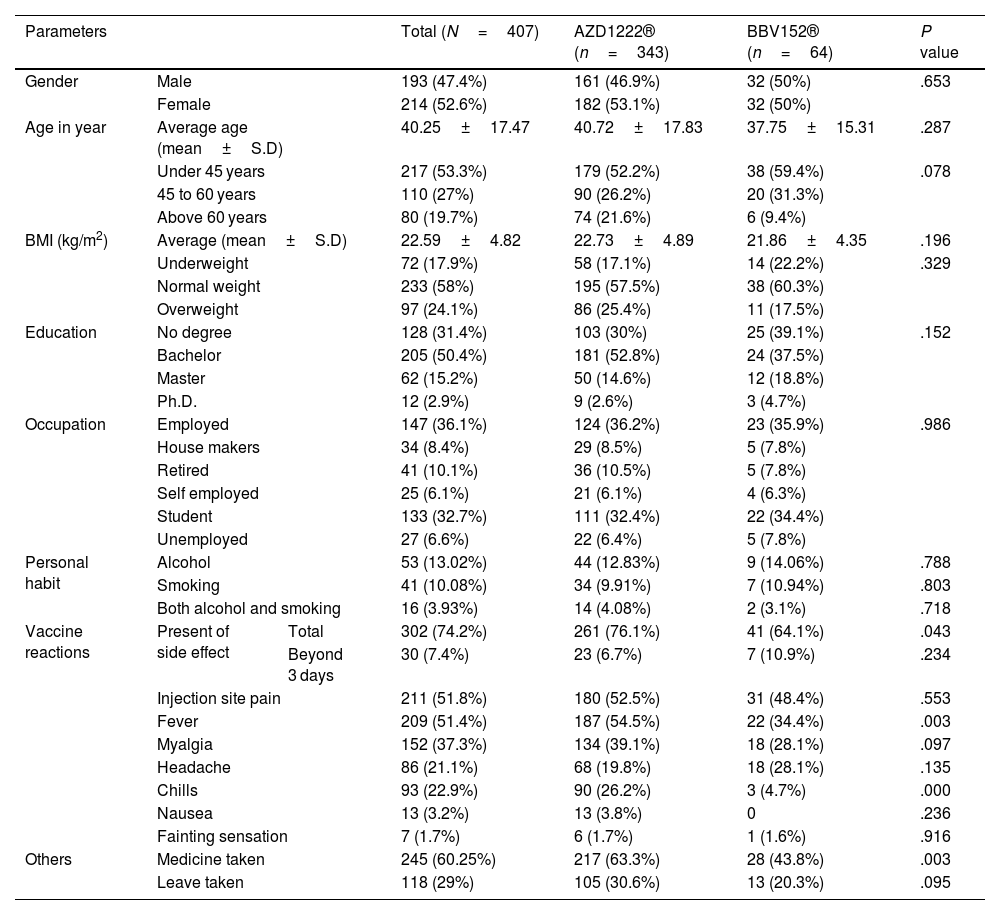
Out of 407 study participants, 52.6% (214) were females and 47.4% (193) were males. The average age of the study participants was 40±17 years, with an average body mass index (BMI) of 22.59±4.82 kg/m2. A bachelor's degree was held by 50.4% (205) of the participants, while 31.4% (128) had no degree, 15.2% (62) had a master's degree, and 2.9% had a Ph.D. (12). Participants who were employed composed 36.1%, followed by students 32.7%, the retired 10.1%, those who were housemakers 8.4%, the unemployed 6.6%, and the self-employed 6.1%. Out of the total participants, 13.02% were drinking alcohol, 10.08% were smoking cigarettes, and 3.93% were drinking alcohol and smoking cigarettes. AZD1222® vaccine was received by 84.28% (343) of the participants, and BBV152® vaccine was received by 15.72% (64) of the study participants. There were no statistically significant differences between AZD1222® and BBV152® in terms of gender, age, BMI, education, and occupation (P>.05) (Table 1).
Demographic details of the study participants.
| Parameters | Total (N=407) | AZD1222® (n=343) | BBV152® (n=64) | P value | ||
|---|---|---|---|---|---|---|
| Gender | Male | 193 (47.4%) | 161 (46.9%) | 32 (50%) | .653 | |
| Female | 214 (52.6%) | 182 (53.1%) | 32 (50%) | |||
| Age in year | Average age (mean±S.D) | 40.25±17.47 | 40.72±17.83 | 37.75±15.31 | .287 | |
| Under 45 years | 217 (53.3%) | 179 (52.2%) | 38 (59.4%) | .078 | ||
| 45 to 60 years | 110 (27%) | 90 (26.2%) | 20 (31.3%) | |||
| Above 60 years | 80 (19.7%) | 74 (21.6%) | 6 (9.4%) | |||
| BMI (kg/m2) | Average (mean±S.D) | 22.59±4.82 | 22.73±4.89 | 21.86±4.35 | .196 | |
| Underweight | 72 (17.9%) | 58 (17.1%) | 14 (22.2%) | .329 | ||
| Normal weight | 233 (58%) | 195 (57.5%) | 38 (60.3%) | |||
| Overweight | 97 (24.1%) | 86 (25.4%) | 11 (17.5%) | |||
| Education | No degree | 128 (31.4%) | 103 (30%) | 25 (39.1%) | .152 | |
| Bachelor | 205 (50.4%) | 181 (52.8%) | 24 (37.5%) | |||
| Master | 62 (15.2%) | 50 (14.6%) | 12 (18.8%) | |||
| Ph.D. | 12 (2.9%) | 9 (2.6%) | 3 (4.7%) | |||
| Occupation | Employed | 147 (36.1%) | 124 (36.2%) | 23 (35.9%) | .986 | |
| House makers | 34 (8.4%) | 29 (8.5%) | 5 (7.8%) | |||
| Retired | 41 (10.1%) | 36 (10.5%) | 5 (7.8%) | |||
| Self employed | 25 (6.1%) | 21 (6.1%) | 4 (6.3%) | |||
| Student | 133 (32.7%) | 111 (32.4%) | 22 (34.4%) | |||
| Unemployed | 27 (6.6%) | 22 (6.4%) | 5 (7.8%) | |||
| Personal habit | Alcohol | 53 (13.02%) | 44 (12.83%) | 9 (14.06%) | .788 | |
| Smoking | 41 (10.08%) | 34 (9.91%) | 7 (10.94%) | .803 | ||
| Both alcohol and smoking | 16 (3.93%) | 14 (4.08%) | 2 (3.1%) | .718 | ||
| Vaccine reactions | Present of side effect | Total | 302 (74.2%) | 261 (76.1%) | 41 (64.1%) | .043 |
| Beyond 3 days | 30 (7.4%) | 23 (6.7%) | 7 (10.9%) | .234 | ||
| Injection site pain | 211 (51.8%) | 180 (52.5%) | 31 (48.4%) | .553 | ||
| Fever | 209 (51.4%) | 187 (54.5%) | 22 (34.4%) | .003 | ||
| Myalgia | 152 (37.3%) | 134 (39.1%) | 18 (28.1%) | .097 | ||
| Headache | 86 (21.1%) | 68 (19.8%) | 18 (28.1%) | .135 | ||
| Chills | 93 (22.9%) | 90 (26.2%) | 3 (4.7%) | .000 | ||
| Nausea | 13 (3.2%) | 13 (3.8%) | 0 | .236 | ||
| Fainting sensation | 7 (1.7%) | 6 (1.7%) | 1 (1.6%) | .916 | ||
| Others | Medicine taken | 245 (60.25%) | 217 (63.3%) | 28 (43.8%) | .003 | |
| Leave taken | 118 (29%) | 105 (30.6%) | 13 (20.3%) | .095 | ||
In the study, 74.2% (302) of the individuals reported side effects from the vaccines, and 9.93% (30) of these participants experienced side effects that lasted longer than 3 days. The occurrence of side effects was statistically significantly different between AZD1222® and BBV152® (76.1% vs. 64.1%, P<0.05). However, there was no statistically significant difference between AZD1222® and BBV152® in the side effects that lasted longer than three days (6.7% vs. 10.9%, P>.05) (Table 1).
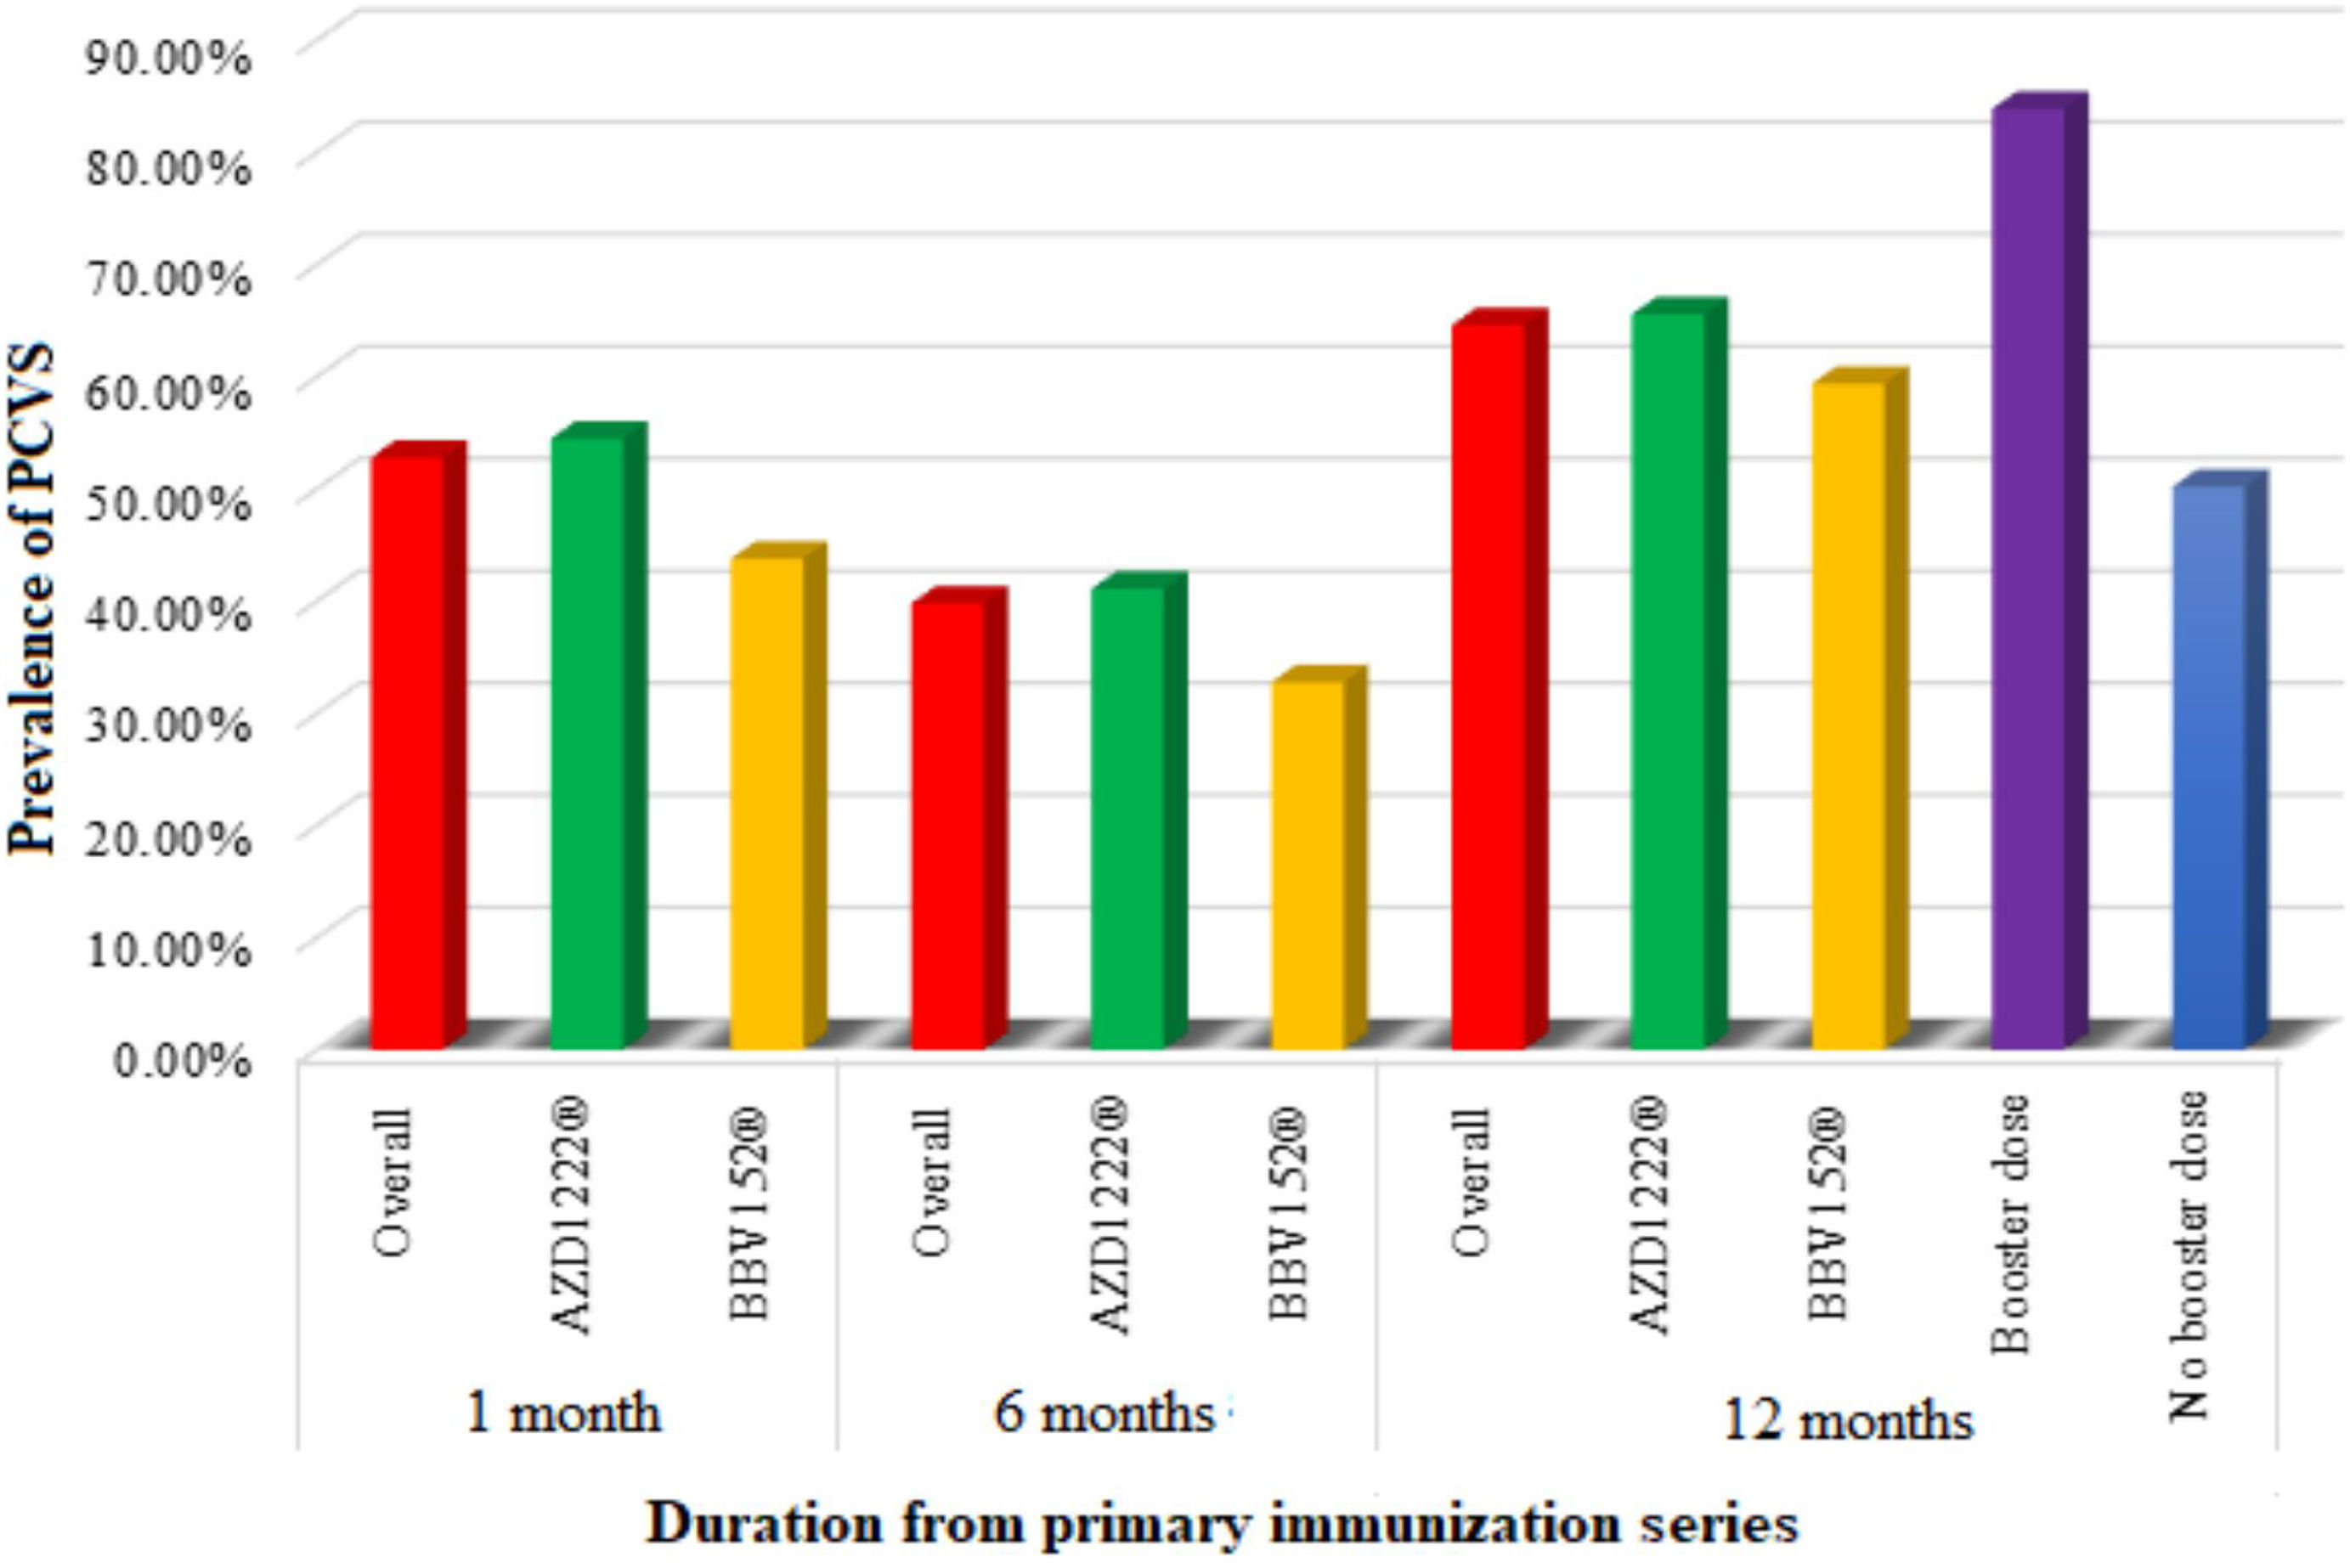
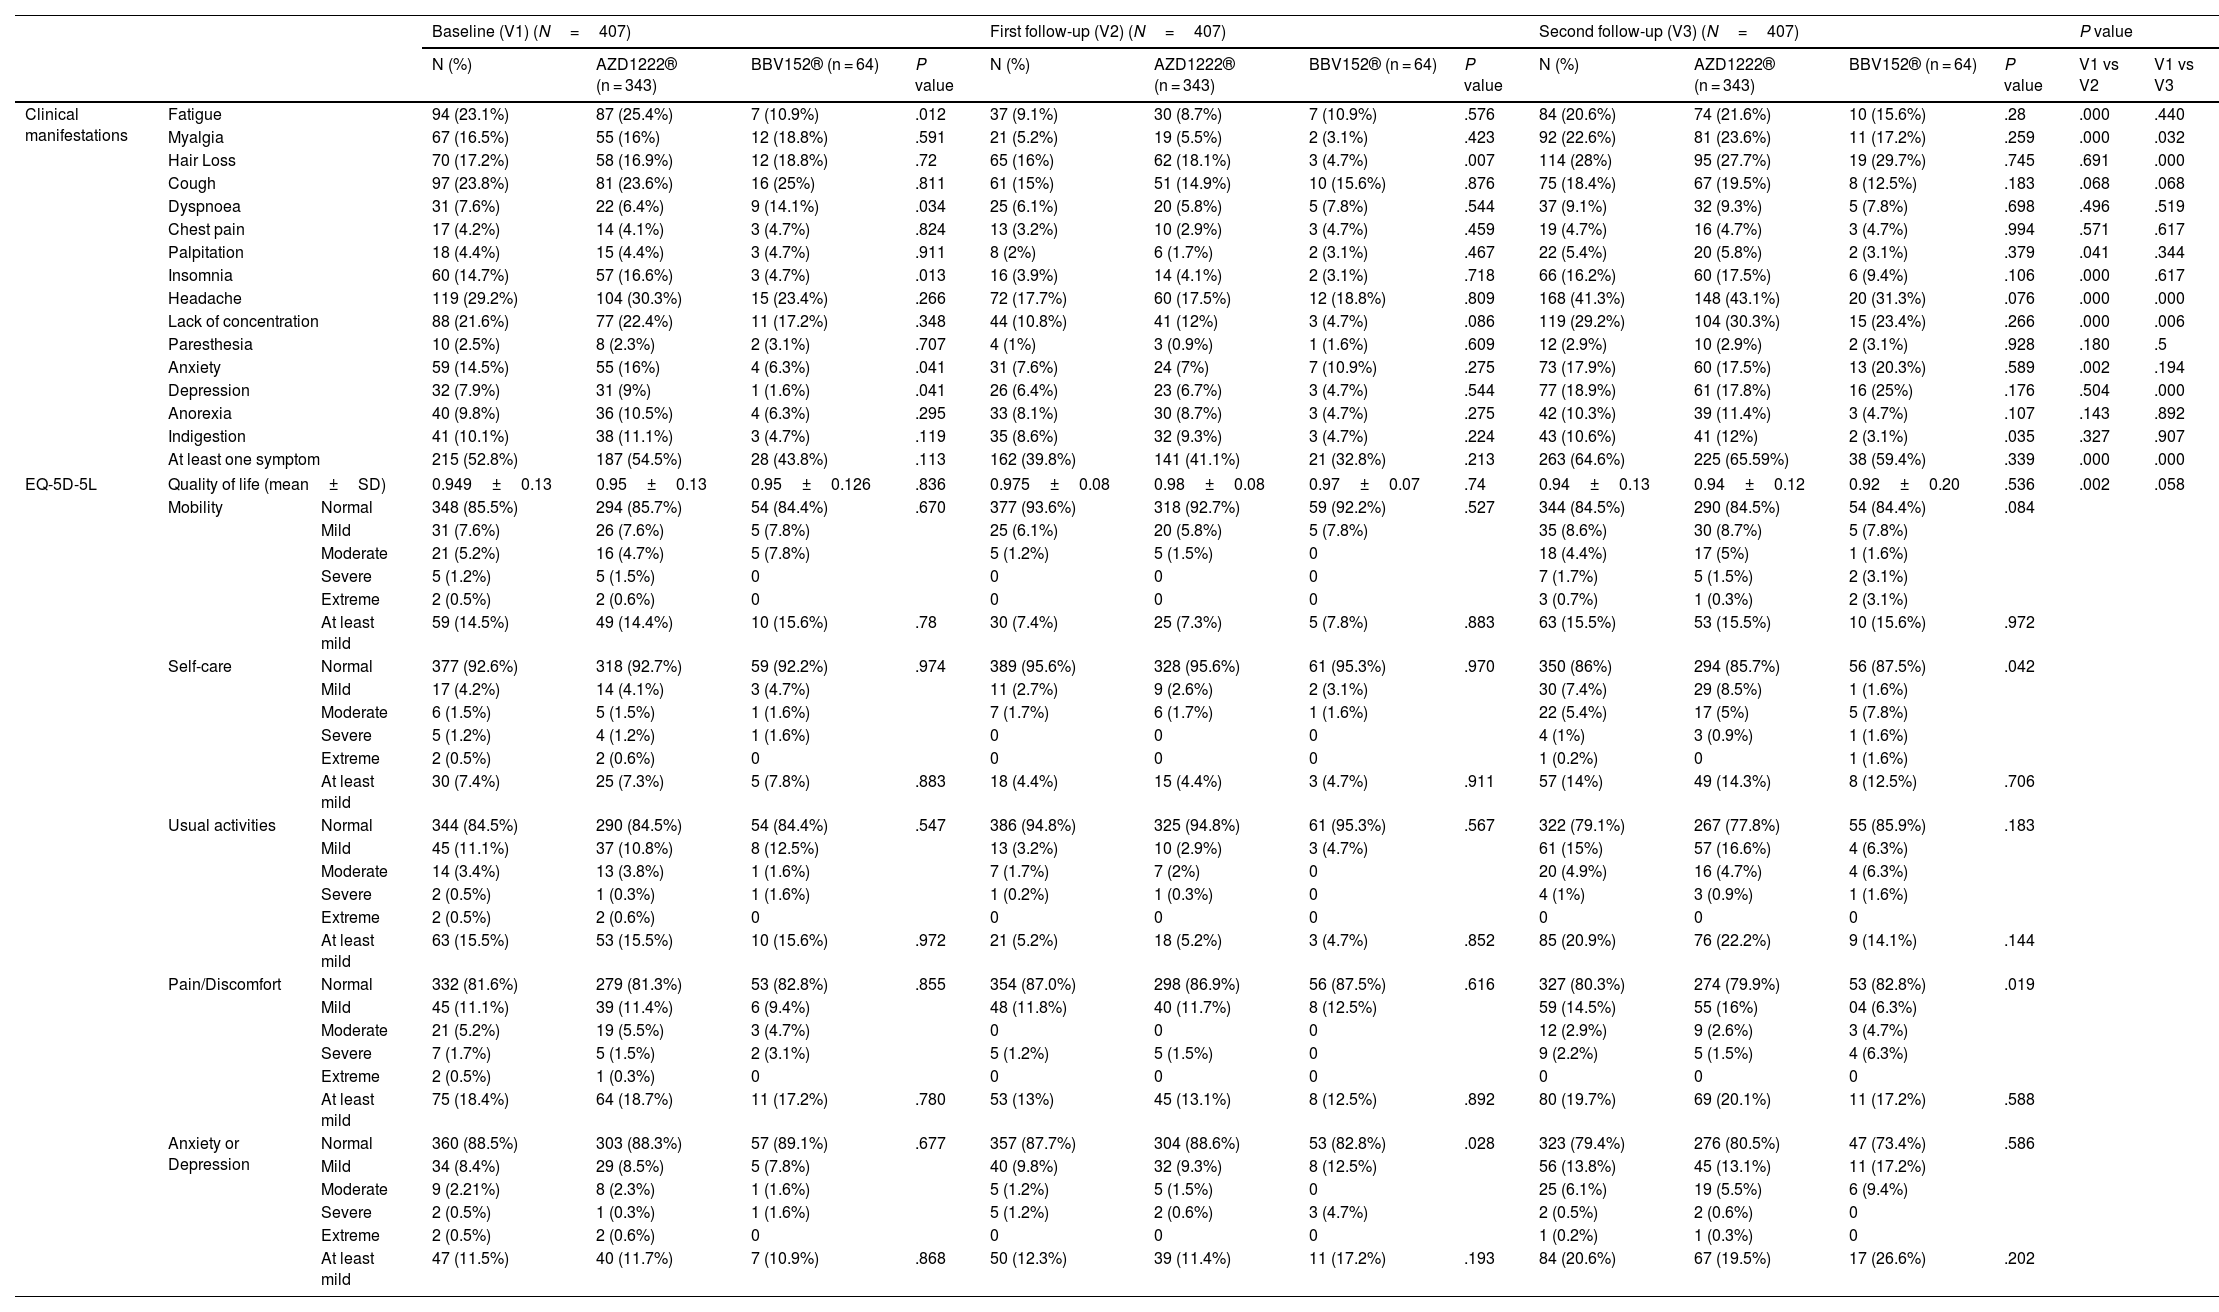
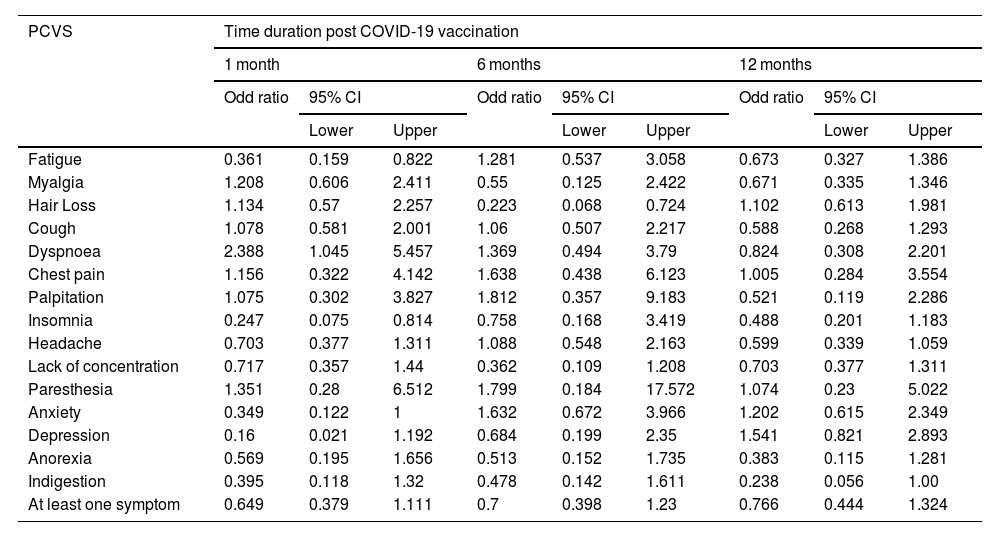
Prevalence of post-COVID-19 vaccination syndrome (PCVS)At baseline (a month after the primary immunization series), we found that 52.8% (215) of the total participants had at least 1 PCVS. Headaches were the most common complaint among participants (29.2%), followed by cough (23.8%), fatigue (23.1%), lack of concentration (21.6%), hair loss (17.2%), myalgia (16.5%), insomnia (14.7%), anxiety (14.5%), indigestion (10.1%), anorexia (9.8%), depression (7.9%), dyspnea (7.6%), palpitations (4.4%), chest discomfort (4.2%), and paresthesia (2.5%). There were statistically significant differences between AZD1222® and BBV152® in the presence of fatigue (5.4% vs. 10.9%, OR 0.361, 95% CI 0.159–0.822), dyspnea (6.4% vs. 14.1%, OR 2.388, 95% CI 1.045–5.457), insomnia (16.6% vs. 4.7%, OR 0.247, 95% CI 0.075–0.814), anxiety (16% vs. 6.3%, OR 0.349, 95% CI 0.122–1), and depression (9% vs. 1.6%, OR 0.16, 95% CI 0.021–1.192), (P<.05) (Tables 2, 3, Fig. 3).
Prevalence of post COVID-19 vaccination syndrome (PCVS) and the health-related quality of life of the study participants.
| Baseline (V1) (N=407) | First follow-up (V2) (N=407) | Second follow-up (V3) (N=407) | P value | |||||||||||||
|---|---|---|---|---|---|---|---|---|---|---|---|---|---|---|---|---|
| N (%) | AZD1222® (n = 343) | BBV152® (n = 64) | P value | N (%) | AZD1222® (n = 343) | BBV152® (n = 64) | P value | N (%) | AZD1222® (n = 343) | BBV152® (n = 64) | P value | V1 vs V2 | V1 vs V3 | |||
| Clinical manifestations | Fatigue | 94 (23.1%) | 87 (25.4%) | 7 (10.9%) | .012 | 37 (9.1%) | 30 (8.7%) | 7 (10.9%) | .576 | 84 (20.6%) | 74 (21.6%) | 10 (15.6%) | .28 | .000 | .440 | |
| Myalgia | 67 (16.5%) | 55 (16%) | 12 (18.8%) | .591 | 21 (5.2%) | 19 (5.5%) | 2 (3.1%) | .423 | 92 (22.6%) | 81 (23.6%) | 11 (17.2%) | .259 | .000 | .032 | ||
| Hair Loss | 70 (17.2%) | 58 (16.9%) | 12 (18.8%) | .72 | 65 (16%) | 62 (18.1%) | 3 (4.7%) | .007 | 114 (28%) | 95 (27.7%) | 19 (29.7%) | .745 | .691 | .000 | ||
| Cough | 97 (23.8%) | 81 (23.6%) | 16 (25%) | .811 | 61 (15%) | 51 (14.9%) | 10 (15.6%) | .876 | 75 (18.4%) | 67 (19.5%) | 8 (12.5%) | .183 | .068 | .068 | ||
| Dyspnoea | 31 (7.6%) | 22 (6.4%) | 9 (14.1%) | .034 | 25 (6.1%) | 20 (5.8%) | 5 (7.8%) | .544 | 37 (9.1%) | 32 (9.3%) | 5 (7.8%) | .698 | .496 | .519 | ||
| Chest pain | 17 (4.2%) | 14 (4.1%) | 3 (4.7%) | .824 | 13 (3.2%) | 10 (2.9%) | 3 (4.7%) | .459 | 19 (4.7%) | 16 (4.7%) | 3 (4.7%) | .994 | .571 | .617 | ||
| Palpitation | 18 (4.4%) | 15 (4.4%) | 3 (4.7%) | .911 | 8 (2%) | 6 (1.7%) | 2 (3.1%) | .467 | 22 (5.4%) | 20 (5.8%) | 2 (3.1%) | .379 | .041 | .344 | ||
| Insomnia | 60 (14.7%) | 57 (16.6%) | 3 (4.7%) | .013 | 16 (3.9%) | 14 (4.1%) | 2 (3.1%) | .718 | 66 (16.2%) | 60 (17.5%) | 6 (9.4%) | .106 | .000 | .617 | ||
| Headache | 119 (29.2%) | 104 (30.3%) | 15 (23.4%) | .266 | 72 (17.7%) | 60 (17.5%) | 12 (18.8%) | .809 | 168 (41.3%) | 148 (43.1%) | 20 (31.3%) | .076 | .000 | .000 | ||
| Lack of concentration | 88 (21.6%) | 77 (22.4%) | 11 (17.2%) | .348 | 44 (10.8%) | 41 (12%) | 3 (4.7%) | .086 | 119 (29.2%) | 104 (30.3%) | 15 (23.4%) | .266 | .000 | .006 | ||
| Paresthesia | 10 (2.5%) | 8 (2.3%) | 2 (3.1%) | .707 | 4 (1%) | 3 (0.9%) | 1 (1.6%) | .609 | 12 (2.9%) | 10 (2.9%) | 2 (3.1%) | .928 | .180 | .5 | ||
| Anxiety | 59 (14.5%) | 55 (16%) | 4 (6.3%) | .041 | 31 (7.6%) | 24 (7%) | 7 (10.9%) | .275 | 73 (17.9%) | 60 (17.5%) | 13 (20.3%) | .589 | .002 | .194 | ||
| Depression | 32 (7.9%) | 31 (9%) | 1 (1.6%) | .041 | 26 (6.4%) | 23 (6.7%) | 3 (4.7%) | .544 | 77 (18.9%) | 61 (17.8%) | 16 (25%) | .176 | .504 | .000 | ||
| Anorexia | 40 (9.8%) | 36 (10.5%) | 4 (6.3%) | .295 | 33 (8.1%) | 30 (8.7%) | 3 (4.7%) | .275 | 42 (10.3%) | 39 (11.4%) | 3 (4.7%) | .107 | .143 | .892 | ||
| Indigestion | 41 (10.1%) | 38 (11.1%) | 3 (4.7%) | .119 | 35 (8.6%) | 32 (9.3%) | 3 (4.7%) | .224 | 43 (10.6%) | 41 (12%) | 2 (3.1%) | .035 | .327 | .907 | ||
| At least one symptom | 215 (52.8%) | 187 (54.5%) | 28 (43.8%) | .113 | 162 (39.8%) | 141 (41.1%) | 21 (32.8%) | .213 | 263 (64.6%) | 225 (65.59%) | 38 (59.4%) | .339 | .000 | .000 | ||
| EQ-5D-5L | Quality of life (mean±SD) | 0.949±0.13 | 0.95±0.13 | 0.95±0.126 | .836 | 0.975±0.08 | 0.98±0.08 | 0.97±0.07 | .74 | 0.94±0.13 | 0.94±0.12 | 0.92±0.20 | .536 | .002 | .058 | |
| Mobility | Normal | 348 (85.5%) | 294 (85.7%) | 54 (84.4%) | .670 | 377 (93.6%) | 318 (92.7%) | 59 (92.2%) | .527 | 344 (84.5%) | 290 (84.5%) | 54 (84.4%) | .084 | |||
| Mild | 31 (7.6%) | 26 (7.6%) | 5 (7.8%) | 25 (6.1%) | 20 (5.8%) | 5 (7.8%) | 35 (8.6%) | 30 (8.7%) | 5 (7.8%) | |||||||
| Moderate | 21 (5.2%) | 16 (4.7%) | 5 (7.8%) | 5 (1.2%) | 5 (1.5%) | 0 | 18 (4.4%) | 17 (5%) | 1 (1.6%) | |||||||
| Severe | 5 (1.2%) | 5 (1.5%) | 0 | 0 | 0 | 0 | 7 (1.7%) | 5 (1.5%) | 2 (3.1%) | |||||||
| Extreme | 2 (0.5%) | 2 (0.6%) | 0 | 0 | 0 | 0 | 3 (0.7%) | 1 (0.3%) | 2 (3.1%) | |||||||
| At least mild | 59 (14.5%) | 49 (14.4%) | 10 (15.6%) | .78 | 30 (7.4%) | 25 (7.3%) | 5 (7.8%) | .883 | 63 (15.5%) | 53 (15.5%) | 10 (15.6%) | .972 | ||||
| Self-care | Normal | 377 (92.6%) | 318 (92.7%) | 59 (92.2%) | .974 | 389 (95.6%) | 328 (95.6%) | 61 (95.3%) | .970 | 350 (86%) | 294 (85.7%) | 56 (87.5%) | .042 | |||
| Mild | 17 (4.2%) | 14 (4.1%) | 3 (4.7%) | 11 (2.7%) | 9 (2.6%) | 2 (3.1%) | 30 (7.4%) | 29 (8.5%) | 1 (1.6%) | |||||||
| Moderate | 6 (1.5%) | 5 (1.5%) | 1 (1.6%) | 7 (1.7%) | 6 (1.7%) | 1 (1.6%) | 22 (5.4%) | 17 (5%) | 5 (7.8%) | |||||||
| Severe | 5 (1.2%) | 4 (1.2%) | 1 (1.6%) | 0 | 0 | 0 | 4 (1%) | 3 (0.9%) | 1 (1.6%) | |||||||
| Extreme | 2 (0.5%) | 2 (0.6%) | 0 | 0 | 0 | 0 | 1 (0.2%) | 0 | 1 (1.6%) | |||||||
| At least mild | 30 (7.4%) | 25 (7.3%) | 5 (7.8%) | .883 | 18 (4.4%) | 15 (4.4%) | 3 (4.7%) | .911 | 57 (14%) | 49 (14.3%) | 8 (12.5%) | .706 | ||||
| Usual activities | Normal | 344 (84.5%) | 290 (84.5%) | 54 (84.4%) | .547 | 386 (94.8%) | 325 (94.8%) | 61 (95.3%) | .567 | 322 (79.1%) | 267 (77.8%) | 55 (85.9%) | .183 | |||
| Mild | 45 (11.1%) | 37 (10.8%) | 8 (12.5%) | 13 (3.2%) | 10 (2.9%) | 3 (4.7%) | 61 (15%) | 57 (16.6%) | 4 (6.3%) | |||||||
| Moderate | 14 (3.4%) | 13 (3.8%) | 1 (1.6%) | 7 (1.7%) | 7 (2%) | 0 | 20 (4.9%) | 16 (4.7%) | 4 (6.3%) | |||||||
| Severe | 2 (0.5%) | 1 (0.3%) | 1 (1.6%) | 1 (0.2%) | 1 (0.3%) | 0 | 4 (1%) | 3 (0.9%) | 1 (1.6%) | |||||||
| Extreme | 2 (0.5%) | 2 (0.6%) | 0 | 0 | 0 | 0 | 0 | 0 | 0 | |||||||
| At least mild | 63 (15.5%) | 53 (15.5%) | 10 (15.6%) | .972 | 21 (5.2%) | 18 (5.2%) | 3 (4.7%) | .852 | 85 (20.9%) | 76 (22.2%) | 9 (14.1%) | .144 | ||||
| Pain/Discomfort | Normal | 332 (81.6%) | 279 (81.3%) | 53 (82.8%) | .855 | 354 (87.0%) | 298 (86.9%) | 56 (87.5%) | .616 | 327 (80.3%) | 274 (79.9%) | 53 (82.8%) | .019 | |||
| Mild | 45 (11.1%) | 39 (11.4%) | 6 (9.4%) | 48 (11.8%) | 40 (11.7%) | 8 (12.5%) | 59 (14.5%) | 55 (16%) | 04 (6.3%) | |||||||
| Moderate | 21 (5.2%) | 19 (5.5%) | 3 (4.7%) | 0 | 0 | 0 | 12 (2.9%) | 9 (2.6%) | 3 (4.7%) | |||||||
| Severe | 7 (1.7%) | 5 (1.5%) | 2 (3.1%) | 5 (1.2%) | 5 (1.5%) | 0 | 9 (2.2%) | 5 (1.5%) | 4 (6.3%) | |||||||
| Extreme | 2 (0.5%) | 1 (0.3%) | 0 | 0 | 0 | 0 | 0 | 0 | 0 | |||||||
| At least mild | 75 (18.4%) | 64 (18.7%) | 11 (17.2%) | .780 | 53 (13%) | 45 (13.1%) | 8 (12.5%) | .892 | 80 (19.7%) | 69 (20.1%) | 11 (17.2%) | .588 | ||||
| Anxiety or Depression | Normal | 360 (88.5%) | 303 (88.3%) | 57 (89.1%) | .677 | 357 (87.7%) | 304 (88.6%) | 53 (82.8%) | .028 | 323 (79.4%) | 276 (80.5%) | 47 (73.4%) | .586 | |||
| Mild | 34 (8.4%) | 29 (8.5%) | 5 (7.8%) | 40 (9.8%) | 32 (9.3%) | 8 (12.5%) | 56 (13.8%) | 45 (13.1%) | 11 (17.2%) | |||||||
| Moderate | 9 (2.21%) | 8 (2.3%) | 1 (1.6%) | 5 (1.2%) | 5 (1.5%) | 0 | 25 (6.1%) | 19 (5.5%) | 6 (9.4%) | |||||||
| Severe | 2 (0.5%) | 1 (0.3%) | 1 (1.6%) | 5 (1.2%) | 2 (0.6%) | 3 (4.7%) | 2 (0.5%) | 2 (0.6%) | 0 | |||||||
| Extreme | 2 (0.5%) | 2 (0.6%) | 0 | 0 | 0 | 0 | 1 (0.2%) | 1 (0.3%) | 0 | |||||||
| At least mild | 47 (11.5%) | 40 (11.7%) | 7 (10.9%) | .868 | 50 (12.3%) | 39 (11.4%) | 11 (17.2%) | .193 | 84 (20.6%) | 67 (19.5%) | 17 (26.6%) | .202 | ||||
Odd ratio by AZD1222®/ BBV152® for prevalence of PCVS at different follow visits after primary COVID-19 vaccination series.
| PCVS | Time duration post COVID-19 vaccination | ||||||||
|---|---|---|---|---|---|---|---|---|---|
| 1 month | 6 months | 12 months | |||||||
| Odd ratio | 95% CI | Odd ratio | 95% CI | Odd ratio | 95% CI | ||||
| Lower | Upper | Lower | Upper | Lower | Upper | ||||
| Fatigue | 0.361 | 0.159 | 0.822 | 1.281 | 0.537 | 3.058 | 0.673 | 0.327 | 1.386 |
| Myalgia | 1.208 | 0.606 | 2.411 | 0.55 | 0.125 | 2.422 | 0.671 | 0.335 | 1.346 |
| Hair Loss | 1.134 | 0.57 | 2.257 | 0.223 | 0.068 | 0.724 | 1.102 | 0.613 | 1.981 |
| Cough | 1.078 | 0.581 | 2.001 | 1.06 | 0.507 | 2.217 | 0.588 | 0.268 | 1.293 |
| Dyspnoea | 2.388 | 1.045 | 5.457 | 1.369 | 0.494 | 3.79 | 0.824 | 0.308 | 2.201 |
| Chest pain | 1.156 | 0.322 | 4.142 | 1.638 | 0.438 | 6.123 | 1.005 | 0.284 | 3.554 |
| Palpitation | 1.075 | 0.302 | 3.827 | 1.812 | 0.357 | 9.183 | 0.521 | 0.119 | 2.286 |
| Insomnia | 0.247 | 0.075 | 0.814 | 0.758 | 0.168 | 3.419 | 0.488 | 0.201 | 1.183 |
| Headache | 0.703 | 0.377 | 1.311 | 1.088 | 0.548 | 2.163 | 0.599 | 0.339 | 1.059 |
| Lack of concentration | 0.717 | 0.357 | 1.44 | 0.362 | 0.109 | 1.208 | 0.703 | 0.377 | 1.311 |
| Paresthesia | 1.351 | 0.28 | 6.512 | 1.799 | 0.184 | 17.572 | 1.074 | 0.23 | 5.022 |
| Anxiety | 0.349 | 0.122 | 1 | 1.632 | 0.672 | 3.966 | 1.202 | 0.615 | 2.349 |
| Depression | 0.16 | 0.021 | 1.192 | 0.684 | 0.199 | 2.35 | 1.541 | 0.821 | 2.893 |
| Anorexia | 0.569 | 0.195 | 1.656 | 0.513 | 0.152 | 1.735 | 0.383 | 0.115 | 1.281 |
| Indigestion | 0.395 | 0.118 | 1.32 | 0.478 | 0.142 | 1.611 | 0.238 | 0.056 | 1.00 |
| At least one symptom | 0.649 | 0.379 | 1.111 | 0.7 | 0.398 | 1.23 | 0.766 | 0.444 | 1.324 |

After 6 months of post-vaccination (the first follow-up), we found that 39.8% (162) of the total participants had at least 1 PCVS. Headaches were the most common complaint among participants (17.7%), followed by cough (15%), hair loss (16%), lack of concentration (10.8%), fatigue (9.1%), indigestion (8.6%), anorexia (8.1%), anxiety (7.6%), depression (6.4%), dyspnea (6.1%), myalgia (5.2%), insomnia (3.9%), chest discomfort (3.2%), palpitations (2%), and paresthesia (1%). There were statistically significant differences between AZD1222® and BBV152® in the presence of hair loss (18.1% vs. 4.7%, OR 0.223, 95% CI 0.068–0.724) (P<.05) (Tables 2, 3, Fig. 3.).
After 12 months of post-vaccination (second follow-up), we found that 64.6% (263) of the total participants had at least 1 PCVS. Headaches were the most common complaint among participants (41.30%), followed by lack of concentration (29.20%), hair loss (28%), myalgia (22.6%), fatigue (20.60%), depression (18.90%), cough (18.40%), anxiety (17.90%), insomnia (16.20%), indigestion (10.60%), anorexia (10.30%), dyspnea (9.1%), palpitations (5.40%), chest discomfort (4.70%), and paresthesia (2.90%). There were statistically significant differences between AZD1222® and BBV152® in the presence of indigestion (12% vs. 3.1%, OR 0.238, 95% CI 0.056–1) (P<.05) (Tables 2, 3, Fig. 3.).
Comparison of PCVS between at a month, 6 months, and 12 months post-vaccinationThe prevalence of PCVS decreased from 52.8% to 39.8% at 1 month to 6 months post-vaccination (P<.001). There were statistically significant differences in the prevalence of fatigue (23.1% vs. 9.1%), myalgia (16.5% vs. 5.2%), palpitation (4.4% vs. 2%), insomnia (14.7% vs. 3.9%), headache (29.2% vs. 17.7%), lack of concentration (21.6% vs. 10.8%), and anxiety (14.5% vs. 7.6%) between 1 month and 6 months post-vaccination (P<.05). The prevalence of PCVS increased from 52.8% to 64.6% from 1 month to 12 months post-vaccination (P<.001). There were statistically significant differences in the prevalence of myalgia (16.5% vs. 22.6%), hair loss (17.2% vs. 28%), headache (29.2% vs. 41.3%), and depression (7.9% vs. 18.9%) between 1 month and 12 months post-vaccination (P<.05) (Table 2, Fig. 3).
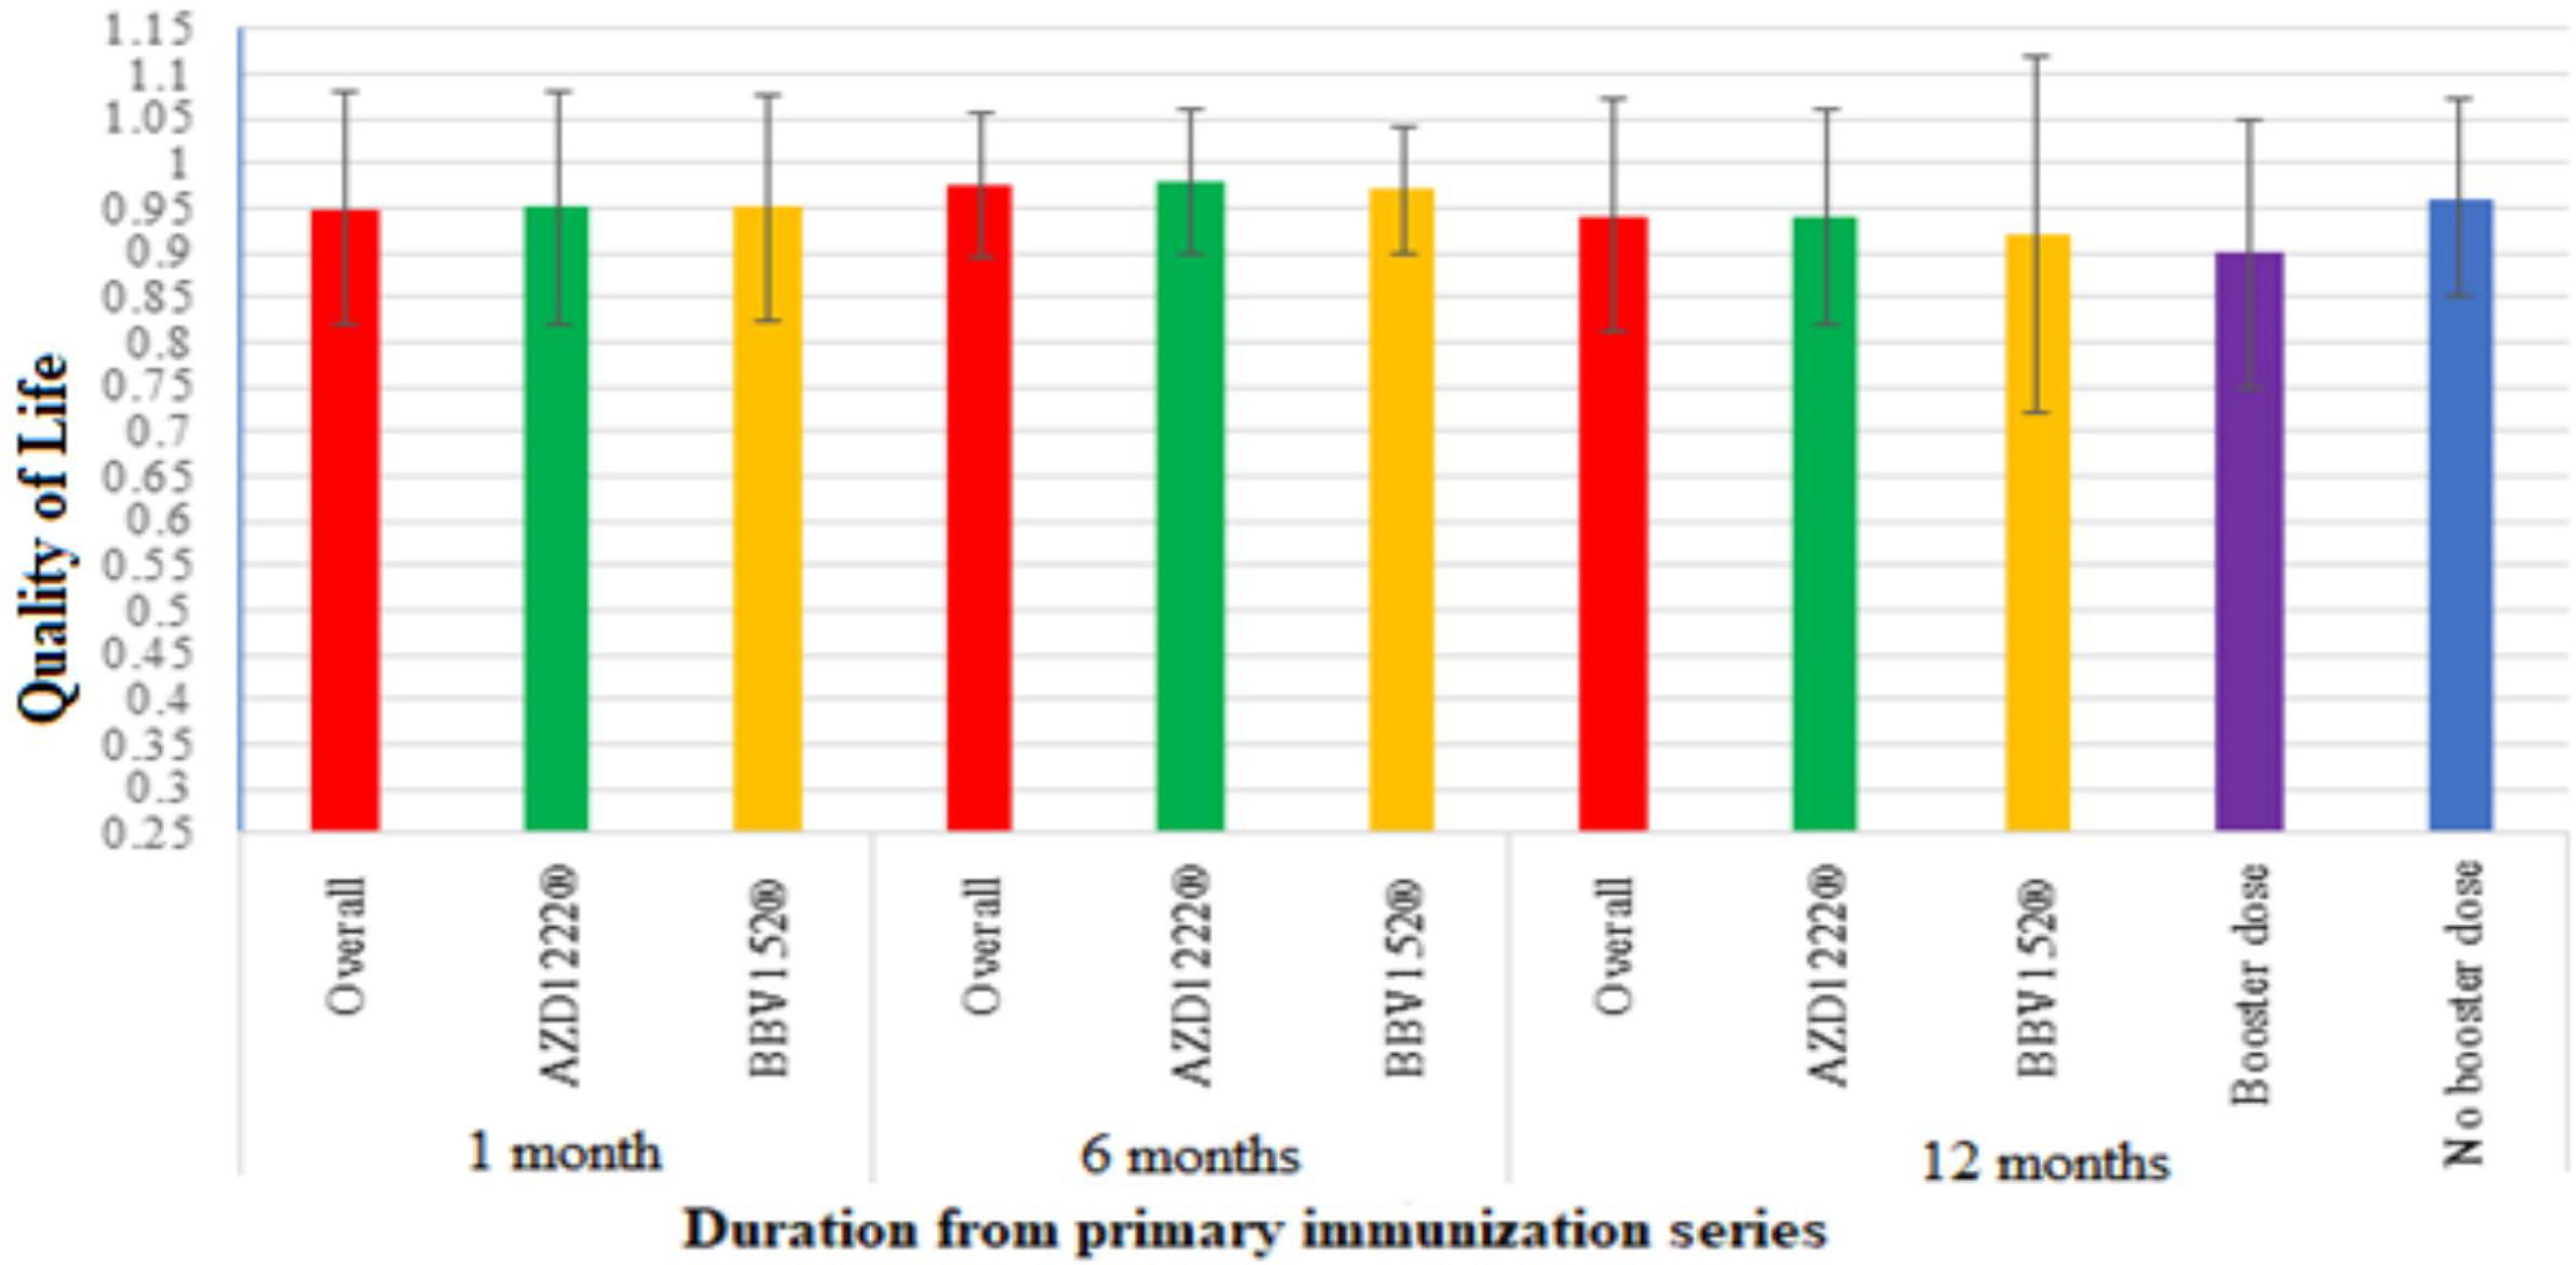
The quality of life (QoL) among vaccinated participantsThe quality of life was assessed using the EQ-5D-5L questionnaire. A month after the primary vaccination series, out of the total participants, there were at least mild problems with mobility in 14.5% (59), self-care in 7.4% (30), usual activity in 15.5% (63), pain or discomfort in 18.4% (75), and anxiety or depression in 12.3% (50) of the participants. The average QoL of the participants was 0.949±0.13 out of 1. There were no statistically significant differences in the QoL between AZD1222® and BBV152® (0.95±0.13 vs. 0.95±0.12, P>.05) at baseline (Table 2).
After 6 months of post-vaccination, there were at least mild problems with mobility in 7.4% (30), self-care in 4.4% (18), usual activity in 5.2% (21), pain or discomfort in 13% (53), and anxiety or depression in 11.5% (47) of the total participants. The average QoL of the participants was 0.975±0.08 out of 1. There were no statistically significant differences in the QoL between AZD1222® and BBV152® (0.98±0.08 vs. 0.97±0.7, P>.05) (Table 2).
After 12 months of post-vaccination, there were at least mild problems with mobility in 63 (15.5%), self-care in 57 (14%), usual activity in 85 (20.9%), pain or discomfort in 80 (19.7%), and anxiety or depression in 84 (20.6%) of the total participants. The average QoL of the participants was 0.94±0.13 out of 1. There were no statistically significant differences in the QoL between AZD1222® and BBV152® (0.94±0.12 vs. 0.92±0.20, P>.05) (Table 2).
Participants' QoL improved 6 months after the vaccination, with a mean score 0.974±0.082 compared to 0.949±0.13 at a month post-vaccination. Though it was lower than both the 1-month and 6-month post-vaccination scores, the mean score modestly dropped over the course of the 12 months to 0.936±13.4. The QoL score showed a statistically significant difference between 1 month and 6 months after vaccination (P<.005), and no significant difference between 1 month and 6 months after vaccination (P>.058) (Table 2, Fig. 4).
PCVS in those who received a booster shot
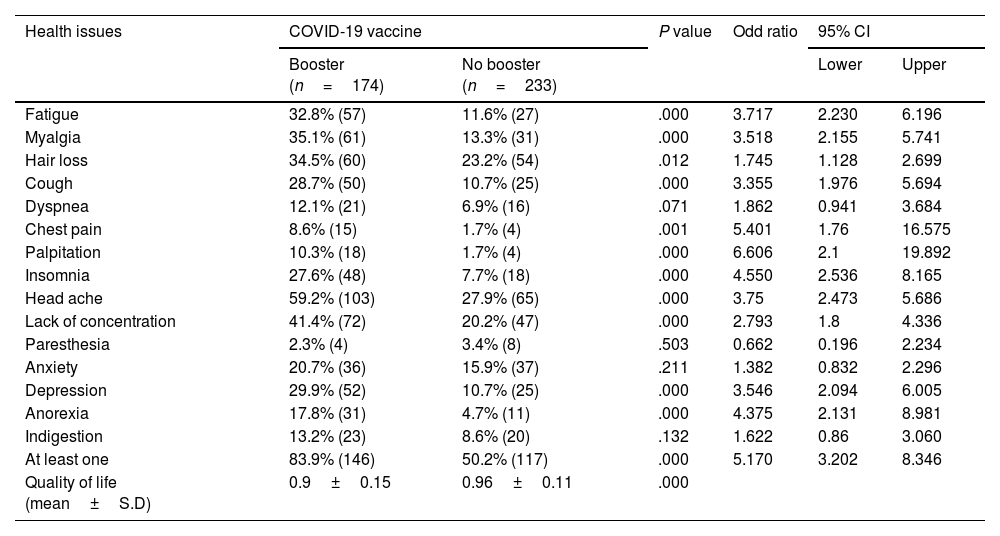
We observed that 42.75% (174) of the total participants had received a booster dose of the vaccine at 12 months post-vaccination. The prevalence of PCVS in booster dose received participants was 5.17-fold higher than in those who did not receive booster dose was 50.2% (83.9% vs. 50.2%, and 95% CI 3.202–8.346). In comparison with those who did not receive a booster shot, the presence of PCVS was statistically significant in fatigue (32.8% vs. 11.6%, OR 3.717, P<.001), myalgia (35.1% vs. 13.3%, OR 3.518, P<.001), hair loss (34.5% vs. 23.2%, OR 1.745 P<.05), cough (28.7% vs. 10.7%, OR 3.355, P<.001), chest pain (8.6% vs. 1.7%, OR 5.401, P<.05), palpitation (10.3% vs. 1.7%, OR 6.606, P<.001), insomnia (27.6% vs. 7.7%, OR 4.55, P<.001), headache (59.2% vs. 27.9%, OR 3.75, P<.001), lack of concentration (41.4% vs. 20.2%, OR 2.793, P<.001), depression (29.9% vs. 10.7%, OR 3.546, P<.001), and anorexia (17.8% vs. 4.7%, OR 4.375, P<.001). However, there were no statistically significant differences in dyspnea (12.1% vs. 6.9%, OR 1.862, P>.05), paresthesia (2.3% vs. 3.4%, OR 0.662, P>.05), or indigestion (13.2% vs. 8.6%, OR 1.622, P>.05) (Table 4, Fig. 3). QoL was significantly lower in those who received a booster dose of COVID-19 vaccination than in those who did not receive a booster dose (0.9±0.15 vs. 0.96±0.11, P<.001).
Prevalence of PCVS and health-related quality of life of those who received booster dose and those who did not receive booster dose of COVID-19 vaccine.
| Health issues | COVID-19 vaccine | P value | Odd ratio | 95% CI | ||
|---|---|---|---|---|---|---|
| Booster (n=174) | No booster (n=233) | |||||
| Lower | Upper | |||||
| Fatigue | 32.8% (57) | 11.6% (27) | .000 | 3.717 | 2.230 | 6.196 |
| Myalgia | 35.1% (61) | 13.3% (31) | .000 | 3.518 | 2.155 | 5.741 |
| Hair loss | 34.5% (60) | 23.2% (54) | .012 | 1.745 | 1.128 | 2.699 |
| Cough | 28.7% (50) | 10.7% (25) | .000 | 3.355 | 1.976 | 5.694 |
| Dyspnea | 12.1% (21) | 6.9% (16) | .071 | 1.862 | 0.941 | 3.684 |
| Chest pain | 8.6% (15) | 1.7% (4) | .001 | 5.401 | 1.76 | 16.575 |
| Palpitation | 10.3% (18) | 1.7% (4) | .000 | 6.606 | 2.1 | 19.892 |
| Insomnia | 27.6% (48) | 7.7% (18) | .000 | 4.550 | 2.536 | 8.165 |
| Head ache | 59.2% (103) | 27.9% (65) | .000 | 3.75 | 2.473 | 5.686 |
| Lack of concentration | 41.4% (72) | 20.2% (47) | .000 | 2.793 | 1.8 | 4.336 |
| Paresthesia | 2.3% (4) | 3.4% (8) | .503 | 0.662 | 0.196 | 2.234 |
| Anxiety | 20.7% (36) | 15.9% (37) | .211 | 1.382 | 0.832 | 2.296 |
| Depression | 29.9% (52) | 10.7% (25) | .000 | 3.546 | 2.094 | 6.005 |
| Anorexia | 17.8% (31) | 4.7% (11) | .000 | 4.375 | 2.131 | 8.981 |
| Indigestion | 13.2% (23) | 8.6% (20) | .132 | 1.622 | 0.86 | 3.060 |
| At least one | 83.9% (146) | 50.2% (117) | .000 | 5.170 | 3.202 | 8.346 |
| Quality of life (mean±S.D) | 0.9±0.15 | 0.96±0.11 | .000 | |||
In the study, we observed the presence of PCVS in individuals who had been vaccinated against COVID-19. In comparison to the prevalence observed 1 month after vaccination, there was a decrease in prevalence at 6 months post-vaccination, followed by an increase at 12 months post-vaccination. When compared to 1 month after receiving the COVID-19 vaccine, the QoL of those who received it improved at 6 months post-vaccination. However, it declined a year after the vaccinations. We observed a higher prevalence of long-term detrimental health effects when comparing the findings of our investigation with those reported by Shrestha et al.30 This variation might be attributed to the current study's focus on a wider variety of clinical symptoms. Riad et al. and Klugar et al. both reported that side effects from the COVID-19 immunization persisted more than a month after receiving it.32,33 However, it is essential to highlight that the frequency of these effects was substantially lower in both studies since investigations focused solely on the persistence of acute side effects. In a case report by Finsterer et al., vaccinated individuals developed a long post-COVID vaccination syndrome 11 months after their initial vaccination and shortly after their booster shot.34 Similarly, in a case series reported by Finterer et al., both patients received booster doses of the COVID-19 vaccine and, 6 months following the second shot, experienced a lengthy post-COVID vaccination syndrome.35 The symptoms similar to those in this study include fatigue,34,35 headaches,34,35 impaired concentration,34 sleep disturbance,34,35 numbness in the hands,34 palpitations,35 and tiredness.34,35 This supports our belief that the COVID-19 vaccine may have long-term inverse effects. In the study, we have used two different COVID-19 vaccines, i.e., AZD1222® and BBV152®. Compared to AZD1222® at a month post-vaccination, the prevalence of depression (9% vs. 1.6%, OR 0.16, 95% CI 0.021–1.192), anxiety (16% vs. 6.3%, OR 0.349, 95% CI 0.122–1), and insomnia (16.6% vs. 4.7%, OR 0.247, 95% CI 0.075–0.814) was lower, and the prevalence of dyspnea (6.4% vs. 14.1%, OR 2.388, 95% CI 1.045–5.457) was higher in BBV152® vaccinated individuals. At 6 months post-vaccination, the prevalence of hair loss was higher in BBV152® compared to AZD1222®-vaccinated individuals (18.1% vs. 4.7%, OR 0.223, 95% CI 0.068–0.724). At 12 months post-vaccination, the prevalence of indigestion seems to be higher in BBV152® compared to AZD1222® (12% vs. 3.1%, OR 0.238, 95% CI 0.056–1). The overall prevalence of PCVS throughout the study duration seems to be higher in AZD1222®-vaccinated individuals than in BBV152®-vaccinated individuals. However, there was no statistically significant difference between AZD1222® and BBV152® individuals, which indicates no difference in the prevalence of PCVS among them (Tables 2, 3).
Individuals who received the COVID-19 vaccine and had side effects were found to have autoantibodies.34–42 The antibodies against the spike protein were increased during the symptom's progression, as reported, and in the same report, the author found the normal level of antibodies against the N-protein,34,35 which increased the possibility of a causal relationship between the autoantibodies and the PCVS. In the study, we observed that 52.8% of individuals had at least 1 PCVS symptom a month following vaccination. The percentage decreased to 39.8% at the 6-month mark and increased to 64.6% after 12 months following the vaccination. It might be due to the fluctuations in the antibodies caused by the booster dose of the COVID-19 vaccination. The decrease in post-COVID-19 vaccination syndrome prevalence at 6 months may be attributed to the decline in neutralizing antibodies brought on by COVID-19 vaccination.4,30,43 The vaccine-induced maximal protection against severe COVID-19 starts to decline after 6 months from the first immunization series. To fully or partially restore maximum protection, the World Health Organization (WHO) recommends administering booster doses.4,43 During the initial phase of the study period, the Government of India recommended a booster dose after 39 weeks from the completion of the primary series.44 On the other hand, the rise in post-COVID-19 vaccination syndrome prevalence at 12 months may be related to the increase in neutralizing antibodies brought on by the booster COVID-19 vaccination. The study found a higher prevalence of PCVS in those who received booster doses compared to those who did not receive booster doses. Specifically, PCVS higher prevalent in booster dose receiver include, fatigue (32.8% vs. 11.6%, OR 3.717, 95% CI 2.230, P<.001), myalgia (35.1% vs. 13.3%, OR 3.518, 95% CI 2.155–5.741, P<.001), hair loss (34.5% vs. 23.2%, OR 1.745, 95% CI 1.128–2.699, P<.05), cough (28.7% vs. 10.7%, OR 3.355, 95% CI 1.976–5.694, P<.001), chest pain (8.6% vs. 1.7%, OR 5.401, 95% CI 1.76–16.575, P<.05), palpitation (10.3% vs. 1.7%, OR 6.606, 95% CI 2.1–19.892, P<.001), insomnia (27.6% vs. 7.7%, OR 4.55, 95% CI 2.536–8.165, P<.001), headache (59.2% vs. 27.9%, OR 3.75, 95% CI 2.473–5.686, P<.001), lack of concentration (41.4% vs. 20.2%, OR 2.793, 95% CI 1.8–4.336, P<.001), depression (29.9% vs. 10.7%, OR 3.546, 95% CI 2.094–6.005 P<.001), and anorexia (17.8% vs. 4.7%, OR 4.375, 95% CI 2.131–8.981, P<.001) (Table 4). These results suggest that individuals who received a booster dose were more likely to experience these symptoms compared to those who did not receive a booster dose. Contrary to the prevalence of PCVS, quality of life at 1 month after the immunization increased at 6 months and dropped at 12 months (Table 2). It draws attention to the detrimental effects of post-COVID-19 vaccination syndrome prevalence on quality of life.
The nature of the identified PCVS was mild to moderate in severity. The individuals were referred to the treating physician for suggestions and consultation. The strength of our study is that individuals with comorbidities were excluded, reducing the chance of symptom overlap for PCVS. We have measured the presence of other clinical manifestations other than the continuation of acute side effects. One of the limitations of the study was that we only relied on self-reported COVID-19 positives to exclude them from the study. The finding would be more precise if we were able to perform a COVID-19 test on participants who had developed similar symptoms of COVID-19 during the study duration. Another limitation was being unable to perform the biochemical test (blood test). It would have helped in the early detection of any changes in the test parameters, which would have helped in the formation of a rehabilitation strategy to combat the PCVS.
ConclusionIn the study, we observed the prevalence of PCVS which was similar to long-term COVID. In the month following the primary COVID-19 vaccination series, 52.8% of individuals had at least one PCVS. The percentage decreased to 39.8% at the 6-month mark and increased to 64.6% after 12 months following the COVID-19 vaccination. Contrary to the prevalence of PCVS, quality of life at 1 month after the immunization increased at 6 months and dropped at 12 months. There is no difference in the prevalence of PCVS and the quality of life between AZD1222® and BBV152®. The prevalence of PCVS seems to be higher, and the quality of life decreased in those who received booster doses.
During the preparation of this work, we used ChatGPT (OpenAI) to improve the language and readability of the manuscript, with caution. After using this tool/service, we reviewed and edited the content as needed and take(s) full responsibility for the content of the publication.
FundingThis study was supported by the Indian Council of Medical Research [No. CTU/Fellowship/04/2022-ECD-II].
Ethical ClearanceThe study was approved by the Intuitional Ethics Committee of Adichunchanagiri Hospital and Research Centre (Approved No. IEC/AH & RC/022/2021). The study has been registered with the Clinical Trials Registry of India (CTRI) with the number CTRI/2021/08/035660.
Author's ContributionYS = Conceptualization, reviewing literature, designing study, data curation, data analysis and interpretation, and writing main manuscript.
RV = Conceptualization, supervision, resources, and reviewing final manuscript.
Conflict of interestThe authors of this article confirm that they have identified no financial or interpersonal conflicts that might have affected the study results reported in this paper.
We would like to thank Dr. B Ramesh, Dean & Principal of Sri Adichunchanagiri College of Pharmacy, and Dr. M. G. Shivaramu, Principal of Adichunchanagiri Institute of Medical Sciences, for fostering an environment that made it possible to carry out this study.
Supplementary material 1
Supplementary material 2