


Vaccines are administered worldwide to control on-going coronavirus disease-19 (COVID-19) pandemic caused by SARS-CoV-2. Vaccine efficacy is largely contributed by the epitopes present on the viral proteins and their alteration might help emerging variants to escape host immune surveillance. Therefore, this study was designed to study SARS-CoV-2 Nsp13 protein, its epitopes and evolution.
MethodsClustal Omega was used to identify mutations in Nsp13 protein. Secondary structure and disorder score was predicted by CFSSP and PONDR-VSL2 webservers. Protein stability was predicted by DynaMut webserver. B cell epitopes were predicted by IEDB DiscoTope 2.0 tools and their 3D structures were represented by discovery studio. Antigenicity and allergenicity of epitopes were predicted by Vaxijen2.0 and AllergenFPv.1.0. Physiochemical properties of epitopes were predicted by Toxinpred, HLP webserver tool.
ResultsOur data revealed 182 mutations in Nsp13 among Indian SARS-CoV-2 isolates, which were characterised by secondary structure and per-residue disorderness, stability and dynamicity predictions. To correlate the functional impact of these mutations, we characterised the most prominent B cell and T cell epitopes contributed by Nsp13. Our data revealed twenty-one epitopes, which exhibited antigenicity, stability and interactions with MHC class-I and class-II molecules. Subsequently, the physiochemical properties of these epitopes were analysed. Furthermore, eighteen mutations reside in these Nsp13 epitopes.
ConclusionsWe report appearance of eighteen mutations in the predicted twenty-one epitopes of Nsp13. Among these, at least seven epitopes closely matches with the functionally validated epitopes. Altogether, our study shows the pattern of evolution of Nsp13 epitopes and their probable implications.
Las vacunas se administran a nivel mundial para controlar la pandemia en curso de la enfermedad por coronavirus de 2019 (COVID-19) causada por SARS-CoV-2. A la eficacia de la vacuna contribuyen ampliamente los epítopes presentes en las proteínas virales, y su alteración puede contribuir a que las variantes emergentes se escapen de la vigilancia inmunológica del huésped. Por tanto, este estudio fue diseñado para estudiar la proteína Nsp13 de SARS-CoV-2, sus epítopes y su evolución.
MétodosSe utilizó Clustal Omega para identificar las mutaciones de la proteína Nsp13. La estructura secundaria y la tasa de desorden se predijeron mediante los servidores web CFSSP y PONDR-VSL2. La estabilidad de la proteína fue predicha mediante el servidor web DynaMut. Los epítopes de las células B fueron predichos mediante las herramientas DiscoTope 2.0 de IEDB, y sus estructuras en 3D fueron representadas mediante Discovery Studio.
La antigenicidad y alergenicidad de los epítopes fueron predichas mediante Vaxijen2.0 y AlergenFPv.1.0. Las propiedades fisioquímicas de los epítopes fueron predichas mediante Toxinpred, la herramienta del servidor web HLP.
ResultadosNuestros datos revelaron 182 mutaciones en Nsp13 entre los aislados indios de SARS-CoV-2, que fueron caracterizadas mediante las predicciones de la estructura secundaria y la capacidad de desorden por residuo, la estabilidad y la dinamicidad. Para correlacionar el impacto funcional de estas mutaciones, caracterizamos los epítopes más prominentes de las células B y las células T a los que contribuyó Nsp13. Nuestros datos revelaron veintiún epítopes, que exhibieron antigenicidad, estabilidad e interacciones con las moléculas MHC de clase I y clase II. Seguidamente se analizaron las propiedades fisioquímicas de estos epítopes. Además, en estos epítopes de Nsp13 residen ocho mutaciones.
ConclusionesReportamos el aspecto de ocho mutaciones en los veintiún epítopes de Nsp13 predichos. Entre estos, al menos siete epítopes concuerdan estrechamente con los epítopes funcionalmente validados. En su conjunto, nuestro estudio refleja el patrón evolutivo de los epítopes de Nsp13 y sus implicaciones probables.
The coronavirus disease 2019 (COVID-19) disease was first reported from Wuhan province, China in the late 2019.1–3 The causative agent of this disease was identified as Severe Acute Respiratory Syndrome-Corona Virus-2 (SARS-CoV-2), which shares considerable similarity with previously known coronavirus, SARS-CoV.4 Coronaviruses are a group of RNA viruses, which can infect diverse animals, including humans.5 Earlier reports have shown that at least six different coronaviruses are known to infect humans, including CoV-229E, CoV-OC43, CoV-NL63, CoV-HKU1, SARS-CoV, and MERS-CoV.6 Four of them do not cause any serious health implication on humans including CoV-229E, CoV-OC43, CoV-NL63, and CoV-HKU1 but serious respiratory issues have been linked to SARS-CoV and MERS-CoV infection.7 The SARS-CoV-2 is the seventh coronavirus to infect humans and also causes mild to severe respiratory illness in the infected individuals and reported to cause severe symptoms in immune-compromised patients. The SARS-CoV-2 rapidly spread worldwide within a few months and become one of the worst pandemic ever reported in human history.8 Still this virus is spreading and already triggered second and third wave of infections in several countries. More than 671 million cases of COVID-19 have been reported worldwide with approx 6.72 million deaths till 15th Jan 2023.
SARS-CoV-2 genome is comprised of a positive sense single stranded RNA of approximately 29 kb.9 Its genome encodes four structural, sixteen non-structural and nine accessory proteins.10 The non-structural proteins (NSPs) are involved in the maintenance of functional integrity of the virus and also required for infection and virus particle formation. The NSPs including RNA helicase Nsp13, the primase (Nsp8) and RNA-dependent RNA polymerase RdRp (Nsp12) are present in a complex known as replication and transcription complex (RTC) that mediates an essential role in the completion of virus life cycle. Numerous RNA viruses have been found to encode their own RNA helicases, which are usually indispensable components of the RNA replication complexes11,12 and recognised as an ideal targets for developing antivirals.13 Nsp13, an RNA helicase, plays an important role in the folding of its RNA elements or unwinding of double stranded RNAs. Previous studies have shown that SARS-CoV Nsp13 has an NTPase and helicase activity belonging to helicase superfamily-1.14 The SARS-CoV-2 Nsp13 helicase shares a 99.8% sequence identity to SARS-CoV (SARS) Nsp13 helicase.15 Nsp13 helicase is a critical component for viral replication and shares the highest sequence conservation across the CoV family, highlighting their importance for viral viability. RNA dependent RNA polymerase (RdRp) and Nsp13 are required for viral replication, therefore, both of these vital enzymes represent a promising target for anti-SARS-CoV-2 drug development.16 Apart from helicase activity, NSP13 also possesses RNA 5′ triphosphatase activity and mediates the processing of viral 5’ mRNA.17 More importantly, the inhibition of NSP13 activity by pharmacological agents drastically reduces the viral replication indicating its role in viral life-cycle.18,19
NSP13 has been reported to act as an important modulator of host immune response. A study revealed that the presence of NSP13 reduces the expression as well as nuclear translocation of NF-kB.20 Another study shows that Nsp13 interacts with TLE1, a known NF-κB signalling interactor21 to target this signalling. Furthermore, NSP13 also supresses IFN-1 signalling by inhibiting STAT1/2 phosphorylation and nuclear translocation.22 Moreover, NSP13 also targets host deubiquitinase USP13 to counteract host antiviral immune response.23 Altogether, it seems that NSP13 possesses a strong immune activity that has been substantiated by mutagenesis studies. Several NSP13 mutants including P77L, Q88H, D260Y, E341D, and M429I, present in different variants of SARS-CoV-2 exhibits evasion from host immune response.24 Therefore, it is possible that with the evolution of SARS-CoV-2 variants more immune evading mutants will appear in near future.
With the appearance of new variants and their ability to evade immune system of host prompted us to carry out this study. In order to understand the host response towards SARS-CoV-2, we performed in-silico study to characterise Nsp13 protein. In silico methods are fast, reliable, and has very low-cost. The epitope predictions help us to target specific areas of the proteins for wet-lab based experiments and save a lot of time. Thus, in silico methods can be effective way to accelerate the understanding of virus evolution and host immune response. Several recent studies have been conducted to predict SARS-CoV-2 epitopes by immunoinformatics approaches.25–28 In this study, we used bioinformatic tools to predict potential epitopes of Nsp13 and characterised them by analysing immunological parameters. Further, we systematically characterised the mutations in Nsp13 reported from India and their impacts on epitopes are discussed.
Materials and methodsRetrieval of Nsp13 mutations among Indian SARS-CoV-2 isolatesWe used freely accessible CoVal database (https://coval.ccpem.ac.uk/) to retrieve mutations of SARS-CoV-2 reported from India as described earlier.29 CoVal database has been recently developed and serve as a repository of amino acid replacement mutations identified in the SARS-CoV-2 genome sequences reported from different countries worldwide. Furthermore, we analysed all SARS-CoV-2 isolates sequences (50217) reported from India till September 2021 and our data revealed that a total 182 mutations have occurred in this protein. The Protein accession number: YP_009724389 reported from Wuhan, China was used as wild type for mutational analysis by CoVal webserver.
B cell epitope predictionLinear B cell epitopes were predicted using IEDB (Immune Epitope Database and Analysis Resource),30 an online server tool based on Bepipred linear epitope prediction method (at the threshold value of 0.350). IEDB prediction tool was also used to predict the Nsp13 immunological parameters including the antigenicity, accessibility, flexibility, hydropathicity and beta turn. These standard parameters were estimated by Chou and Fasman beta-turn prediction algorithm, Emini surface accessibility server tool, Karplus and Schulz flexibility prediction tool, Kolaskar and Tongaonkar antigenicity and Parker hydrophilicity prediction algorithms, respectively.31,32 The DiscoTope 2.0 was used for prediction of Discontinuous B cell epitope using threshold value set at −5.5 and its three dimensional structure were represented by discovery studio software. Antigenicity and allergenicity of B cell epitopes were predicted by Vaxijen 2.033 and AllergenFP v.1.034 servers, respectively.
T cell epitope predictionOn the surface of antigenic presenting cell, T cell epitopes are presented where they are attached to Major Histocompatibility Complex (MHC) molecule. MHC class I and class II molecules were predicted as follows-MHC class I molecule: IEDB webserver based on NetMHCpanEL 4.1 was used for prediction of MHC class I molecules.35 For this prediction, we selected HLA reference alleles (a total of 54 alleles) having epitope lengths of 9 or 10 mers. We finally sorted 9 mers conserved epitopes that show maximum binding interaction at IC50 < 200 nm. Antigenicity of all selected epitopes was predicted from Vaxijen 2.0 webserver, whereas allergenicity was predicted by AllergenFP v.1.0.
MHC class II molecules: IEDB recommended 2.22 prediction method was used to predict MHC class II epitopes. For this prediction, we selected the seven standard reference alleles having a maximum length of 11 mers. Subsequently, we sorted the most conserved 9 mers epitopes that exhibited maximum binding interaction with other alleles. Antigenicity of all selected epitopes was predicted from Vaxijen 2.0 webserver, whereas allergenicity was predicted by AllergenFP v.1.0.
Physiochemical profiling of T cell epitopesThe characterisation of selected MHC class I and MHC class II epitopes were performed by several webservers. The toxicity parameters were analysed through Toxinpred webserver tool.36 This method comprises of designing peptides (based on SVM score, first generate mutants and then predict toxicity), Batch submission (virtual screening of peptides to select best toxicity), Protein Scanning (this module first generates all possible overlapping peptides and subsequently server predicts toxicity of each overlapping peptides) and QMS calculations (peptide to get maximum/minimum/desired toxicity based upon the QM-based position specific scores). The physiochemical parameters including toxicity, hydrophobicity, hydropathicity, charge PI and molecular weight were calculated by Toxinpred tool.36 Another webserver tool HLP37 was used to predict half-life, surface accessibility, flexibility and polarity of the selected epitopes.
Structure modelling and stability predictionsThe structural representation of Nsp13 protein was performed by DynaMut webserver.38 The protein stability and dynamicity was predicted by DynaMut webserver following standard methods as described earlier.39–41 For DynaMut analysis the recently reported structure of Nsp13 (RCSB-ID: 6ZSL) was used. The position of each predicted epitope on the 3D structural surface of Nsp13 was denoted using Biovia Discovery Studio.42
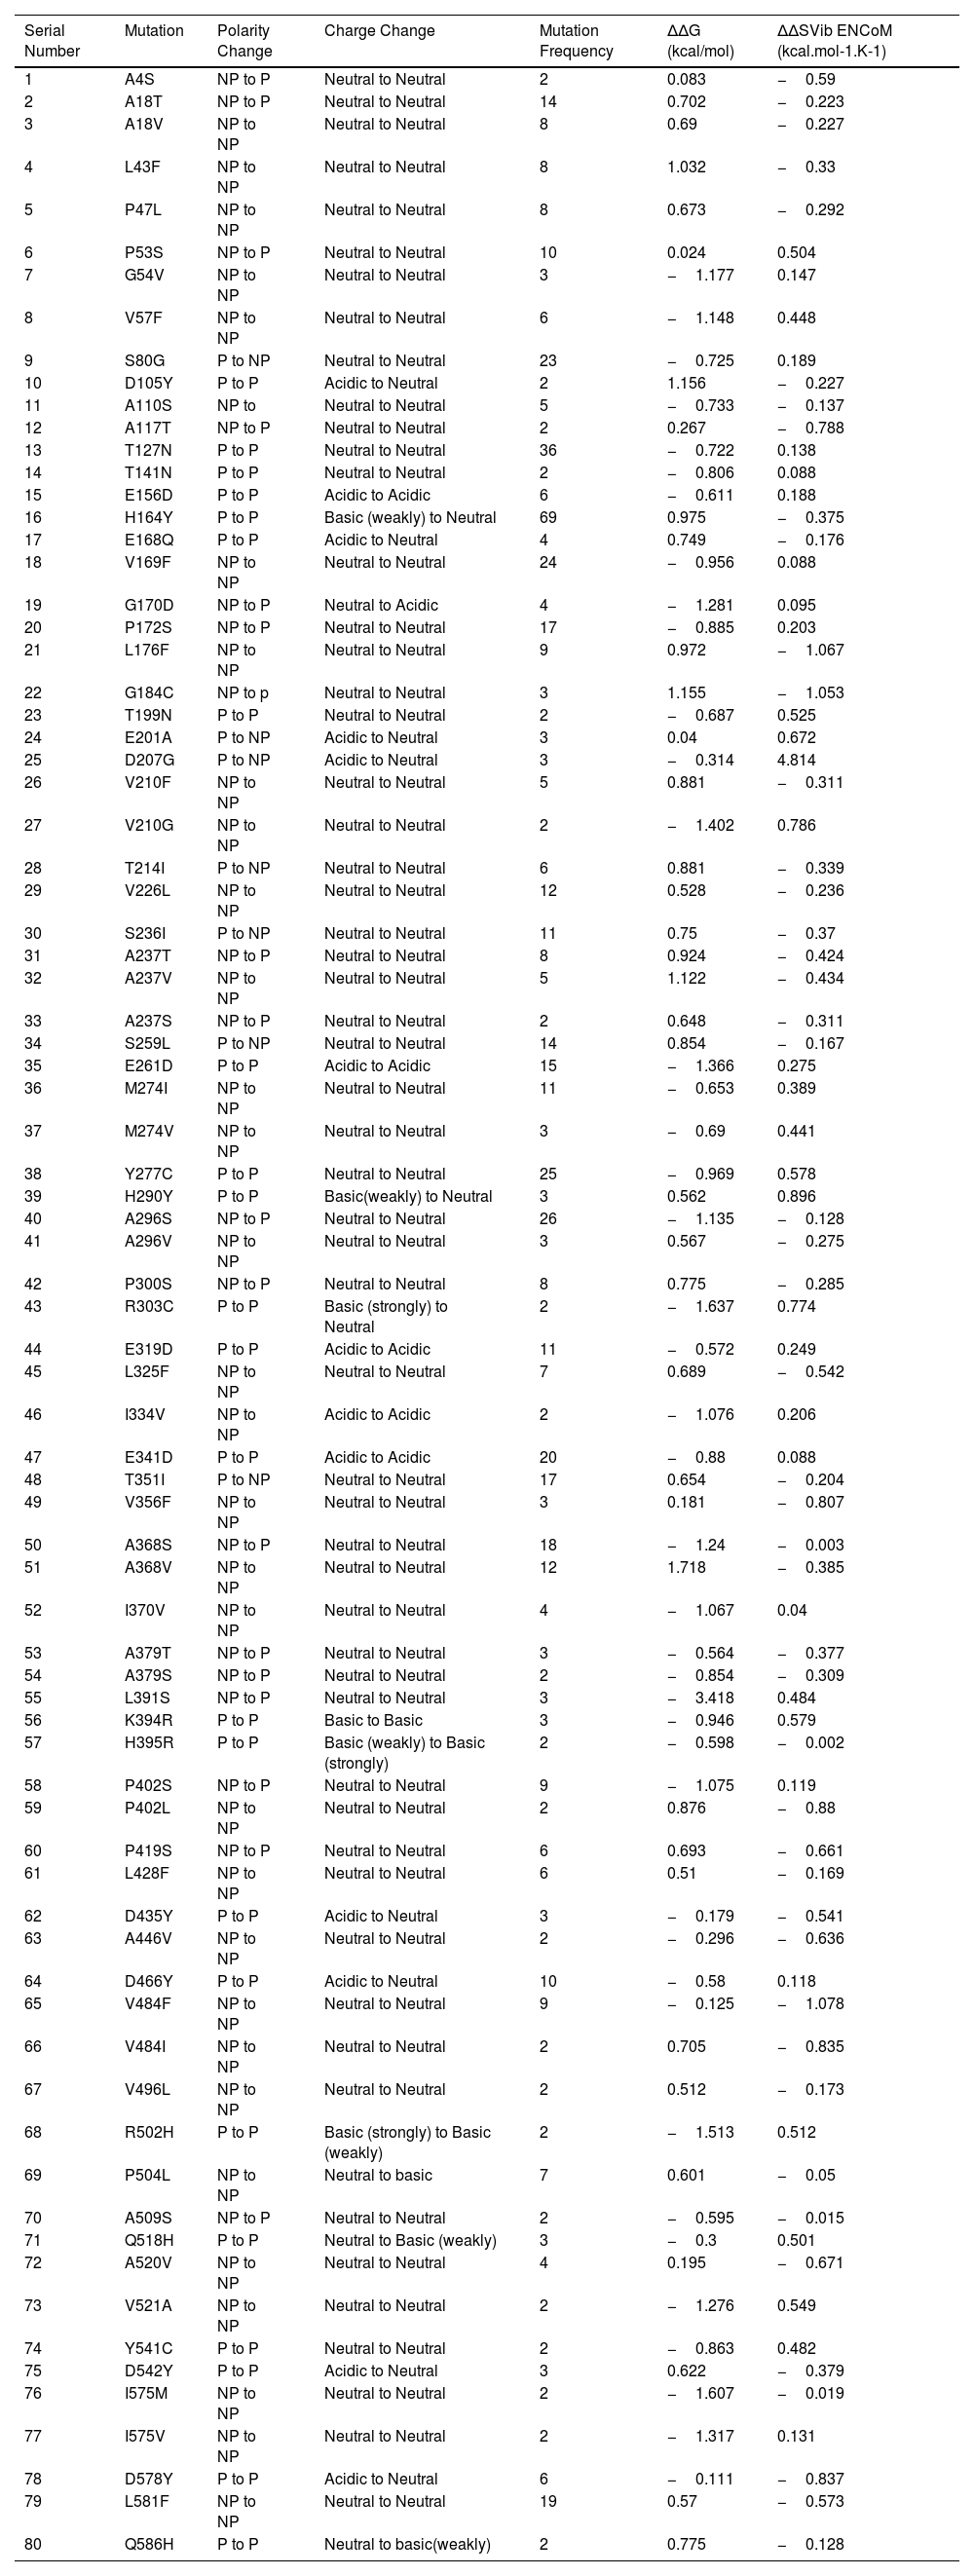
ResultsIdentification of Nsp13 mutations using CoVal Webserver among Indian isolatesIn order to identify mutations in Nsp13 protein of SARS-CoV-2 from India, we used CoVal database that compared Nsp13 sequences reported from India (50,217 samples) with first reported sequence from Wuhan province, China. Our analysis using CoVal webserver revealed 182 mutations in Nsp13 among Indian isolates (Table 1, complete list shown in supplementary table 1). Furthermore, our data revealed that P77L is the most frequent mutation observed among India isolates because it is present in 2639 samples followed by M429I (934 samples) and G206C (580) samples. We also analysed the polarity change and charge alteration due to the mutation in Nsp13. Our data show that most of mutation (132 out of 182) does not lead to any change (neutral to neutral). At two positions it changed from neutral to acidic (G87E and G170D) and acidic to basic at two positions (E420K, D119H) Similarly, basic to neutral occurred at 7 positions, neutral to basic (6 positions) and acidic to neutral (15 positions) as shown in Table 1.
The table show the identity and properties of Nsp13 protein mutants identified among Indian SARS-CoV-2 isolates. The frequency of each mutant along with polarity and charge changes are also indicated. The table also show the ΔΔG and ΔΔSvib ENCoM values of the mutants observed in Nsp13.
| Serial Number | Mutation | Polarity Change | Charge Change | Mutation Frequency | ΔΔG (kcal/mol) | ΔΔSVib ENCoM (kcal.mol-1.K-1) |
|---|---|---|---|---|---|---|
| 1 | A4S | NP to P | Neutral to Neutral | 2 | 0.083 | −0.59 |
| 2 | A18T | NP to P | Neutral to Neutral | 14 | 0.702 | −0.223 |
| 3 | A18V | NP to NP | Neutral to Neutral | 8 | 0.69 | −0.227 |
| 4 | L43F | NP to NP | Neutral to Neutral | 8 | 1.032 | −0.33 |
| 5 | P47L | NP to NP | Neutral to Neutral | 8 | 0.673 | −0.292 |
| 6 | P53S | NP to P | Neutral to Neutral | 10 | 0.024 | 0.504 |
| 7 | G54V | NP to NP | Neutral to Neutral | 3 | −1.177 | 0.147 |
| 8 | V57F | NP to NP | Neutral to Neutral | 6 | −1.148 | 0.448 |
| 9 | S80G | P to NP | Neutral to Neutral | 23 | −0.725 | 0.189 |
| 10 | D105Y | P to P | Acidic to Neutral | 2 | 1.156 | −0.227 |
| 11 | A110S | NP to | Neutral to Neutral | 5 | −0.733 | −0.137 |
| 12 | A117T | NP to P | Neutral to Neutral | 2 | 0.267 | −0.788 |
| 13 | T127N | P to P | Neutral to Neutral | 36 | −0.722 | 0.138 |
| 14 | T141N | P to P | Neutral to Neutral | 2 | −0.806 | 0.088 |
| 15 | E156D | P to P | Acidic to Acidic | 6 | −0.611 | 0.188 |
| 16 | H164Y | P to P | Basic (weakly) to Neutral | 69 | 0.975 | −0.375 |
| 17 | E168Q | P to P | Acidic to Neutral | 4 | 0.749 | −0.176 |
| 18 | V169F | NP to NP | Neutral to Neutral | 24 | −0.956 | 0.088 |
| 19 | G170D | NP to P | Neutral to Acidic | 4 | −1.281 | 0.095 |
| 20 | P172S | NP to P | Neutral to Neutral | 17 | −0.885 | 0.203 |
| 21 | L176F | NP to NP | Neutral to Neutral | 9 | 0.972 | −1.067 |
| 22 | G184C | NP to p | Neutral to Neutral | 3 | 1.155 | −1.053 |
| 23 | T199N | P to P | Neutral to Neutral | 2 | −0.687 | 0.525 |
| 24 | E201A | P to NP | Acidic to Neutral | 3 | 0.04 | 0.672 |
| 25 | D207G | P to NP | Acidic to Neutral | 3 | −0.314 | 4.814 |
| 26 | V210F | NP to NP | Neutral to Neutral | 5 | 0.881 | −0.311 |
| 27 | V210G | NP to NP | Neutral to Neutral | 2 | −1.402 | 0.786 |
| 28 | T214I | P to NP | Neutral to Neutral | 6 | 0.881 | −0.339 |
| 29 | V226L | NP to NP | Neutral to Neutral | 12 | 0.528 | −0.236 |
| 30 | S236I | P to NP | Neutral to Neutral | 11 | 0.75 | −0.37 |
| 31 | A237T | NP to P | Neutral to Neutral | 8 | 0.924 | −0.424 |
| 32 | A237V | NP to NP | Neutral to Neutral | 5 | 1.122 | −0.434 |
| 33 | A237S | NP to P | Neutral to Neutral | 2 | 0.648 | −0.311 |
| 34 | S259L | P to NP | Neutral to Neutral | 14 | 0.854 | −0.167 |
| 35 | E261D | P to P | Acidic to Acidic | 15 | −1.366 | 0.275 |
| 36 | M274I | NP to NP | Neutral to Neutral | 11 | −0.653 | 0.389 |
| 37 | M274V | NP to NP | Neutral to Neutral | 3 | −0.69 | 0.441 |
| 38 | Y277C | P to P | Neutral to Neutral | 25 | −0.969 | 0.578 |
| 39 | H290Y | P to P | Basic(weakly) to Neutral | 3 | 0.562 | 0.896 |
| 40 | A296S | NP to P | Neutral to Neutral | 26 | −1.135 | −0.128 |
| 41 | A296V | NP to NP | Neutral to Neutral | 3 | 0.567 | −0.275 |
| 42 | P300S | NP to P | Neutral to Neutral | 8 | 0.775 | −0.285 |
| 43 | R303C | P to P | Basic (strongly) to Neutral | 2 | −1.637 | 0.774 |
| 44 | E319D | P to P | Acidic to Acidic | 11 | −0.572 | 0.249 |
| 45 | L325F | NP to NP | Neutral to Neutral | 7 | 0.689 | −0.542 |
| 46 | I334V | NP to NP | Acidic to Acidic | 2 | −1.076 | 0.206 |
| 47 | E341D | P to P | Acidic to Acidic | 20 | −0.88 | 0.088 |
| 48 | T351I | P to NP | Neutral to Neutral | 17 | 0.654 | −0.204 |
| 49 | V356F | NP to NP | Neutral to Neutral | 3 | 0.181 | −0.807 |
| 50 | A368S | NP to P | Neutral to Neutral | 18 | −1.24 | −0.003 |
| 51 | A368V | NP to NP | Neutral to Neutral | 12 | 1.718 | −0.385 |
| 52 | I370V | NP to NP | Neutral to Neutral | 4 | −1.067 | 0.04 |
| 53 | A379T | NP to P | Neutral to Neutral | 3 | −0.564 | −0.377 |
| 54 | A379S | NP to P | Neutral to Neutral | 2 | −0.854 | −0.309 |
| 55 | L391S | NP to P | Neutral to Neutral | 3 | −3.418 | 0.484 |
| 56 | K394R | P to P | Basic to Basic | 3 | −0.946 | 0.579 |
| 57 | H395R | P to P | Basic (weakly) to Basic (strongly) | 2 | −0.598 | −0.002 |
| 58 | P402S | NP to P | Neutral to Neutral | 9 | −1.075 | 0.119 |
| 59 | P402L | NP to NP | Neutral to Neutral | 2 | 0.876 | −0.88 |
| 60 | P419S | NP to P | Neutral to Neutral | 6 | 0.693 | −0.661 |
| 61 | L428F | NP to NP | Neutral to Neutral | 6 | 0.51 | −0.169 |
| 62 | D435Y | P to P | Acidic to Neutral | 3 | −0.179 | −0.541 |
| 63 | A446V | NP to NP | Neutral to Neutral | 2 | −0.296 | −0.636 |
| 64 | D466Y | P to P | Acidic to Neutral | 10 | −0.58 | 0.118 |
| 65 | V484F | NP to NP | Neutral to Neutral | 9 | −0.125 | −1.078 |
| 66 | V484I | NP to NP | Neutral to Neutral | 2 | 0.705 | −0.835 |
| 67 | V496L | NP to NP | Neutral to Neutral | 2 | 0.512 | −0.173 |
| 68 | R502H | P to P | Basic (strongly) to Basic (weakly) | 2 | −1.513 | 0.512 |
| 69 | P504L | NP to NP | Neutral to basic | 7 | 0.601 | −0.05 |
| 70 | A509S | NP to P | Neutral to Neutral | 2 | −0.595 | −0.015 |
| 71 | Q518H | P to P | Neutral to Basic (weakly) | 3 | −0.3 | 0.501 |
| 72 | A520V | NP to NP | Neutral to Neutral | 4 | 0.195 | −0.671 |
| 73 | V521A | NP to NP | Neutral to Neutral | 2 | −1.276 | 0.549 |
| 74 | Y541C | P to P | Neutral to Neutral | 2 | −0.863 | 0.482 |
| 75 | D542Y | P to P | Acidic to Neutral | 3 | 0.622 | −0.379 |
| 76 | I575M | NP to NP | Neutral to Neutral | 2 | −1.607 | −0.019 |
| 77 | I575V | NP to NP | Neutral to Neutral | 2 | −1.317 | 0.131 |
| 78 | D578Y | P to P | Acidic to Neutral | 6 | −0.111 | −0.837 |
| 79 | L581F | NP to NP | Neutral to Neutral | 19 | 0.57 | −0.573 |
| 80 | Q586H | P to P | Neutral to basic(weakly) | 2 | 0.775 | −0.128 |
We used DynaMut program to predict the effect of mutations on the stability of the protein by calculating the differences in free energy (ΔΔG) and change in vibrational entropy energy (ΔΔSVibENCoM) between wild type and Nsp13 mutants. The positive ΔΔG corresponds to increase in stability while negative ΔΔG corresponds to decrease in stability. Similarly, positive ΔΔSVibENCoM corresponds to increase in flexibility while negative ΔΔSVibENCoM denotes decrease in flexibility of the mutant protein. Our data revealed the noticeable increase or decrease in free energy as well as vibrational entropy energy in various mutants as shown in Table 1 (list only those mutants whose ∆∆G and ∆∆S change is more than ±0.500). The highest positive ΔΔG was obtained for A368 V (1.718 kcal/mol) and the maximum negative ΔΔG was observed for L391S (−3.418 kcal/mol) (Table 1). Similarly, the highest positive ΔΔSVibENCoM was obtained for D207G (4.814 kcal.mol-1.K-1) and most negative ΔΔSVibENCoM was observed for V484F (−1.078 kcal.mol-1.K-1) (Table 1).
Altogether, the data obtained from ΔΔG and ΔΔSVibENCoM analysis suggests that Nsp13 mutations can influence protein stability and dynamicity.
Prediction of B cell epitope contributed by Nsp13IEDB webserver tool was used for predicting the continuous B-cell epitopes of Nsp13 (Fig. 1A). Our analysis revealed seven best epitopes that were more than 8 amino acid residues in length (Fig. 1B). Subsequently, these epitopes were further characterised by analysing various parameters, including vaxijen score, allergenicity, and toxicity (Fig. 1B). Our prediction data revealed that all of them are non-toxic however, five peptides (CNAPGCDVT, CVGSDNVT, VGKPRPPLN, TFEKGDYGDA and GDPAQLPAP) possess alleregenicity properties and two peptides are non-allergen (TQTVDSSQGSEY and STLQGPPGTGKS). Similarly, three of them exhibited antigenic property while four are non-antigenic (Fig. 1B). Subsequently, we predicted the B cell epitopes of Nsp13 based on its three dimensional structure using DiscoTop 2.0 webserver tool.43 Our analysis revealed the eleven discontinuous epitopes of Nsp13 having high score. The location of these epitopes are highlighted on the 3D structure of Nsp13 (Fig. 1C) and their additional details are shown in Fig. 1D. We observed four clusters that include few amino acids that are adjacent to each other in the 3D structure. Namely, cluster 1 (V169, G170), cluster 2 (H245, T246, V247, R248), cluster 3 (L256, N257) and cluster 4 (H482, V484). These clusters are highlighted in figure (Fig. 1C). The structural location of each discontinuous epitopes is also shown in supplementary Fig. 1 (A-K).
IEDB webserver tool was used for predicting the continuous B-cell epitopes of Nsp13 (Fig. 1A). Our analysis revealed seven best epitopes that were more than 8 amino acid residues in length (Fig. 1B). Subsequently, these epitopes were further characterised by analysing various parameters, including vaxijen score, allergenicity, and toxicity (Fig. 1B). Our prediction data revealed that all of them are non-toxic however, five peptides (CNAPGCDVT, CVGSDNVT, VGKPRPPLN, TFEKGDYGDA and GDPAQLPAP) possess alleregenicity properties and two peptides are non-allergen (TQTVDSSQGSEY and STLQGPPGTGKS). Similarly, three of them exhibited antigenic property while four are non-antigenic (Fig. 1B). Subsequently, we predicted the B cell epitopes of Nsp13 based on its three dimensional structure using DiscoTop 2.0 webserver tool.43 Our analysis revealed the eleven discontinuous epitopes of Nsp13 having high score. The location of these epitopes are highlighted on the 3D structure of Nsp13 (Fig. 1C) and their additional details are shown in Fig. 1D. We observed four clusters that include few amino acids that are adjacent to each other in the 3D structure. Namely, cluster 1 (V169, G170), cluster 2 (H245, T246, V247, R248), cluster 3 (L256, N257) and cluster 4 (H482, V484). These clusters are highlighted in figure (Fig. 1C). The structural location of each discontinuous epitopes is also shown in supplementary Fig. 1 (A-K).
Subsequently, we compared the B-cell epitope sequences with the list of Nsp13 mutations observed among Indian SARS-CoV-2 isolates. The comparison revealed that eighteen of the identified mutations reside in those epitopes (Fig. 1B and D, highlighted in red font). Next, we measured the mutation density of each continuous B cell epitope. We calculated the mutation density of epitopes by using the formula: Mutation density = No. of total mutations/length of the epitope. The values were normalised to 1 as the highest possible value and 0 as the lowest possible value. Our analysis revealed that peptide 2 has the highest mutation density while peptide 5 has the lowest (Fig. 1E). This comparison also suggests that the newly emerged SARS-CoV-2 variants have changes in their epitopes from the wild type SARS-CoV-2. Altogether, our data revealed B –cell epitopes contributed by Nsp13.
 The Y-axis of the graph corresponds to BepiPred score, while the X-axis depicts the Nsp13 residue positions in the sequence. The yellow area of the graph corresponds to the area of the protein having higher probability to generate epitope. B) The top seven peptides of Nsp13 having at least 8 amino acids are shown with vaxijen score. The red font shows the location of mutant residues in the epitope sequence. C) Prediction of discontinuous B-cell epitopes. The position of each predicted epitope on the 3D structural surface of Nsp13 was denoted using Biovia Discovery Studio.42 The discontinuous B-cell epitopes and its position is depicted in the 3D structure of Nsp13 protein. We observed four clusters that include few amino acids that are adjacent to each other in the 3D structure. Namely, cluster 1 (V169, G170), cluster 2 (H245, T246, V247, R248), cluster 3 (L256, N257) and cluster 4 (H482, V484). These clusters are highlighted in fig. D) The location and identity of each discontinuous epitopes of Nsp13. E) Analysis of mutation density of each continuous B cell epitope. We calculated the mutation density of epitopes by using the formula: Mutation density = No. of total mutations/length of the epitope. The values were normalised to 1 as the highest possible value and 0 as the lowest possible value. (For interpretation of the references to colour in this figure legend, the reader is referred to the web version of this article.)")
Prediction of B-cell epitopes of Nsp13. Linear continuous epitopes, A) The Y-axis of the graph corresponds to BepiPred score, while the X-axis depicts the Nsp13 residue positions in the sequence. The yellow area of the graph corresponds to the area of the protein having higher probability to generate epitope. B) The top seven peptides of Nsp13 having at least 8 amino acids are shown with vaxijen score. The red font shows the location of mutant residues in the epitope sequence. C) Prediction of discontinuous B-cell epitopes. The position of each predicted epitope on the 3D structural surface of Nsp13 was denoted using Biovia Discovery Studio.42 The discontinuous B-cell epitopes and its position is depicted in the 3D structure of Nsp13 protein. We observed four clusters that include few amino acids that are adjacent to each other in the 3D structure. Namely, cluster 1 (V169, G170), cluster 2 (H245, T246, V247, R248), cluster 3 (L256, N257) and cluster 4 (H482, V484). These clusters are highlighted in fig. D) The location and identity of each discontinuous epitopes of Nsp13. E) Analysis of mutation density of each continuous B cell epitope. We calculated the mutation density of epitopes by using the formula: Mutation density = No. of total mutations/length of the epitope. The values were normalised to 1 as the highest possible value and 0 as the lowest possible value. (For interpretation of the references to colour in this figure legend, the reader is referred to the web version of this article.)
All essential parameters of B cell epitopes including Beta turn, accessibility of surface, flexibility, antigenicity and hydrophilicity were also calculated for Nsp13 (Fig. 2). Chou and Fasman's beta-turn prediction algorithm (with threshold 0.984) resulted in a minimum score of 0.677 and a maximum score of 1.384, and our selected peptide showed a propensity score of 1.164 (Fig. 2A). Emini surface accessibility prediction tool (with threshold 1.000) resulted in a minimum score of 0.036 and a maximum score of 4.888, and our selected peptide scored 1.33 in surface accessibility (Fig. 2B). Karplus and Schulz's flexibility prediction tool (with threshold 0.989) resulted in a minimum score of 0.904 and a maximum score of 1.150, and our selected peptide showed 1.033 in flexibility score (Fig. 2C). Kolaskar and Tongaonkar antigenicity scale (with threshold 1.052) resulted in a minimum score of 0.893 and a maximum score of 1.284, and our selected peptide showed an antigenicity score of 1.0163 (Fig. 2D). The parker hydrophilicity prediction algorithms (with threshold 1.325) resulted in a minimum score of −3.714 and a maximum score of 7.000, and our selected peptide showed 1.33 in hydrophilicity score (Fig. 2E).
 β variants of structural polyproteins as predicted by Chou and Fasman β metamorphosis prediction, B) Surface accessibility analysis shown on Emini surface accessibility scale, C) Flexibility analysis on Karplus and Schultz flexibility scale, D) Antigenic determinants of Nsp13 were predicted using Kolaskar and Tongaonkar, E) Hydrophilicity of Nsp13 was predicted by Parker hydrophilicity.")
Recognition of B cell epitopes. A) β variants of structural polyproteins as predicted by Chou and Fasman β metamorphosis prediction, B) Surface accessibility analysis shown on Emini surface accessibility scale, C) Flexibility analysis on Karplus and Schultz flexibility scale, D) Antigenic determinants of Nsp13 were predicted using Kolaskar and Tongaonkar, E) Hydrophilicity of Nsp13 was predicted by Parker hydrophilicity.
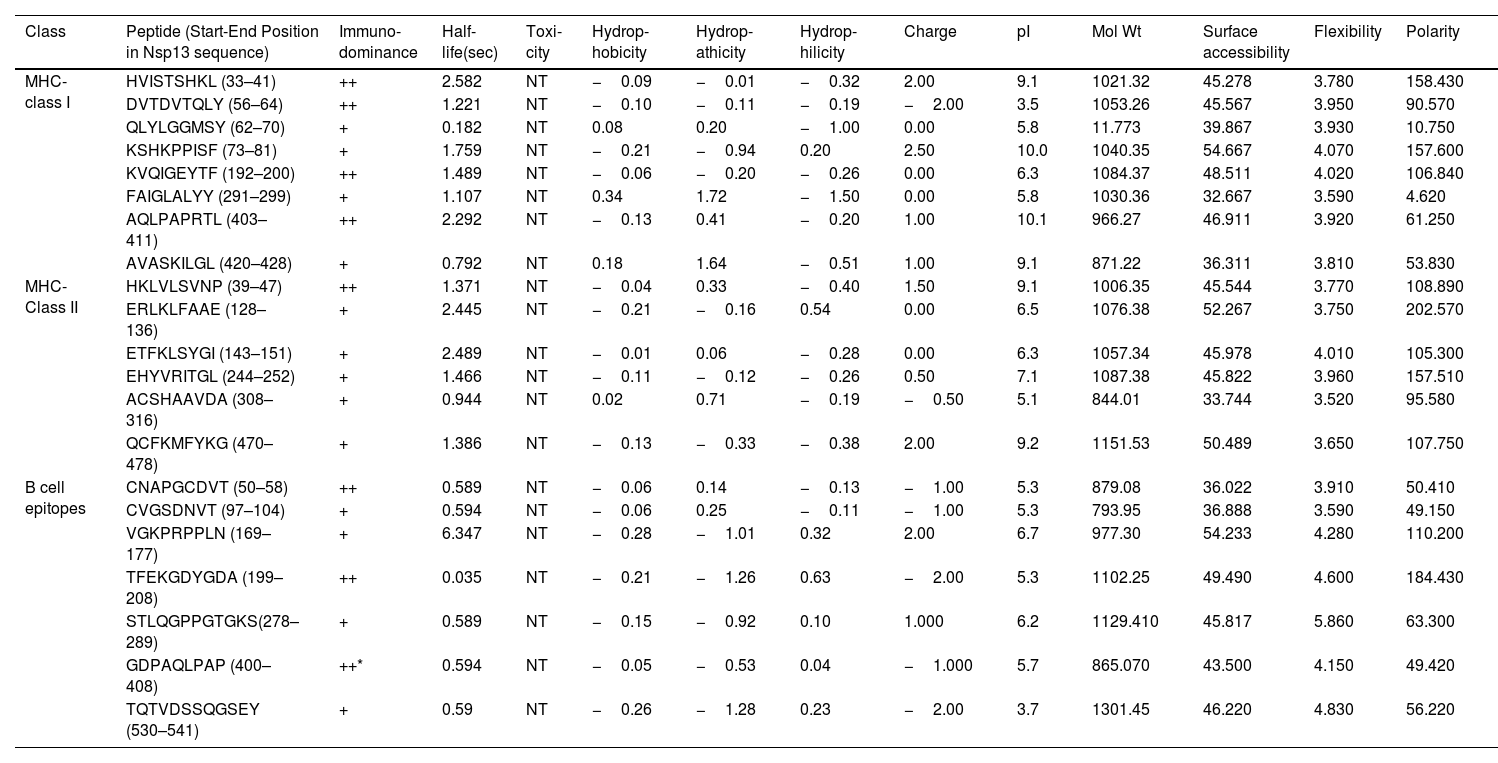
The IEDB webserver tool was used for prediction of Cytotoxic T- Lymphocyte epitopes and its interaction with MHC class I molecules. Our analysis with Nsp13 revealed 8 potential T cell epitopes (Table 2). NetMHCpanEL 4.1 MHC-class I binding prediction tools was used to predict the binding of these epitopes with MHC class I molecules with high affinity are listed in Table 2. The peptide FAIGLALYY from start (11) to end (19) had highest immunogenicity and affinity to interact with 9 alleles (HLA-B*35:01, HLA-A*26:01, HLA-B*53:01, HLA-A*01:01, HLA-A*30:02, HLA-B*58:01, HLA-B*15:01, HLA-A*68:01, HLA-B*57:01) and also showed allergenicity (Table 2). The allergenicity of these epitopes was predicted by Allergen FP tool, which categorises peptides into allergen/non-allergen based on the Tanimoto coefficients. The peptide HVISTSHKL (33–41) was predicted to be non-allergen while the rest of them are categorised as an allergen (Table 2). Furthermore, we also measured the population coverage of these HLA alleles, which is shown in Table 2.
The table show the details of T cell epitopes of Nsp13 related to MHC-I and MHC-II molecules. The MHC-I and MHC-II interaction with top most alleles (affinity IC50 value of <200) are mentioned in the table along with Vaxijen score and allergenicity and population coverage.
| List of MHC-class I molecules | |||||
|---|---|---|---|---|---|
| Epitopes | Start-End Position | MHC-I allele with an affinity IC50 value of <200 | Vaxijen score | Allergenicity | Population coverage (in India) |
| HVISTSHKL | 33–41 | HLA-A*68:02,HLA-A*02:06,HLA-A*26:01, HLA-A*32:01,HLA-A*02:03,HLA-B*35:01, HLA-A*02:01 | 0.6850(probable antigen) | probablenon-allergen | 27.05% |
| DVTDVTQLY | 56–64 | HLA-A*26:01,HLA-B*35:01,HLA-A*68:01,HLA-A*01:01,HLA-A*30:02,HLA-B*53:01 | 0.9181(probable antigen) | probable allergen | 26.79% |
| QLYLGGMSY | 62–70 | HLA-B*15:01,HLA-A*03:01,HLA-A*30:02,HLA-B*35:01,HLA-A*26:01,HLA-A*32:01,HLA-A*01:01,HLA-A*11:01 | 0.6598(probable antigen) | probable allergen | 29.82% |
| KSHKPPISF | 73–81 | HLA-B*57:01,HLA-B*58:01,HLA-A* 32:01,HLA-B*15:01,HLA-A*30:01,HLA-A*30:02,HLA-A*24:02,HLA-A*23:01,HLA-B*07:02 | 0.9349(probable antigen) | probable allergen | 42.71% |
| KVQIGEYTF | 192–200 | HLA-A*32:01,HLA-B*57:01,HLA-B*58:01,HLA-B*15:01,HLA-A*24:02,HLA-A*23:01 | 0.8369(probable antigen) | probable allergen | 26.97% |
| FAIGLALYY | 291–299 | HLA-B*35:01,HLA-A*26:01,HLA-B*53:01,HLA-A*01:01,HLA-A*30:02,HLA-B*58:01,HLA-B*15:01,HLA-A*68:01,HLA-B*57:01 | 1.1890(probable antigen) | probable allergen | 41.19% |
| AQLPAPRTL | 403–411 | HLA-A*02:06, HLA-B*15:01,HLA-B*40:01,HLA-A*32:01, HLA-A*02:01, HLA-A*02:03,HLA-B*44:03 | −0.3560(probable non-antigen) | probable allergen | 35.37% |
| AVASKILGL | 420–428 | HLA-A*02:03,HLA-A*02:06,HLA-A*02:01,HLA-A*68:02,HLA-A*32:01,HLA-B*08:01,HLA-A*30:01 | 0.4971(probable antigen) | probable allergen | 50.91% |
| List of MHC-class II molecules | |||||
| Epitopes | Start –End Position | MHC-II allele with an affinity IC50 value of <200 | Vaxijen score | Allergenecity | Population coverage (in India) |
| HKLVLSVNP | 39–47 | HLA-DRB1*15:01,HLA-DRB1*03:01,HLA-DRB1*07:01,HLA-DRB3*01:01,HLA-DRB5*01:01 | 0.5001(probable antigen) | probable allergen | 53.93% |
| ERLKLFAAE | 128–136 | HLA-DRB1*15:01,HLA-DRB1*07:01,HLA-DRB5*01:01,HLA-DRB1*03:01,HLA-DRB3*01:01 | −0.0539(probable non-antigen) | probable allergen | |
| ETFKLSYGI | 143–151 | HLA-DRB1*07:01,HLA-DRB1*15:01,HLA-DRB3*01:01,HLA-DRB5*01:01,HLA-DRB1*03:01 | 0.2915(probable non-antigen) | probable allergen | |
| EHYVRITGL | 244–252 | HLA-DRB5*01:01,HLA-DRB1*15:01,HLA-DRB4*01:01,HLA-DRB1*07:01 | 0.5647(probable antigen) | probablenon-allergen | |
| ACSHAAVDA | 308–316 | HLA-DRB1*07:01,HLA-DRB4*01:01,HLA-DRB1*03:01,HLA-DRB1*15:01 | 0.1368(probable non-antigen) | probable allergen | |
| QCFKMFYKG | 470–478 | HLA-DRB1*15:01,HLA-DRB5*01:01,HLA-DRB1*07:01,HLA-DRB3*01:01,HLA-DRB1*03:01 | 0.4573(probable antigen) | probablenon-allergen | |
Similarly, the prediction of Helper T-Lymphocyte epitopes of Nsp13 and its interaction with MHC Class II molecules was predicted by IEDB webserver (based on IEDB recommended 2.22 method). We selected top 6 epitopes that exhibited maximum binding affinity with MHC class II molecules (Table 2). Our analysis revealed that only one epitope (HKLVLSVNP) possesses both antigenicity and allergenicity properties and affinity to interact with 5 alleles as shown in Table 2 (HLA-DRB1*15:01, HLA-DRB1*03:01, HLA-DRB1*07:01, HLA-DRB3*01:01, HLA-DRB5*01:01). The epitopes EHYVRITGL had highest immunogenicity and affinity to interact with 4 alleles (HLA-DRB5*01:01, HLA-DRB1*15:01, HLA-DRB4*01:01, HLA-DRB1*07:01) (Table 2). The allergenicity of these epitopes was also predicted based on Tanimoto coefficients. The data show that peptides EHYVRITGL and QCFKMFYKG were predicted to be non-allergen while the rest of them are categorised as allergen (Table 2). The population coverage of these HLA alleles are also shown in Table 2.
Subsequently, we examined several vital physiochemical features of these promising B and T cell epitopes. The half-life of MHC class I and II and B cell epitopes were calculated and our data revealed that the maximum half-life was observed for HVISTSHKL (MHC class I) and ETFKLSYGI for MHC class II molecule (Table 3). The toxicity prediction was performed by ToxinPred tool show that all analysed molecules were non-toxic (Table 3). We further analysed hydrophobicity, hydropathicity, hydrophilicity, polarity, charge, flexibility, pI, molecular weight and surface accessibility of both MHC class I and II molecules (Table 3). We also compared the MHC-I, MHC-II and B-cell epitopes to identify the most immunodominant epitope. Our data revealed that peptide 403–408 is the most immunodominant because its six amino acids (403–408) are present in both B-cell epitope and MHC-I peptide (Table 3).
The table shows the physiochemical properties of B-cell, MHC-I and MHC-II molecules. Several parameters were obtained using different webserver and tools as mentioned in methods section. The immunodominance was identified by comparing the B-cell, MHC-I and MHC-II peptides. If a peptide is present in any one of them then One ‘+’ is assigned; however, when it is present in two of them then two ‘++’ is assigned. In this way the immunodomiance of all peptides were measure and shown in table. * represents the most immunodominant epitope (peptide 403–408, its six amino acids are present in both B-cell epitope and MHC-I peptide).
| Class | Peptide (Start-End Position in Nsp13 sequence) | Immuno-dominance | Half-life(sec) | Toxi-city | Hydrop-hobicity | Hydrop-athicity | Hydrop-hilicity | Charge | pI | Mol Wt | Surface accessibility | Flexibility | Polarity |
|---|---|---|---|---|---|---|---|---|---|---|---|---|---|
| MHC-class I | HVISTSHKL (33–41) | ++ | 2.582 | NT | −0.09 | −0.01 | −0.32 | 2.00 | 9.1 | 1021.32 | 45.278 | 3.780 | 158.430 |
| DVTDVTQLY (56–64) | ++ | 1.221 | NT | −0.10 | −0.11 | −0.19 | −2.00 | 3.5 | 1053.26 | 45.567 | 3.950 | 90.570 | |
| QLYLGGMSY (62–70) | + | 0.182 | NT | 0.08 | 0.20 | −1.00 | 0.00 | 5.8 | 11.773 | 39.867 | 3.930 | 10.750 | |
| KSHKPPISF (73–81) | + | 1.759 | NT | −0.21 | −0.94 | 0.20 | 2.50 | 10.0 | 1040.35 | 54.667 | 4.070 | 157.600 | |
| KVQIGEYTF (192–200) | ++ | 1.489 | NT | −0.06 | −0.20 | −0.26 | 0.00 | 6.3 | 1084.37 | 48.511 | 4.020 | 106.840 | |
| FAIGLALYY (291–299) | + | 1.107 | NT | 0.34 | 1.72 | −1.50 | 0.00 | 5.8 | 1030.36 | 32.667 | 3.590 | 4.620 | |
| AQLPAPRTL (403–411) | ++ | 2.292 | NT | −0.13 | 0.41 | −0.20 | 1.00 | 10.1 | 966.27 | 46.911 | 3.920 | 61.250 | |
| AVASKILGL (420–428) | + | 0.792 | NT | 0.18 | 1.64 | −0.51 | 1.00 | 9.1 | 871.22 | 36.311 | 3.810 | 53.830 | |
| MHC-Class II | HKLVLSVNP (39–47) | ++ | 1.371 | NT | −0.04 | 0.33 | −0.40 | 1.50 | 9.1 | 1006.35 | 45.544 | 3.770 | 108.890 |
| ERLKLFAAE (128–136) | + | 2.445 | NT | −0.21 | −0.16 | 0.54 | 0.00 | 6.5 | 1076.38 | 52.267 | 3.750 | 202.570 | |
| ETFKLSYGI (143–151) | + | 2.489 | NT | −0.01 | 0.06 | −0.28 | 0.00 | 6.3 | 1057.34 | 45.978 | 4.010 | 105.300 | |
| EHYVRITGL (244–252) | + | 1.466 | NT | −0.11 | −0.12 | −0.26 | 0.50 | 7.1 | 1087.38 | 45.822 | 3.960 | 157.510 | |
| ACSHAAVDA (308–316) | + | 0.944 | NT | 0.02 | 0.71 | −0.19 | −0.50 | 5.1 | 844.01 | 33.744 | 3.520 | 95.580 | |
| QCFKMFYKG (470–478) | + | 1.386 | NT | −0.13 | −0.33 | −0.38 | 2.00 | 9.2 | 1151.53 | 50.489 | 3.650 | 107.750 | |
| B cell epitopes | CNAPGCDVT (50–58) | ++ | 0.589 | NT | −0.06 | 0.14 | −0.13 | −1.00 | 5.3 | 879.08 | 36.022 | 3.910 | 50.410 |
| CVGSDNVT (97–104) | + | 0.594 | NT | −0.06 | 0.25 | −0.11 | −1.00 | 5.3 | 793.95 | 36.888 | 3.590 | 49.150 | |
| VGKPRPPLN (169–177) | + | 6.347 | NT | −0.28 | −1.01 | 0.32 | 2.00 | 6.7 | 977.30 | 54.233 | 4.280 | 110.200 | |
| TFEKGDYGDA (199–208) | ++ | 0.035 | NT | −0.21 | −1.26 | 0.63 | −2.00 | 5.3 | 1102.25 | 49.490 | 4.600 | 184.430 | |
| STLQGPPGTGKS(278–289) | + | 0.589 | NT | −0.15 | −0.92 | 0.10 | 1.000 | 6.2 | 1129.410 | 45.817 | 5.860 | 63.300 | |
| GDPAQLPAP (400–408) | ++* | 0.594 | NT | −0.05 | −0.53 | 0.04 | −1.000 | 5.7 | 865.070 | 43.500 | 4.150 | 49.420 | |
| TQTVDSSQGSEY (530–541) | + | 0.59 | NT | −0.26 | −1.28 | 0.23 | −2.00 | 3.7 | 1301.45 | 46.220 | 4.830 | 56.220 |
In this study, we examined the predicted B cell epitopes of Nsp13, a non-structural protein of SARS-CoV-2. We studied the high rank B cell and T cell epitope candidates based on the immunoinformatics tools to identify Nsp13 epitopes that could regulate host immune responses. The immunoinformatics approaches have been used to study the epitopes from several viruses and those information's were used to understand the immune response of viruses.44,45 We used several physiochemical parameters including structural protrusion, antigenicity, flexibility, surface accessibility, hydrophilicity of Nsp13 were assessed to predict potential B-cell epitopes. IEDB resource tool was used to predict B-cell linear epitopes of at least eight amino acid residues. Our analysis revealed that under these conditions, seven linear B-cell epitopes were predicted that are at least 8 amino acids in length and are of non-toxic in nature. The discontinuous epitopes comprised of the residues that might be separated in linear sequence, however, in 3D structure they are in close proximity.46 Subsequently, the candidate epitopes were further characterised by the tools that can predict various physicochemical properties. Our data revealed that among B-cell epitopes the ‘TFEKGDYGDA’ peptide exhibited a strong stable immunogenic property as shown by its highest vaxijen score (0.9707) and non-toxic. Furthermore, eight MHC class-I and six MHC class-II binding T-cell epitopes assessed as highly antigenic and also predicted to interact with several HLA alleles. Detailed analysis revealed that the best vaxijen score of 1.18 was found for ‘FAIGLALYY’ peptide for MHC class-I molecule, and for MHC class-II molecules, ‘HKLVLSVNP’ has a maximum vaxijen score of 0.50 epitopes. Moreover, the SARS-CoV-2 genome is continuously changing due to the occurrence of random mutations during its replication inside the host cells. More importantly, if the mutated viruses have better fitness than its counterparts they get selected by natural selection and led to appearance of new variants. Therefore, genomic surveillance of SARS-CoV-2 is needed to understand the evolution and future course of pandemic. Towards this, bioinformatical approaches play key role by predicting the impact of mutations on viral protein structure and function. Bioinformatics has enabled researchers to systematically study the impact of large number of mutations on B and T cell epitopes. Furthermore, these in silico analyses have drastically reduced cost of study with faster and reliable output compared to the conventional experimental methods. However, there are several limitations, such as the validation of predicted in silico data should be complemented by functionally validated in vivo experiments. Furthermore, the immunoinformatics based epitope prediction is highly dependent on the quality of sequencing data provided by different participating labs as well as on the robustness of the algorithms used in those predictions. Sometimes the raw data of sequencing has few errors; in such cases the downstream analysis are also incorrect and misleading. Therefore, proper care should be taken by the researchers during analysis of genome wide data. Another limitation of our study is that we have analysed all SARS-CoV-2 isolates sequences (50217) reported from India till September 2021. Since, this virus is rapidly changing and continuous genome sequencing is being conducted worldwide; therefore, similar study should be conducted at regular intervals to understand the evolution of this virus. Moreover, the trends observed in the last two years of pandemic indicate that the new variants of SARS-CoV-2 will keep appearing and bioinformatical study will play important role in understanding their impact on virus fitness and evolution.
It has been well established that the replication of coronaviruses are error-prone that lead to creation of highly diverse genotype variants. Our study revealed a considerable alteration in stability and dynamicity due to mutations at various positions of Nsp13 that might alter its function. In-silico analyses were performed to identify and characterise the mutations occurring in Nsp13. Our data demonstrate that eighteen of the identified mutations reside in those epitopes (Fig. 1), which can help the SARS-CoV-2 variants to elicit distinct immune responses compared to the wild-type SARS-CoV-2. Our data also revealed that peptide 403–408 is the most immunodominant epitope of Nsp13 observed in this study (Table 3). These proposed consequences due to the variations in Nsp13 epitopes are substantiated by several findings with similar observations.47–49 The continuously growing body of literature shows rapid progress in the experimentally validated epitopes of SARS-CoV-2 proteins, which is required for drug discovery and vaccine development. Several recent studies have reported B and T cell epitopes observed in SARS-CoV-2-infected individuals identified by mass spectrometry studies.50–54 Interestingly, the predicted epitopes from our study partially matches with these functionally validated epitopes. One such study by Pan et al.52 in which the mass spectrometric identification of immunogenic SARS-CoV-2 epitopes were conducted are showing close resemblance of the Nsp13 epitopes from our study. The Nsp13 epitopes VYIGDPAQL and IVDTVSALVY identified by Pan et al. matches with our predicted MHC class I peptides. Similarly, epitopes KLFAAETLK, TLVPQEHYV and TLVPQEHYV observed by Pan et al. also matches with our predicted MHC class II peptides. Another study by Saini et al.55 identified ILGLPTQTV as Nsp13 epitope also resembles with our predicted MHC class I epitope. Furthermore, the predicted B cell epitope peptide 4 (TFEKGDYGDA) and peptide 5 (STLQGPPGTGKS) from our study is present in the vicinity of the experimentally validated epitope identified by Snyder et al.51 and Nelde et al.50 respectively. Altogether, the predicted epitopes of Nsp13 from this study closely matches with the experimentally validated epitopes.
In this work, we have computationally identified and characterised the epitopes of NSP13 protein and their interaction with MHC class I and II alleles were also predicted. Both MHC class I and class II molecules are part of two distinct antigen processing pathways that targets multiple antigens including viral peptides. The MHC class I and II genes code for proteins that are involved in antigen-specific responses and plays central role in neutralising viral infections. MHC class I molecules process intracellular peptides from viruses and present them to cytotoxic T lymphocytes (CTL) that monitors cell surface MHC class I molecules for peptides derived from viral proteins and eliminate such infected cells.56 Similarly, surface of antigen-presenting cells (APCs), including dendritic cells, B cells, macrophages and thymic epithelial cells presents the antigenic peptide-loaded MHC class II molecules that are recognised by antigen-specific CD4+ T cells.57 The high affinity of CD4+ T-cells to the antigen/MHC class II complex trigger inflammatory58,59 responses, which in turn keep the infection under check. The data from the present study show that the thirteen epitopes of NSP13 that interacts with MHC I and II alleles. Interestingly, most of these epitopes of NSP13 have mutations (Table 1 and Table 2) as observed from the analysis of SARS-CoV-2 sequences. It is possible that NSP13 epitopes will affect its interaction with MHC I and II alleles and could even disrupt their interactions leading to evasion from the immune cells. However, there are several limitations of these studies including the lack of full repertoire of epitopes by all proteins of SARS-CoV-2 is not known. Furthermore, how these epitopes varying among emerging variants requires periodic investigations, which is a tedious work. In future, a comprehensive full epitope mapping of SARS-CoV-2 should be conducted, which will be critical for understanding the B cell and T cell response of host cells against this virus. In short, these results could provide some insights in the understanding of Nsp13 epitopes, which is essential for evaluating the immunogenicity and virulence of SARS-CoV-2.
The following are the supplementary data related to this article.

: Supplementary table 1: The table show the identity and properties of Nsp13 protein mutants identified among Indian SARS-CoV-2 isolates. The frequency of each mutant along with polarity and charge changes are also indicated. The table also show the ΔΔG and ΔΔSvib ENCoM values of the mutants observed in Nsp13. The DynaMut programe predicts ΔΔG and ΔΔSvib ENCOM for those residues only, whose structure has been solved. Therefore, the mutations that reside in the unmodeled region of Nsp13 do not have ΔΔG and ΔΔSvib ENCoM values.
Supplementary data to this article can be found online at https://doi.org/10.1016/j.vacun.2023.02.001.
Fund informationNo funding was used to conduct this research.
CRediT authorship contribution statementSushant Kumar: Methodology, Validation, Visualization, Writing – original draft. Khushboo Kumari: Methodology, Validation, Visualization, Writing – original draft. Gajendra Kumar Azad: Conceptualization, Supervision, Methodology, Validation, Visualization, Writing – original draft, Writing – review & editing.
We would like to acknowledge the Department of Zoology, Patna University, Patna, Bihar (India) for providing infrastructural support for this study.