


Depression is a common and disabling psychiatric disorder in adulthood and is associated with higher mortality and functional disability.
ObjectivesTo determine the association between clinical and sociodemographic variables with depression in a sample of people over 50 years old living in Spain, and compare the prevalence of depression with the other Survey of Health, Ageing and Retirement (SHARE) countries.
Material and methodsThere were 5830 participants in the Spanish sample of the Wave 5, 2013, of SHARE. Tools used: EURO-D (Depression) and CASP-12 (Quality of Life). Statistical analysis: bivariate, and binary logistic.
ResultsThe variables associated with depression in the binary logistic regression (EURO-D≥4) were poor self-perceived physical health (OR=13.34; 95% CI: 9.74–18.27), having more than 2 difficulties in Activities of Daily Living (ADL) (OR=4.46; 95% CI: 3.13–6.34) and female gender (OR=2.16; 95% CI: 1.83–2.56). Depression was more common among participants with Alzheimer (76.4%), emotional disorders (73.9%), Parkinson (57.4%), hip fracture (55.4%), and rheumatism (50.9%). Compared with other European countries, Spain had a percentage of people with depression (29.3%) that was higher than the European average (27.9%).
ConclusionsThe most important variables associated with depression were poor perceived physical health, presence of difficulties in ADL, and female gender.
La depresión es un trastorno psiquiátrico incapacitante y frecuente en la edad adulta asociado a mayor mortalidad y discapacidad funcional.
ObjetivosDeterminar la asociación de las variables clínicas y sociodemográficas con la depresión, en una muestra de personas mayores de 50 años residentes en España, y comparar la prevalencia de depresión con los demás países del estudio Survey of Health, Ageing and Retirement in Europe (SHARE).
Material y métodosMuestra de 5.830 participantes de la muestra española de la «Wave 5», de 2013, del estudio SHARE. Instrumentos: EURO-D (depresión) y CASP-12 (calidad de vida). Análisis estadístico: bivariante y logístico binario.
ResultadosEn la regresión logística binaria, las variables asociadas a la depresión (EURO-D ≥4) fueron, principalmente, la mala percepción de salud física (OR=13,34; IC 95%: 9,74-18,27), la presencia de más de 2 dificultades en las actividades de la vida diaria (AVD) (OR=4,46; IC 95%: 3,13-6,34) y el género femenino (OR=2,16; IC 95%: 1,83-2,56). La depresión fue más frecuente en los participantes que padecían Alzheimer (76,4%), trastornos emocionales (73,9%), Parkinson (57,4%), fractura de cadera (55,4%) y reumatismos (50,9%). En la comparación con países europeos, España tenía un porcentaje de personas con depresión (29,3%) superior a la media europea (27,9%).
ConclusionesLas variables más relevantes asociadas a la depresión fueron la mala percepción de salud física, la presencia de dificultades en las AVD y el género femenino.
Depression is a disabling psychiatric disorder that occurs frequently in the adult population. It is associated with increased mortality and a negative effect on the functioning and well-being of the elderly. It tends to become chronic and progresses with relapses and recurrences.1,2 Many studies have estimated its prevalence in the elderly, although the resulting figures vary very widely, from 0.4 to 35%.3 These discrepancies may be due to methodological differences and/or cultural aspects of the expression of depression.4
Respecting the prevalence data in the Spanish population, in the 2014 European health survey (INE), the rate of depression during the last twelve months in those over the age of 55 years old stood at 12.9%. The corresponding figure for those over the age of 75 years old was higher, at 15.0%.5 Primary care studies show a prevalence of from 16.0% to 34.5%.6–8 In community samples the prevalence of depressive symptoms amounted to 19.7%, while the corresponding figure for clinical depression was 5.0%.9 The prevalence of major depressive disorder was 4.3% in a study in the south of Spain,10 while the ESEMeD-España study11 found a prevalence throughout life of 10.6% and in the last 12 months of 4.0%. Values were higher in the 50–64 years old group, and they then fell at greater age. The authors state that the prevalence of major depressive disorder is lower in Spain than it is in other Western countries.
Respecting the clinical and sociodemographic variables which are associated with depression in old age, age itself is a controversial factor as although risk increases with age, it is also concomitant with greater health problems.12
There is a high level of agreement among studies that depression is more frequent in women,5–8,10,11,13,14 single individuals15 and those with a lower educational level, all of which are associated with increased risk of depression in the elderly.6
Neuropsychiatric disorders including depression were one of the main causes of disablement in Spain in 2010.16 The relationship between depression, physical disablement and chronic diseases17 is especially important in old age, so that poor physical health and chronic diseases lead to greater disablement and are associated with increased depression.18–21 On the other hand, physical exercise has a favourable effect on mood and improves the quality of life, in spite of the difficulty in motivating depressed individuals to commence it.7,22
In terms of social aspects, depression is associated with a higher degree of social isolation in the geriatric population,23 while elderly individuals who live with family members have more social contacts and score significantly higher for physical, mental and emotional health.24 Moreover, the performance of activities has a protective effect against the possible appearance of depressive symptoms.25
In economic terms, ceasing to work involuntarily increases the risk of depression in those aged over 50 years old,15,26 while doing so at retirement age is beneficial for general health.27 On the other hand, consistent data indicate that the prevalence of depression is greater among those individuals with lower incomes.28
Finally, the presence of depression accelerates the ageing process, reducing satisfaction29 and the quality of life.30
The aims of this study were: (1) to determine the degree to which depression is associated with clinical and sociodemographic variables in a sample of individuals over the age of 50 years old who live in Spain, and (2) to compare the prevalence of depression in the Spanish sample with the other countries in the SHARE study.
MethodStudy design and populationSpanish population data corresponding to Wave 5 (2013) of the SHARE study were used, with a panel, transversal and multidisciplinary database containing information on the health, economic situation and social and family networks of non-institutionalised individuals over the age of 50 years old in 14 European countries and Israel.31,32
The final sample in this study included 5830 participants, after excluding those cases in which information had been lost on the variables corresponding to each one of the EURO-D dependent variable items.
Variables and instruments- •
Sociodemographic data. Information about age, sex, marital status, educational level and work situation was gathered under specific headings.
- •
Physical health. Subjective perceptions of general health were evaluated (as very good, good, mediocre or poor). The presence of different self-assessed diseases was also evaluated, such as rheumatism and high cholesterol, etc.
- •
Physical exercise. The practice of moderate and/or vigorous physical exercise was analysed (at more than once a week, once a week, from one to three times per month or practically never).
- •
Household unit. The size of households was examined (living alone, two people living together or more than 3 people).
- •
Chronic diseases. Data were gathered on the presence of chronic diseases (none, one, 2 or more).
- •
Activity. Items that asked about occupations and the predominant type of the same were used (social or individual).
- •
Life satisfaction. Data were gathered on perceived subjective satisfaction, on a scale from 0 to 10.
- •
Income. Total household income was evaluated in percentiles, along a 5-level gradient.
- •
ELA difficulties. The total number of basic and instrumental ELA was analysed, together with those in which deficits existed.
- •
Depressive symptoms. These were evaluated using the EURO-D scale, which is composed of 12 items (the presence of depressive symptoms, pessimism, death wishes, guilt, irritability, crying, fatigue, sleep problems, loss of interest and appetite, a reduction in the ability to concentrate and for enjoyment in the past month), with a cut-off point of ≥4.4,33 The replies were dichotomous as either present or absent, with a range of from 0 to 12 points. A higher score indicated a greater presence of depressive symptoms. Cronbach's alpha in the Eurodep Study34 was moderate, at from 0.61 to 0.75, while in this study it was 0.79.
- •
Quality of life. The Control, Autonomy, Pleasure and Self-realization (CASP-12)31,35 scale was used, in the reduced version of the original CASP-1936 which was specifically designed for use in SHARE (CASP-12v.1).37 This scale identifies specific quality of life aspects in ageing. It covers 4 areas: control, pleasure, independence and self-realisation. Using a Likert-type 4-point scale, these evaluate how often certain feelings and situations are experienced (3 in each domain). The scores range from 12 to 48 points, with the following categories: low (<35 points), moderate (35–37 points), high (38–39), and very high (>39).36 Cronbach's alpha was 0.84 in the analysis of the psychometric properties on the scale, while in this study it was 0.81.
Data were gathered in a 90min interview in the respondent's home. It included questions on physical health, risk behaviours, cognitive function, mental health, work and retirement, family relationships, social support, financial matters, the home, family unit income, consumption, activities and expectations.31,32
Statistical analysisA descriptive study was undertaken of the clinical and sociodemographic characteristics of the sample using central tendency measurements and dispersion measurements for the quantitative variables and absolute and relative frequencies for the qualitative variables.
The association of each independent variable with the presence of depression was studied. Contrasts of the categorical variables were performed by using the Chi-squared test. Correlations were measured using Spearman's correlation coefficient (rs), and this was interpreted as follows: rs≤0.30 is a weak correlation; 0.30–0.50 is a moderate correlation, and rs≥0.50 is a strong correlation.
Due to the large size of the sample, the variables studied were always significant. To complement significance the size of the effect of differences were calculated. Cramer's V (V) was used to evaluate the magnitude of the effect of the difference between percentages, the values of which depend on the degrees of freedom, (1) gl1: weak (<0.30), moderate (0.30–0.49), strong (≥0.50); (2) gl2: weak (<0.20), moderate (0.21–0.34), strong (≥0.35), and (3) gl3: weak (<0.17), moderate (0.17–0.28), strong (≥0.29).38
To identify the variables associated with the dichotomic dependent variable (depression or no depression) binary logistic regression analysis was performed using the “backwards method: Wald”, entering first the variables of age, sex, marital status, educational level, work situation, physical health, exercise level, household unit, chronic diseases, type of activity, income and ELA difficulties.
To distinguish physical disease comorbidity more specifically the frequency of each disease was measured together with its relationship with depression.
Lastly, to compare depression in Spain with levels in other countries, comparative analysis was performed of prevalence using data from the other countries in SHARE. Weighted data were used for this, with the weightings supplied by SHARE in the specific “gv_weights” module that compensate for the probabilities of unequal selection of population parameters.32 The other calculations were not weighted.
The level of statistical significance for hypothesis contrasts was 0.05. Statistical analysis was performed using the SPSS v22.0 programme for Windows (SPSS Inc., Chicago, IL, USA).
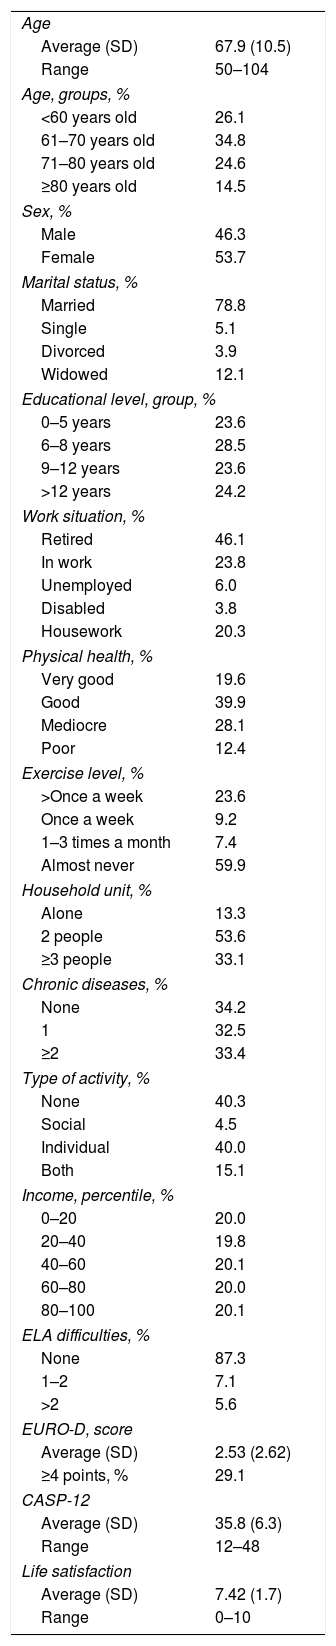
ResultsSample sociodemographic and clinical dataThe study sample was composed of 5830 participants. The average age was 67.9±10.5 years old, and slightly more women took part. 78.8% of the participants were either married or lived with their partner. The majority were retired. 59.5% of the participants stated that their physical health was good or very good, that they had few restrictions in their ELA, while 40.2% occasionally did physical exercise.
The percentage that surpassed the EURO-D cut-off point (≥4) was 29.1%, while the average score on the scale was 2.5±2.6. The average CASP-12 score showed a moderate perception of their quality of life. The complete data are shown in Table 1.
Clinical and sociodemographic variables (n=5830).
| Age | |
| Average (SD) | 67.9 (10.5) |
| Range | 50–104 |
| Age, groups, % | |
| <60 years old | 26.1 |
| 61–70 years old | 34.8 |
| 71–80 years old | 24.6 |
| ≥80 years old | 14.5 |
| Sex, % | |
| Male | 46.3 |
| Female | 53.7 |
| Marital status, % | |
| Married | 78.8 |
| Single | 5.1 |
| Divorced | 3.9 |
| Widowed | 12.1 |
| Educational level, group, % | |
| 0–5 years | 23.6 |
| 6–8 years | 28.5 |
| 9–12 years | 23.6 |
| >12 years | 24.2 |
| Work situation, % | |
| Retired | 46.1 |
| In work | 23.8 |
| Unemployed | 6.0 |
| Disabled | 3.8 |
| Housework | 20.3 |
| Physical health, % | |
| Very good | 19.6 |
| Good | 39.9 |
| Mediocre | 28.1 |
| Poor | 12.4 |
| Exercise level, % | |
| >Once a week | 23.6 |
| Once a week | 9.2 |
| 1–3 times a month | 7.4 |
| Almost never | 59.9 |
| Household unit, % | |
| Alone | 13.3 |
| 2 people | 53.6 |
| ≥3 people | 33.1 |
| Chronic diseases, % | |
| None | 34.2 |
| 1 | 32.5 |
| ≥2 | 33.4 |
| Type of activity, % | |
| None | 40.3 |
| Social | 4.5 |
| Individual | 40.0 |
| Both | 15.1 |
| Income, percentile, % | |
| 0–20 | 20.0 |
| 20–40 | 19.8 |
| 40–60 | 20.1 |
| 60–80 | 20.0 |
| 80–100 | 20.1 |
| ELA difficulties, % | |
| None | 87.3 |
| 1–2 | 7.1 |
| >2 | 5.6 |
| EURO-D, score | |
| Average (SD) | 2.53 (2.62) |
| ≥4 points, % | 29.1 |
| CASP-12 | |
| Average (SD) | 35.8 (6.3) |
| Range | 12–48 |
| Life satisfaction | |
| Average (SD) | 7.42 (1.7) |
| Range | 0–10 |
ELA: everyday life activities; CASP-12: quality of life (Control, Autonomy, Pleasure and Self-realisation); SD: standard deviation; EURO-D: depression scale.
Depression increased with age, with a higher proportion of cases in those above 80 years old. The presence of chronic diseases (CD) and functional deficits (FD) in ELA increased with age: <60 years old (CD=44.9%, FD=3.7%); 60–70 years old (CD=66.3%, FD=7.0%); 71–80 years old (CD=79.1%, FD=16.2%), and >80 years old (CD=80.0%, FD=36.4%).
Depression was more present in widowed individuals and those who lived alone than was the case for those who were married or lived in company.
It was more frequent in women, who were more likely to be widowed than the men (18.6% vs. 4.6%), and more of them lived alone than did the men (16.7% vs. 9.5%).
A lower educational level was associated with a higher frequency of depression, a greater presence of chronic diseases (76.0%) and income lower than percentile 50 (68.4%), as opposed to a higher educational level with fewer diseases (56.5%) and a higher income >50 p. (33.0%).
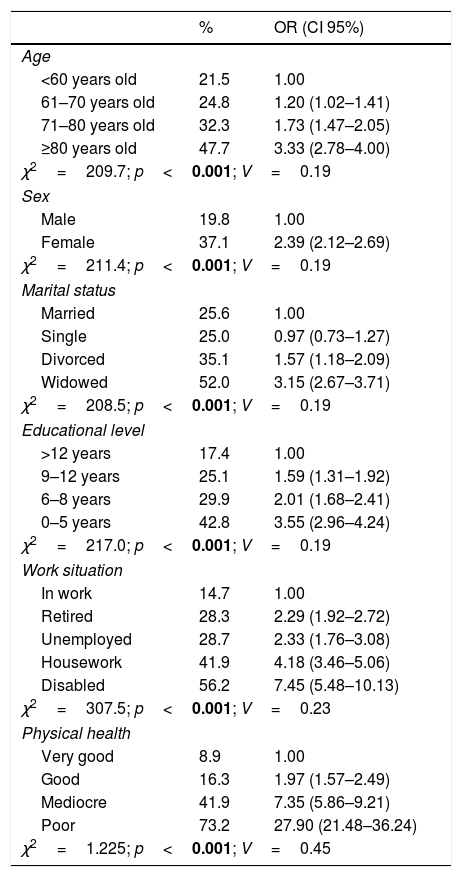
Poor perception of physical health, a lack of physical exercise, suffering 2 or more chronic diseases and difficulties in ELA were associated with greater depression. Likewise, not performing activities, a lower frequency of work activity and low economic income were also associated with greater depression.
The variables with a higher risk of depression (Odds ratio [OR]) were poor perception of physical health and difficulties in ELA. The complete data are shown in Table 2.
Characteristics associated with depression (≥4 EURO-D) in Spanish individuals older than 50 years old.
| % | OR (CI 95%) | |
|---|---|---|
| Age | ||
| <60 years old | 21.5 | 1.00 |
| 61–70 years old | 24.8 | 1.20 (1.02–1.41) |
| 71–80 years old | 32.3 | 1.73 (1.47–2.05) |
| ≥80 years old | 47.7 | 3.33 (2.78–4.00) |
| χ2=209.7; p<0.001; V=0.19 | ||
| Sex | ||
| Male | 19.8 | 1.00 |
| Female | 37.1 | 2.39 (2.12–2.69) |
| χ2=211.4; p<0.001; V=0.19 | ||
| Marital status | ||
| Married | 25.6 | 1.00 |
| Single | 25.0 | 0.97 (0.73–1.27) |
| Divorced | 35.1 | 1.57 (1.18–2.09) |
| Widowed | 52.0 | 3.15 (2.67–3.71) |
| χ2=208.5; p<0.001; V=0.19 | ||
| Educational level | ||
| >12 years | 17.4 | 1.00 |
| 9–12 years | 25.1 | 1.59 (1.31–1.92) |
| 6–8 years | 29.9 | 2.01 (1.68–2.41) |
| 0–5 years | 42.8 | 3.55 (2.96–4.24) |
| χ2=217.0; p<0.001; V=0.19 | ||
| Work situation | ||
| In work | 14.7 | 1.00 |
| Retired | 28.3 | 2.29 (1.92–2.72) |
| Unemployed | 28.7 | 2.33 (1.76–3.08) |
| Housework | 41.9 | 4.18 (3.46–5.06) |
| Disabled | 56.2 | 7.45 (5.48–10.13) |
| χ2=307.5; p<0.001; V=0.23 | ||
| Physical health | ||
| Very good | 8.9 | 1.00 |
| Good | 16.3 | 1.97 (1.57–2.49) |
| Mediocre | 41.9 | 7.35 (5.86–9.21) |
| Poor | 73.2 | 27.90 (21.48–36.24) |
| χ2=1.225; p<0.001; V=0.45 | ||
| % | OR (CI 95%) | |
|---|---|---|
| Exercise level | ||
| Once a week | 16.9 | 1.00 |
| >Once a week | 18.4 | 1.10 (0.85–1.44) |
| 1–3 times a month | 18.6 | 1.12 (0.80–1.56) |
| Almost never | 36.5 | 2.81 (2.22–3.56) |
| χ2=228.7; p<0.001; V=0.19 | ||
| Household unit | ||
| ≥3 people | 26.3 | 1.00 |
| 2 people | 27.0 | 1.03 (0.91–1.17) |
| Alone | 44.5 | 2.24 (1.88–2.66) |
| χ2=102.9; p<0.001; V=0.13 | ||
| Chronic diseases | ||
| None | 19.1 | 1.00 |
| 1 | 25.9 | 1.48 (1.27–1.72) |
| ≥2 | 42.5 | 3.13 (2.71–3.61) |
| χ2=275.3; p<0.001; V=0.21 | ||
| Type of activity | ||
| Both | 19.2 | 1.00 |
| Individual | 22.2 | 1.20 (0.99–1.46) |
| Social | 25.9 | 1.47 (1.06–2.03) |
| None | 39.8 | 2.78 (2.30–3.35) |
| χ2=225.9; p<0.001; V=0.19 | ||
| Income, percentile | ||
| 80–100 | 18.6 | 1.00 |
| 60–80 | 24.1 | 1.38 (1.13–1.69) |
| 40–60 | 29.9 | 1.86 (1.54–2.26) |
| 20–40 | 36.6 | 2.52 (2.08–3.05) |
| 0–20 | 36.4 | 2.50 (2.07–3.02) |
| χ2=138.7; p<0.001; V=0.15 | ||
| ELA difficulties | ||
| None | 23.0 | 1.00 |
| 1–2 | 64.0 | 5.93 (4.80–7.33) |
| >2 | 79.4 | 12.85 (9.75–16.95) |
| χ2=733.3; p<0.001; V=0.35 | ||
Values where p<0.05 are shown in bold type.
ELA: everyday life activities; CASP-12: Quality of life (Control, Autonomy, Pleasure and Self-realisation); EURO-D: depression scale (<4 EURO-D: no depression; ≥4 EURO-D: depression); CI: confidence of interval; OR: crude Odds ratio; V: Cramer's V; χ2: Chi-squared.
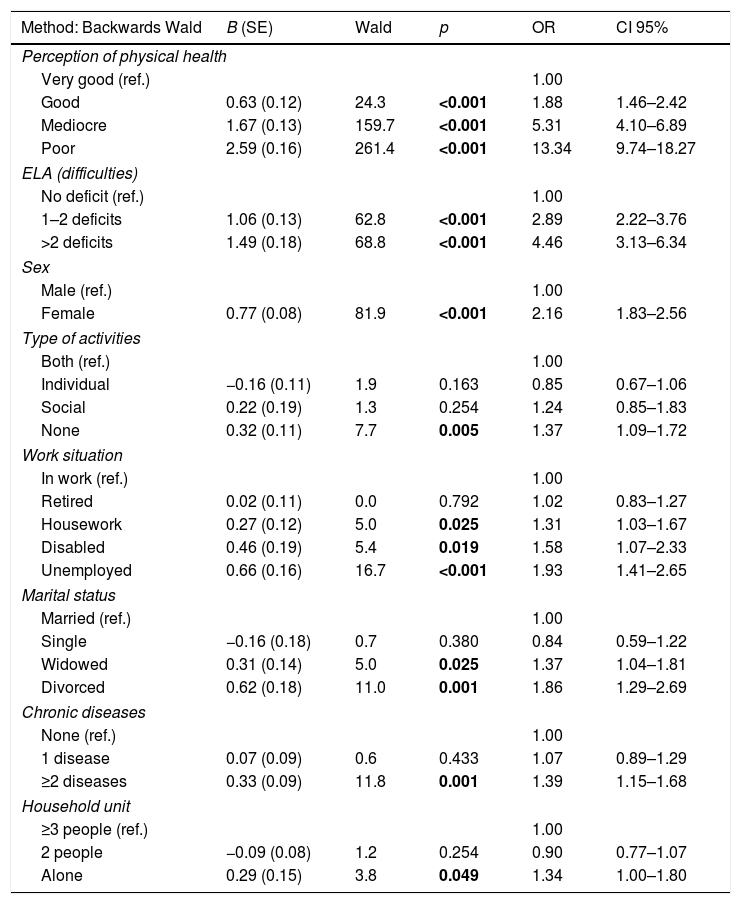
In the binary logistic regression model the variables with the greatest risk of depression were: poor physical health, difficulties in ELA, female sex, not performing activities, not working, not being married and presence of chronic diseases. The risk of depression increased notably with poor perception of physical health (OR=13.34; CI 95%: 9.74–18.27) and with more than 2 ELA difficulties (OR=4.46; CI 95%: 3.13–6.34) respecting the reference values for both variables. The complete results are shown in Table 3.
Binary logistic regression. Independent characteristics associated with depression.
| Method: Backwards Wald | B (SE) | Wald | p | OR | CI 95% |
|---|---|---|---|---|---|
| Perception of physical health | |||||
| Very good (ref.) | 1.00 | ||||
| Good | 0.63 (0.12) | 24.3 | <0.001 | 1.88 | 1.46–2.42 |
| Mediocre | 1.67 (0.13) | 159.7 | <0.001 | 5.31 | 4.10–6.89 |
| Poor | 2.59 (0.16) | 261.4 | <0.001 | 13.34 | 9.74–18.27 |
| ELA (difficulties) | |||||
| No deficit (ref.) | 1.00 | ||||
| 1–2 deficits | 1.06 (0.13) | 62.8 | <0.001 | 2.89 | 2.22–3.76 |
| >2 deficits | 1.49 (0.18) | 68.8 | <0.001 | 4.46 | 3.13–6.34 |
| Sex | |||||
| Male (ref.) | 1.00 | ||||
| Female | 0.77 (0.08) | 81.9 | <0.001 | 2.16 | 1.83–2.56 |
| Type of activities | |||||
| Both (ref.) | 1.00 | ||||
| Individual | −0.16 (0.11) | 1.9 | 0.163 | 0.85 | 0.67–1.06 |
| Social | 0.22 (0.19) | 1.3 | 0.254 | 1.24 | 0.85–1.83 |
| None | 0.32 (0.11) | 7.7 | 0.005 | 1.37 | 1.09–1.72 |
| Work situation | |||||
| In work (ref.) | 1.00 | ||||
| Retired | 0.02 (0.11) | 0.0 | 0.792 | 1.02 | 0.83–1.27 |
| Housework | 0.27 (0.12) | 5.0 | 0.025 | 1.31 | 1.03–1.67 |
| Disabled | 0.46 (0.19) | 5.4 | 0.019 | 1.58 | 1.07–2.33 |
| Unemployed | 0.66 (0.16) | 16.7 | <0.001 | 1.93 | 1.41–2.65 |
| Marital status | |||||
| Married (ref.) | 1.00 | ||||
| Single | −0.16 (0.18) | 0.7 | 0.380 | 0.84 | 0.59–1.22 |
| Widowed | 0.31 (0.14) | 5.0 | 0.025 | 1.37 | 1.04–1.81 |
| Divorced | 0.62 (0.18) | 11.0 | 0.001 | 1.86 | 1.29–2.69 |
| Chronic diseases | |||||
| None (ref.) | 1.00 | ||||
| 1 disease | 0.07 (0.09) | 0.6 | 0.433 | 1.07 | 0.89–1.29 |
| ≥2 diseases | 0.33 (0.09) | 11.8 | 0.001 | 1.39 | 1.15–1.68 |
| Household unit | |||||
| ≥3 people (ref.) | 1.00 | ||||
| 2 people | −0.09 (0.08) | 1.2 | 0.254 | 0.90 | 0.77–1.07 |
| Alone | 0.29 (0.15) | 3.8 | 0.049 | 1.34 | 1.00–1.80 |
R2 Nagelkerke=0.357.
Hosmer and Lemeshow test: χ2=9.6; p=0.293.
Correctly classified: 78.7%.
Dependent binary variable: 0=no depression (<4 EURO-D); 1=depression (≥4 EURO-D).
Values where p<0.05 are shown in bold type.
B: unstandardised coefficient; SE: standard error; CI: confidence of interval; OR: multivariate Odds ratio.
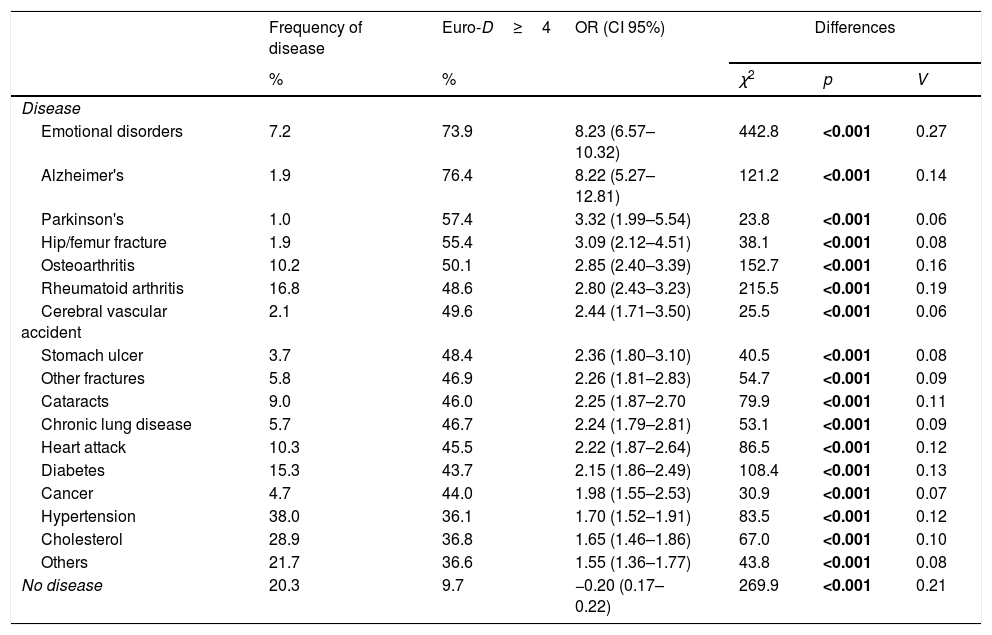
Given the importance of physical health for depression, the frequency of depression was evaluated for different diseases. The most common ones were hypertension, cholesterol, rheumatoid arthritis, diabetes, osteoarthritis and myocardial infarct.
Depression was more frequent in those participants with emotional disorders, Alzheimer's, Parkinson's, hip fracture and osteoarthritis. 20.3% of the sample had no relevant disease, and this was a protective factor against depression (OR=−0.20; CI 95%: 0.17–0.22) (Table 4).
Frequency of disease and association with depression.
| Frequency of disease | Euro-D≥4 | OR (CI 95%) | Differences | |||
|---|---|---|---|---|---|---|
| % | % | χ2 | p | V | ||
| Disease | ||||||
| Emotional disorders | 7.2 | 73.9 | 8.23 (6.57–10.32) | 442.8 | <0.001 | 0.27 |
| Alzheimer's | 1.9 | 76.4 | 8.22 (5.27–12.81) | 121.2 | <0.001 | 0.14 |
| Parkinson's | 1.0 | 57.4 | 3.32 (1.99–5.54) | 23.8 | <0.001 | 0.06 |
| Hip/femur fracture | 1.9 | 55.4 | 3.09 (2.12–4.51) | 38.1 | <0.001 | 0.08 |
| Osteoarthritis | 10.2 | 50.1 | 2.85 (2.40–3.39) | 152.7 | <0.001 | 0.16 |
| Rheumatoid arthritis | 16.8 | 48.6 | 2.80 (2.43–3.23) | 215.5 | <0.001 | 0.19 |
| Cerebral vascular accident | 2.1 | 49.6 | 2.44 (1.71–3.50) | 25.5 | <0.001 | 0.06 |
| Stomach ulcer | 3.7 | 48.4 | 2.36 (1.80–3.10) | 40.5 | <0.001 | 0.08 |
| Other fractures | 5.8 | 46.9 | 2.26 (1.81–2.83) | 54.7 | <0.001 | 0.09 |
| Cataracts | 9.0 | 46.0 | 2.25 (1.87–2.70 | 79.9 | <0.001 | 0.11 |
| Chronic lung disease | 5.7 | 46.7 | 2.24 (1.79–2.81) | 53.1 | <0.001 | 0.09 |
| Heart attack | 10.3 | 45.5 | 2.22 (1.87–2.64) | 86.5 | <0.001 | 0.12 |
| Diabetes | 15.3 | 43.7 | 2.15 (1.86–2.49) | 108.4 | <0.001 | 0.13 |
| Cancer | 4.7 | 44.0 | 1.98 (1.55–2.53) | 30.9 | <0.001 | 0.07 |
| Hypertension | 38.0 | 36.1 | 1.70 (1.52–1.91) | 83.5 | <0.001 | 0.12 |
| Cholesterol | 28.9 | 36.8 | 1.65 (1.46–1.86) | 67.0 | <0.001 | 0.10 |
| Others | 21.7 | 36.6 | 1.55 (1.36–1.77) | 43.8 | <0.001 | 0.08 |
| No disease | 20.3 | 9.7 | −0.20 (0.17–0.22) | 269.9 | <0.001 | 0.21 |
The values where p<0.05 are shown in bold type.
Odds ratio=1.00. The reference for each disease is not to have the specific disease, except in the final category (ref: having any disease).
EURO-D: depression scale (<4 EURO-D: no depression; ≥4 EURO-D: depression); CI: confidence of interval; OR: crude Odds ratio; V: Cramer's V; χ2: Chi-squared.
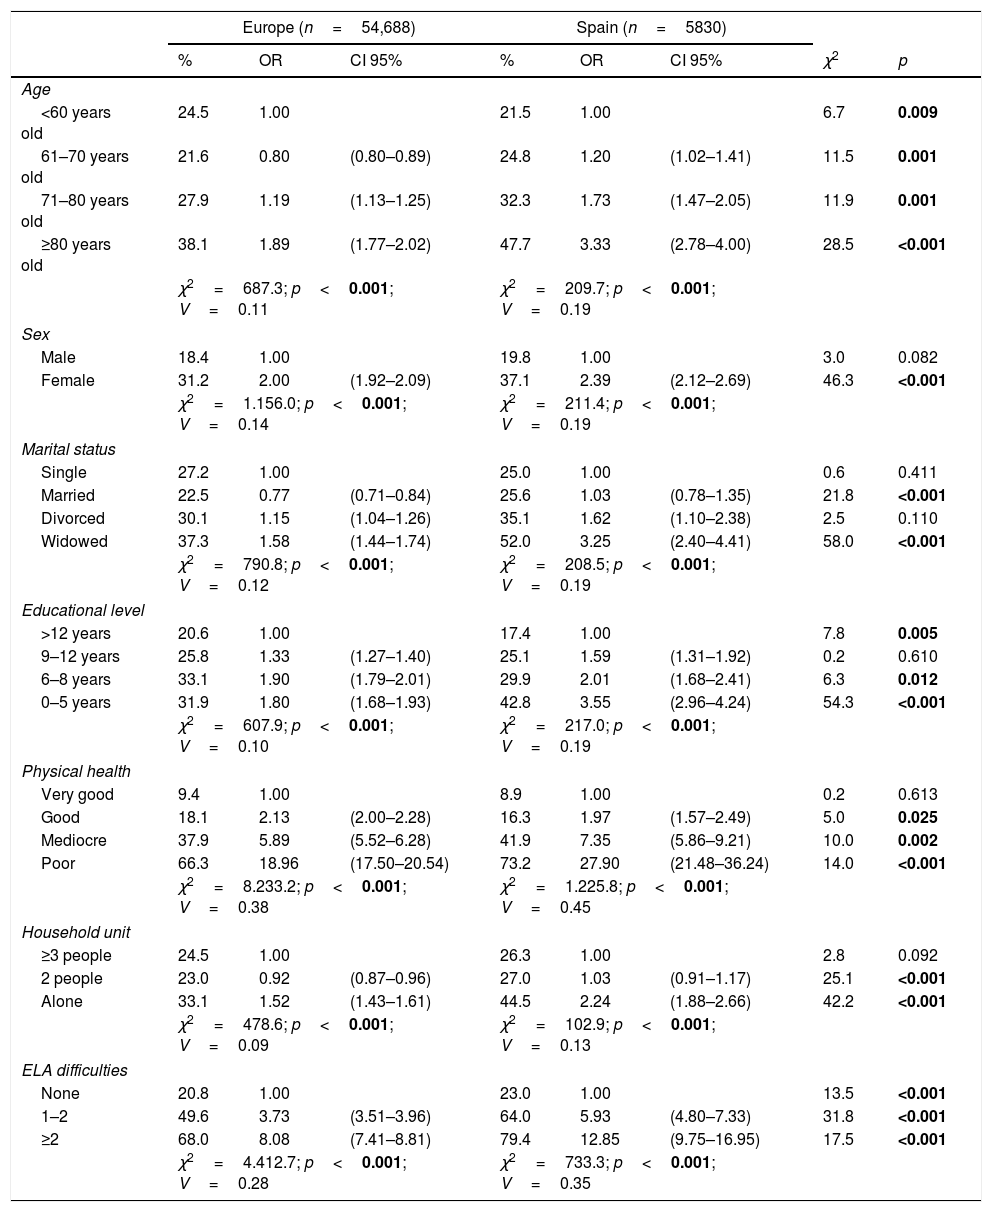
The total amount of depression in the sample was compared according to countries. This gave three groups of countries: (1) those with a percentage of depression at 20% or lower (Denmark, Switzerland, Israel, the Netherlands, Austria and Sweden); (2) those with percentages from 20 to 30% (Slovenia, Germany, The Czech Republic, Belgium, Luxemburg and Spain), and (3) those countries with rates higher than 30% (France, Italy and Estonia). Spain, which is in the second group, had a percentage of depression (29.3%) higher than the European average (27.9%) (Fig. 1).

Unlike the other countries in SHARE, Spain has a lower level of education (<9 years: 56.0% vs. 27.2%), worse perceived health (40.8% vs. 35.6%), more economic problems in reaching the end of the month (48.1% vs. 32.5%), lower pensions for individuals ≥65 years old (64.6% vs. 90.1%), the performance of fewer activities (64.8% vs. 85.5%) and less physical exercise (43.9% vs. 57.3%). Nevertheless, according to WHO data39 it has a lower rate of successful suicides in the 50–69 year old age group (9.6% vs. 20.0%) and in those ≥70 years old (13.9% vs. 22.0%).
When the frequency of depression in Spain and other European countries is compared, the presence of depression at the levels of all the variables was found to follow the same sequence, although percentages in the Spanish sample were higher. Most especially a low educational level (0–5 years), female sex, widowhood, living alone and older age were associated in the Spanish sample with a higher risk of depression (OR). The complete results are shown in Table 5.
Comparison between Europe and Spain. Depression (≥4 EURO-D).
| Europe (n=54,688) | Spain (n=5830) | |||||||
|---|---|---|---|---|---|---|---|---|
| % | OR | CI 95% | % | OR | CI 95% | χ2 | p | |
| Age | ||||||||
| <60 years old | 24.5 | 1.00 | 21.5 | 1.00 | 6.7 | 0.009 | ||
| 61–70 years old | 21.6 | 0.80 | (0.80–0.89) | 24.8 | 1.20 | (1.02–1.41) | 11.5 | 0.001 |
| 71–80 years old | 27.9 | 1.19 | (1.13–1.25) | 32.3 | 1.73 | (1.47–2.05) | 11.9 | 0.001 |
| ≥80 years old | 38.1 | 1.89 | (1.77–2.02) | 47.7 | 3.33 | (2.78–4.00) | 28.5 | <0.001 |
| χ2=687.3; p<0.001; V=0.11 | χ2=209.7; p<0.001; V=0.19 | |||||||
| Sex | ||||||||
| Male | 18.4 | 1.00 | 19.8 | 1.00 | 3.0 | 0.082 | ||
| Female | 31.2 | 2.00 | (1.92–2.09) | 37.1 | 2.39 | (2.12–2.69) | 46.3 | <0.001 |
| χ2=1.156.0; p<0.001; V=0.14 | χ2=211.4; p<0.001; V=0.19 | |||||||
| Marital status | ||||||||
| Single | 27.2 | 1.00 | 25.0 | 1.00 | 0.6 | 0.411 | ||
| Married | 22.5 | 0.77 | (0.71–0.84) | 25.6 | 1.03 | (0.78–1.35) | 21.8 | <0.001 |
| Divorced | 30.1 | 1.15 | (1.04–1.26) | 35.1 | 1.62 | (1.10–2.38) | 2.5 | 0.110 |
| Widowed | 37.3 | 1.58 | (1.44–1.74) | 52.0 | 3.25 | (2.40–4.41) | 58.0 | <0.001 |
| χ2=790.8; p<0.001; V=0.12 | χ2=208.5; p<0.001; V=0.19 | |||||||
| Educational level | ||||||||
| >12 years | 20.6 | 1.00 | 17.4 | 1.00 | 7.8 | 0.005 | ||
| 9–12 years | 25.8 | 1.33 | (1.27–1.40) | 25.1 | 1.59 | (1.31–1.92) | 0.2 | 0.610 |
| 6–8 years | 33.1 | 1.90 | (1.79–2.01) | 29.9 | 2.01 | (1.68–2.41) | 6.3 | 0.012 |
| 0–5 years | 31.9 | 1.80 | (1.68–1.93) | 42.8 | 3.55 | (2.96–4.24) | 54.3 | <0.001 |
| χ2=607.9; p<0.001; V=0.10 | χ2=217.0; p<0.001; V=0.19 | |||||||
| Physical health | ||||||||
| Very good | 9.4 | 1.00 | 8.9 | 1.00 | 0.2 | 0.613 | ||
| Good | 18.1 | 2.13 | (2.00–2.28) | 16.3 | 1.97 | (1.57–2.49) | 5.0 | 0.025 |
| Mediocre | 37.9 | 5.89 | (5.52–6.28) | 41.9 | 7.35 | (5.86–9.21) | 10.0 | 0.002 |
| Poor | 66.3 | 18.96 | (17.50–20.54) | 73.2 | 27.90 | (21.48–36.24) | 14.0 | <0.001 |
| χ2=8.233.2; p<0.001; V=0.38 | χ2=1.225.8; p<0.001; V=0.45 | |||||||
| Household unit | ||||||||
| ≥3 people | 24.5 | 1.00 | 26.3 | 1.00 | 2.8 | 0.092 | ||
| 2 people | 23.0 | 0.92 | (0.87–0.96) | 27.0 | 1.03 | (0.91–1.17) | 25.1 | <0.001 |
| Alone | 33.1 | 1.52 | (1.43–1.61) | 44.5 | 2.24 | (1.88–2.66) | 42.2 | <0.001 |
| χ2=478.6; p<0.001; V=0.09 | χ2=102.9; p<0.001; V=0.13 | |||||||
| ELA difficulties | ||||||||
| None | 20.8 | 1.00 | 23.0 | 1.00 | 13.5 | <0.001 | ||
| 1–2 | 49.6 | 3.73 | (3.51–3.96) | 64.0 | 5.93 | (4.80–7.33) | 31.8 | <0.001 |
| ≥2 | 68.0 | 8.08 | (7.41–8.81) | 79.4 | 12.85 | (9.75–16.95) | 17.5 | <0.001 |
| χ2=4.412.7; p<0.001; V=0.28 | χ2=733.3; p<0.001; V=0.35 | |||||||
Values where p<0.05 are shown in bold type.
ELA: everyday life activities; EURO-D: depression scale (depression: ≥4 EURO-D); CI: confidence of interval; OR: crude Odds ratio; V: Cramer's V; χ2: Chi-squared (contrast between categorical variables).
This study supplies updated data for a broad sample of individuals aged over 50 years old who are not institutionalised and live in Spain, for the variables associated with depression.
Previous studies show that the association between depression and functional disablement is more important than the link between depression and the perception of poor physical health.16,17 It is the existence of chronic diseases which cause and maintain functional disablement and the difficulty in performing ELA,18,19 as we found in the analysis of the frequency of depression and diseases in this study.
Depression increases with increasing age, and this factor is associated with an increase in chronic diseases and ELA deficits. These results are supported by other studies.12 Nevertheless, age is a controversial variable as some authors justify the lower rate of depression in older individuals by emphasising the psychological protection shown by older individuals as opposed to younger ones, which is due to their greater capacity for adaptation together with their wisdom and experience.40
It should be underlined that women suffer a higher rate of depression in association with higher percentages of widowhood, living alone and social isolation. Some authors observe that depression in women is accompanied by greater somatic symptoms. This is associated with their traditional family-centred role, greater emotional expressiveness and amplification of feelings.13,14
A lower educational level is associated with depression due to an increased number of chronic diseases. This is probably due to less care for their own health and a lower income. The relationship between a lower educational level and depression has been documented in several studies.6,28
Solitude increases the risk of depression23 and it is associated with poorer perceived mental health and lower self-esteem.24 Data in our study show greater depression in individuals who are widowed and live alone. The risk of depression is higher in individuals who are not married than it is for those who are divorced or widowed, and this may be attributed to social isolation, a reaction to internal unsatisfied needs,15 and/or a lack of interpersonal support.12 Previous studies hypothesise that a good emotional relationship protects against depression in the elderly, together with better performance in ELA, increased longevity and better perceived physical health.20,21
Active individuals suffer depression less often than those who are unemployed or disabled. These results are similar to those of other authors,15,26 who state that ceasing work increases the frequency of depression by up to two times, above all in cases of involuntary retirement. However, some studies show that retirement at the legal age considerably reduces the risk of suffering health problems, without its being associated with greater depression or poor cognitive function.27
Physical exercise and activities had a protective effect against depression. Undertaking activities favours the maintenance of cognitive performance and also reduces possible social isolation when interactive activities are carried out,25 as satisfaction with life increases.30 On the other hand, doing physical exercise has also been shown to improve well-being, leading to the perception of a higher quality of life.7,22
In comparison with the other countries that took part in the study, the results in Spain for depression are similar to the findings of other authors, as they too observe a higher prevalence in Italy, France and Spain. Castro-Costa et al.41 explain this increased prevalence by referring to factors resulting from factorial analysis of the EURO-D scale (suffering and motivation), underlining the higher impact of the “motivation” factor in these cases (pessimism, reduced interest, problems with concentration and loss of the capacity for enjoyment), as well as other aspects such as economic problems.
The lower suicide rate in Spain also has to be mentioned, even though the country has a more precarious welfare state and worse socio-economic indicators (less education, poorer perception of health, economic difficulties and lower pensions, etc.) than other European countries. Wu et al.42 refer to the stronger family system in southern European countries as the best protection against self-destructive behaviour.
Limitations and future lines of researchAn important limitation of this study was the data-gathering procedure of SHARE itself, which was based on participants’ own perceptions of their condition. For aspects such as difficulties with ELA and physical health, it would be useful to have a third-party opinion that would make it possible to establish an objective viewpoint and evaluate possible discrepancies.
On the other hand, cognitive aspects were not taken into account in this paper, in spite of the fact that cognitive performance influences and conditions the possible presence of depressive symptoms and vice versa.
An especially important area to be explored in future research would be suicidal behaviour and its associated factors, given that the differences in the rates among European countries are very notable.
ConclusionsThe variables associated with depression were chiefly poor physical health, difficulties in ELA and female sex. The diseases associated with the highest rates of depression were those which are neurodegenerative (Alzheimer's and Parkinson's), hip fracture, rheumatism and cerebral vascular accidents, all of which increase functional disablement.
Widowhood, not performing activities and a low educational level are also more closely associated with the presence of depression.
Given the depressive tendency associated with the decline of physical health, it would be necessary to improve adaptation to a reality that arises with age,17–19 improving self-perception and increasing self-care for health together with relationships and enjoyable social activities.
Ethical responsibilitiesThe protection of persons and animalsThe authors declare that no experiments were performed on human beings or animals for this research.
Data confidentialityThe authors declare that they followed the protocols of their centre of work regarding the publication of patient data.
The right to privacy and informed consentThe authors obtained he informed consent of the patients and/or subjects referred to in the paper. The corresponding author holds this document.
FinancingEuropean Commission 7th framework programme (SHARE M4, No. 261982). Project: SHARE (Survey of Health, Ageing and Retirement in Europe).
Conflict of interestsThe authors have no conflict of interests to declare.
This work uses data from SHARE «Wave 5 release 1.0.0», on 31 March 2015 (DOI: 10.6103/SHARE.w5.100). SHARE data gathering was mainly financed by the European Commission through the Fifth Framework Programme (project QLK6-CT-2001-00360 in the Quality of Life thematic programme), through the Sixth Framework Programme (projects SHARE-I3, RII-CT-2006-062193, COMPARE, CIT5-CT-2005-028857, and SHARELIFE, CIT4-CT-2006-028812) and through the Seventh Framework Programme (SHARE-PREP, No. 211909, SHARE-LEAP, No. 227822 and SHARE M4, No. 261982). Thanks are also given for additional financing by the U.S. National Institute on Ageing (U01 AG09740-13S2, P01 AG005842, P01 AG08291, P30 AG12815, R21 AG025169, Y1-AG-4553-01, IAG BSR06-11 and OGHA 04-064) and by the German Ministry of Education and Research as well as several national sources (see www.share-project.org to obtain a complete list of the financial institutions).
Please cite this article as: Portellano-Ortiz C, Garre-Olmo J, Calvó-Perxas L, Conde-Sala JL. Depresión y variables asociadas en personas mayores de 50 años en España. Rev Psiquiatr Salud Ment (Barc.). 2018;11:216–226.