


The Isthmus of Tehuantepec is the narrowest landmass between the Gulf of Mexico and the Pacific Ocean. It is known as an important stopover site and migration corridor for Nearctic-Neotropical migratory birds. We characterized nocturnal bird migration along the Pacific side of the isthmus with marine radar, and identified species with diurnal point counts during 5 fall seasons (2009–2013) at operational and proposed wind farms. We found significant differences in migratory traffic rates, flight directions, and flight altitudes among years and sites, but we also found patterns of similarity including flight directions heading to the southeast each season; migratory traffic rates peaking 3–4h after sunset and decreasing thereafter; flight altitudes increasing throughout the night; seasonal mean flight altitudes fluctuating between ∼520 and ∼720m above ground level (m agl); and <7% of detected targets flying below 100m agl. Our data suggest that migratory activity initiates around mid-September and peaks in mid-October. We identified 58 bird species of nocturnal migrants. Studies of nocturnal bird migration are important for understanding potential impacts from wind farms.
El istmo de Tehuantepec es la masa continental más estrecha entre el golfo de México y el océano Pacífico. Es conocido como sitio de descanso y corredor migratorio importante para aves migratorias neárticas-neotropicales. Nosotros caracterizamos la migración nocturna de aves en la vertiente del Pacífico del istmo utilizando un radar marino e identificamos especies utilizando puntos de conteo diurnos, durante 5 temporadas migratorias de otoño (2009-2013) desde distintos parques eólicos en operación y propuestos. Encontramos diferencias significativas en la tasa de flujo migratorio, direcciones y alturas de vuelo entre años y sitios, pero también encontramos patrones de similitud incluyendo direcciones de vuelo hacia el sureste cada temporada; tasas de flujo migratorio teniendo un pico 3-4h después de la puesta del sol y disminuyendo después; alturas de vuelo incrementando a lo largo de la noche; alturas de vuelo promedio en cada temporada fluctuando entre ∼520 y ∼720m sobre el nivel del suelo, y<7% de los blancos detectados volando por debajo de 100m sobre el nivel del suelo. Nuestros datos sugieren que la actividad migratoria se inicia a mediados de septiembre y tiene un pico a mediados de octubre. Identificamos 58 especies de aves que tienen hábitos migratorios nocturnos. Los estudios sobre migración nocturna de aves son importantes para entender posibles impactos de parques eólicos.
Almost half of the bird species that inhabit the US travel south to winter in the Neotropics every year (Rappole, Morton, Lovejoy, & Ruos, 1983). These include a wide range of taxonomic groups, from small passerines that depend on powered flight to raptors that use thermal wind updrafts for soaring flights (Gill, 2007). Differences in flight style between these 2 groups of birds are related to the time of day used for migration: while soaring birds (e.g., raptors) almost always migrate during daytime, powered fliers (e.g., passerines) are predominantly nocturnal migrants (Kerlinger, 1995).
Some migratory flyways used by Nearctic-Neotropical nocturnal migrants converge at the Isthmus of Tehuantepec (UNEP, 2009), the narrowest landmass between the Gulf of Mexico (GOM) and the Pacific Ocean (∼220km at its narrowest stretch). Located in southern Mexico, the Isthmus of Tehuantepec has been considered “an avenue for migrants moving between North and South America”, and both the GOM and Pacific lowlands are thought to be “important wintering areas for North American migrants” (Binford, 1989).
The Isthmus of Tehuantepec is part of the transitional area between the Nearctic and Neotropical realms (Ríos-Muñoz, 2013) with its local topography playing an important role in creating major differences between slopes. The Sierra Madre Oriental and Sierra Madre del Sur run parallel to the GOM and Pacific coastlines, respectively; these important ridgelines meet at the western side of the isthmus, continuing to the east under the name of Sierra Madre de Chiapas (Barber & Klicka, 2010) after being interrupted by a low elevation gap known as Chivela Pass. One of the characteristics that define the identity of each slope is a gradient in barometric pressure, which is consistently higher in the GOM throughout the year (Steenburgh, Schultz, & Colle, 1998). This promotes a constant flow of wind toward the Pacific through the Chivela Pass (Chelton, Freilich, & Esbensen, 2000), creating a rain shadow on the northward side of the mountain range, and promoting the establishment of rain forests in the GOM side of the isthmus (Rzedowski, 1990). In contrast, the Pacific side is characterized by a dryer climate and tropical deciduous forests (Conabio, 1998).
In the last decade, the Pacific side of the isthmus has gained much relevance due to its high potential for wind-energy production (Alemán-Nava et al., 2014; Elliott et al., 2003; Jaramillo & Borja, 2004), promoting avian studies on different topics (Villegas-Patraca, Cabrera-Cruz, & Herrera-Alsina, 2014; Villegas-Patraca, MacGregor-Fors, et al., 2012; Villegas-Patraca, Macías-Sánchez, Macgregor-Fors, & Muñoz-Robles, 2012), but few have been published regarding the flow of nocturnal migrants. Cabrera-Cruz, Mabee, and Villegas-Patraca (2013a) published the first reports on nocturnal bird migration for the area, derived from radar observations made from a single site during one fall season, but with no information on the species migrating through the area.
The objective of this study is to describe the patterns of nocturnal migratory traffic rates (MTR), defined as the number of targets passing across 1km of migratory front per hour (targets/km/h), flight directions, flight altitudes, and species of nocturnal migrants observed from the Pacific side of the Isthmus of Tehuantepec, within one of the most important Wind Resource Areas of Mexico (Alemán-Nava et al., 2014). For this, we used data collected with a single marine radar unit and point counts during 5 consecutive fall seasons (2009–2013), from different operational or proposed wind farms, under request by different wind-energy companies that were required to carry out environmental studies by the environmental authorities of Mexico. This work also aims to make public information that otherwise would remain in gray literature, informing society, conservation organizations, decision makers, and others interested in bird migration in the region.
Materials and methodsWe studied bird migration from different sites within the Wind Resource Area of the Isthmus of Tehuantepec, an area that extends from the Pacific Ocean coast northward approximately 60km, and approximately 60km to 80km from east to west (Elliott et al., 2003), centered approximately around the town of La Ventosa. The main vegetation type is a matrix of pastureland, sorghum crops, and fragments of tropical deciduous forest, which was the original vegetation type in the area (Muñoz-Jiménez, 2014).
We monitored nocturnal bird migration with the aid of a marine radar adapted as a mobile unit, operating during a different number of nights throughout 5 fall migratory seasons (2009–2013), and identified bird species with morning point counts. Our study sites were distributed around ∼17km route of coastal plain, delimited to the north by the Tolistoque ridgeline and to the south by the Laguna Superior (Fig. 1). Radar monitoring stations were located in flat terrain either within operational or proposed wind farms and in sites where surrounding vegetation acted as a partial radar fence to reduce ground clutter contamination.
. Sites with black dots (wind turbines) were operational wind farms at the time of our observations, sites without dots were being proposed for development. Black circles represent the 1.5km radius of radar range used during our observations, and black bars radiating from the center of the circles are the flight directions recorded from each site; bar length indicates the amount of data for each site. Data was pooled for sites that were monitored multiple years. The inset shows the state of Oaxaca in southern Mexico in light gray, and the Pacific side of the Isthmus of Tehuantepec enclosed by a black rectangle.")
Monitoring sites where we collected radar and point count data (gray polygons). Sites with black dots (wind turbines) were operational wind farms at the time of our observations, sites without dots were being proposed for development. Black circles represent the 1.5km radius of radar range used during our observations, and black bars radiating from the center of the circles are the flight directions recorded from each site; bar length indicates the amount of data for each site. Data was pooled for sites that were monitored multiple years. The inset shows the state of Oaxaca in southern Mexico in light gray, and the Pacific side of the Isthmus of Tehuantepec enclosed by a black rectangle.
Given that our radar monitoring was made under request by different wind-energy companies, each year we worked from different sites but always within the Wind Resource Area of the Pacific coastal plains of the isthmus. In 2009 and 2010, we monitored nocturnal bird migration from a single site throughout the season (La Venta II and Unión Fenosa, respectively), visiting each site daily during the whole field season. In 2011, 2012 and 2013 we had 3, 2 and 3 monitoring sites, respectively, and we alternated our daily visits among sites to conduct the observations because we only had 1 radar unit. For example, our first night of observations in 2011 was at La Venta II, the next night we visited Oaxaca 1, and the following night we visited Alesco; we repeated this sequence throughout the duration of our field season.
At the time of our observations, La Venta II was an operational wind farm whose area was composed by a matrix of pastureland, sorghum crops, and patches of deciduous dry forest (16°35′29.45″ N, 94°48′41.91″ W; 36m asl). In 2010, we worked at Unión Fenosa, at the time it was an area proposed for the development of a wind-energy project; most of its area was covered by deciduous dry forest but also had portions of pastureland (16°26′0.94″ N, 94°48′36.61″ W; 13m asl). In 2011 we worked in 3 sites: La Venta II, Alesco and Oaxaca 1; Alesco was an area proposed for wind-energy development covered mainly by deciduous dry forest and pastureland (16°27′28.24″ N, 94°54′36.54″ W; 5m asl); Oaxaca 1 was a wind farm on the final stage of construction (not operating yet), the area not occupied by service roads or service areas for wind turbines was covered by deciduous dry forest (16°33′42.60″ N, 94°42′42.93″ W; 39m asl). In 2012, we worked at La Venta II and Peñoles; the latter was an operational wind farm, with most of its area covered by deciduous dry forest (16°35′12.18″ N, 94°59′53.62″ W; 66m asl). In 2013, we worked in La Venta II, Oaxaca 1 and C.E. Santo Domingo; C.E. Santo Domingo was an operational wind farm with wind turbines intermixed with sorghum crops (16°30′31.82″ N, 94°46′27.76″ W; 22m asl); Figure 1 shows the location of our study sites, and the arrangement of wind turbines for those operational wind farms. Monitoring periods, as well as starting and ending dates of observations, differed each year (Fig. 2).

Every night, we moved the radar unit to the corresponding sampling location. We used a horizontal and vertical mode of radar operation to observe nocturnal bird migration, starting ∼45min after sunset during 6 1-h sampling sessions/night to cover the peak of nocturnal migratory activity (Gauthreaux, 1971; Mabee & Cooper, 2004; Mabee, Cooper, Plissner, & Young, 2006). Each 1-h session was subdivided into: (1) a 10-min period to adjust radar to the horizontal mode, (2) 10-min in horizontal mode to count targets with a manual counter, (3) 15-min in horizontal mode to record flight speeds and directions, (4) 10-min to switch radar to vertical mode, and (5) 15-min in vertical mode to record flight altitudes. This subdivision was necessary because data collection was done by hand in real time, and the operator could not perform all the actions at the same time. Following Mabee et al. (2006), we used a 1.5km radius of observation for both horizontal and vertical modes of operation. When the radar was operating in the vertical mode, the antenna was rotated vertically 90° with respect to the leveled radar. Each night, there were 1–2 radar observers operating the equipment.
We studied nocturnal bird migration with an X band marine radar (Model FR-1525 Mark 3, Furuno, Nishinomiya, Japan) mounted on a truck adapted as a mobile unit; a description of a similar radar laboratory can be found in Cooper, Day, Ritchie, and Cranor (1991) and Harmata, Podruzny, Zelenak, and Morrison (2000). The radar transmitted at a frequency of 9140MHz through a 2m-long slotted waveguide (antenna) with a maximum output of 25kW and was operated with a pulse length of 0.07μs. The display unit had a range resolution of 35m, and the antenna emitted a beam with a width of 1.23° (horizontal)×20° (vertical) with side lobes±10° (Furuno, 2002). The unit was powered with a low-noise electric generator. We estimated visually that ground clutter was <30% of the radar screen at every site.
We estimated the migratory traffic rate (MTR) from the count data; we also measured ground speeds (km/h) and flight directions (degrees) using a hand-held scale and inner compass from the radar monitor, and measured flight altitudes (m agl) with an index line from the monitor. We use the term ‘target’ to designate objects detected because radar does not allow unequivocal identification of vertebrates (Larkin & Diehl, 2012), and concurrent direct observations were not made to confirm the identity of targets. To minimize counting of non-bird targets (such as insects), we omitted small targets appearing at the center of the screen (within a 600-m radius of the radar station) flying at slow speeds (<24km/h), as slower speeds could not be accurately measured with our hand-held scale.
Flight speeds of bats partially overlap those of birds, mainly at the lower speeds (Hedenström, Johansson, & Spedding, 2009), so it was not possible to distinguish bats based solely on flight speed. We did not record targets with erratic flight patterns because they may have been foraging bats; migrating birds tend to have linear paths (Bruderer & Popa-Lisseanu, 2005). We acknowledge, however, that there could be some bats displaying a linear flight and similar speed to birds, considering that our study area harbors one of the highest bat diversities in Mexico (Santos-Moreno, 2014). Although passerines seem to migrate together (Moore, 1990), the distances between them (Larkin & Szafoni, 2008; Millikin, 2001) and the fixed 35m range resolution of our radar unit (Furuno, 2002) allowed us to assume that most of the targets were individual birds. All data were recorded manually into a laptop computer.
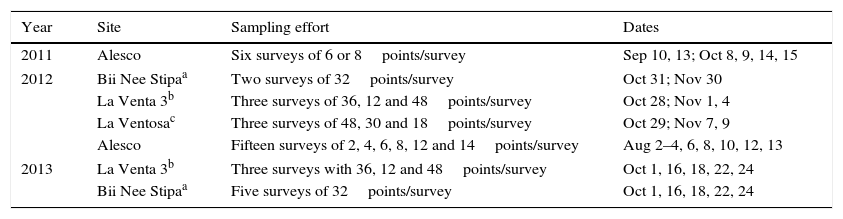
Point counts were conducted during some of the same seasons when our radar observations took place, and were also required by different wind-energy companies. Point counts were coordinated by our working team, but had a temporal design independent of our radar observations. The most consistent effort was made at the La Venta II wind farm, where 48 established point counts were covered every month from August through November 2009–2013. These point counts were covered during a different number of days each month, depending on factors such as weather and availability of technicians. Observations usually started around 6 am and ended around 11 am. Additional point counts were made between 2011 and 2013 at other wind farms or areas proposed for wind farm construction (Table 1). At each point, an experienced birder spent 5min identifying bird species within and beyond a 25-m radius, either visually or acoustically.
Point count sites, sampling effort, and dates where observations were made in the vicinity of our radar sites on the Pacific side of the Isthmus of Tehuantepec, Oaxaca, Mexico. Footnotes describe the status of the sites when point counts where conducted, and location reference.
| Year | Site | Sampling effort | Dates |
|---|---|---|---|
| 2011 | Alesco | Six surveys of 6 or 8points/survey | Sep 10, 13; Oct 8, 9, 14, 15 |
| 2012 | Bii Nee Stipaa | Two surveys of 32points/survey | Oct 31; Nov 30 |
| La Venta 3b | Three surveys of 36, 12 and 48points/survey | Oct 28; Nov 1, 4 | |
| La Ventosac | Three surveys of 48, 30 and 18points/survey | Oct 29; Nov 7, 9 | |
| Alesco | Fifteen surveys of 2, 4, 6, 8, 12 and 14points/survey | Aug 2–4, 6, 8, 10, 12, 13 | |
| 2013 | La Venta 3b | Three surveys with 36, 12 and 48points/survey | Oct 1, 16, 18, 22, 24 |
| Bii Nee Stipaa | Five surveys of 32points/survey | Oct 1, 16, 18, 22, 24 | |
Diurnal point counts were not intended as proof of identity for our radar targets, but rather as simple evidence of what species of Nearctic-Neotropical nocturnal migrants are present in the Pacific side of the Isthmus of Tehuantepec during fall migration.
Radar data were not corrected for differences in detectability with distance from the radar unit, hence all estimates are indices. To reduce data contamination by insects, we corrected ground speeds for airspeeds of every target recorded, deleting from analysis targets with corrected airspeeds slower than 7m/s because they were likely insects (Cabrera-Cruz, Mabee, & Villegas-Patraca, 2013b; Larkin, 1991). Wind data used to correct ground speeds was collected at ground level because higher-elevation measurements were not available; hence for vertical radar we estimated minimum airspeeds.
We analyzed flight directions using ‘circular’ (Agostinelli & Lund, 2013), a package of circular statistics in R (R Development Core Team, 2016). We report mean flight direction (μ) and the length of the mean vector or concentration parameter (r) which ranges from 0 to 1, where a large value indicated that observations were clustered more closely around the mean. We performed Watson–Williams F-tests to compare mean flight directions among sites and among seasons. Although concentration parameters (r) were not equal among years and sites, and Watson–Williams F-test assumes equality, this test is robust against deviation from these assumptions (Berens, 2009). We compared MTRs among years and hours of the night with repeated measures Anova tests, performed with the ‘nlme’ package (Pinheiro, Bates, DebRoy, & Sarkar, 2011) in R, specifying MTR as the dependent variable with hourly working sessions and years as categorical predictors. We report MTR as the mean (±1 SE) number of targets passing through a 1-km migratory front in 1h (targets/km/h). We fitted a generalized linear model to our flight altitudes data and used Tukey post hoc contrasts to compare flight altitudes among years. Flight altitudes are reported in meters above ground level (m agl). We used the function ‘gam’ from the package ‘mgcv’ (Wood, 2011) in R to fit generalized additive models (GAMs) to our MTR and flight altitude data as a function of session. We limited the use of GAMs to create graphical representations of the trend of MTR and flight altitudes across the night for each year. We applied a Z-score transformation to our data before fitting the models because GAM requires the data to be normally distributed. We compared flight altitudes among years by fitting a generalized linear model (GLM) indicating altitudes a response and year a predictor, and then performing a multiple comparison of means (Tukey) post hoc analysis. We did not compare MTR or flight altitudes among nights in 2011–2013 because during those years we worked in >1 site and data pooling was not possible given the significant differences in MTR among nights (see Results). For all analyses, we used data from nights with ≥5sessions/night.
The timing and duration of our field seasons were different each year, but the area covered within the isthmus remained constant, and our observations overlapped the peak of passerine migration for the GOM side of the isthmus: 22 September–01 November (Winker, 1995a). For comparisons among years, we used data collected only during October, a period from which all sites had data. From the point counts we only present a list of nocturnal migrants.
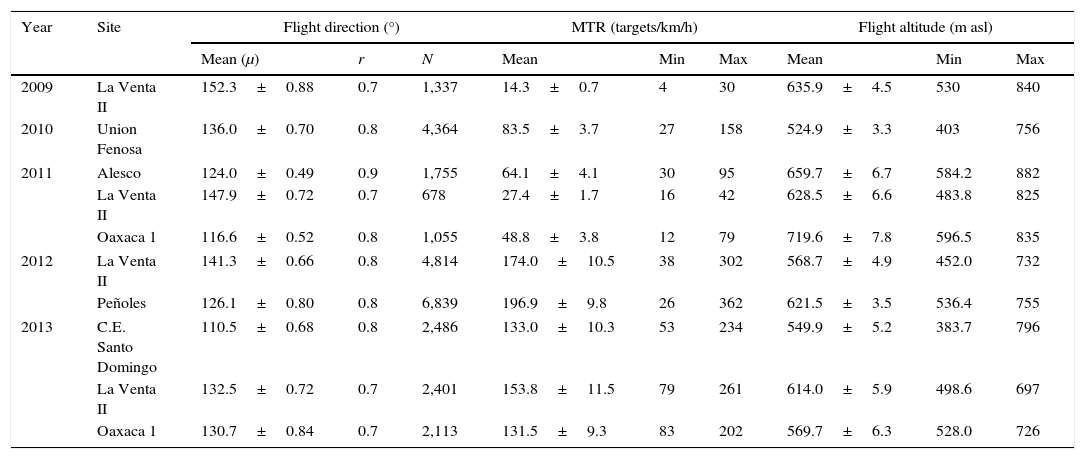
ResultsDuring the 5 fall seasons and at all sites, most recorded targets were flying to the southeast (Fig. 1, Table 2), with a high concentration around the mean direction (mean flight direction with all sites and years pooled=131°, r=0.75, N=27,842 radar targets). Seasonal mean flight direction was different among the 4 years monitored from La Venta II (2009 and 2011–2013; F3, 7200=47.47, p<0.001) and the 2 years monitored from Oaxaca 1 (2011 and 2013; F1, 2933=50.25, p<0.001, Table 2). It was also different among the 3 monitoring sites of 2011 (F2, 3485=193.57, p<0.001), the 2 sites of 2012 (F1, 11651=362.47, p<0.001) and the 3 sites of 2013 (F2, 6697=202.39, p<0.001; Table 2).
Mean seasonal values of flight direction, migratory traffic rate, and flight altitude for all years and sites (±1 SE). Under flight direction, r=length of the mean vector or concentration parameter, and N=number of targets sampled. Min and Max are seasonal means for each site.
| Year | Site | Flight direction (°) | MTR (targets/km/h) | Flight altitude (m asl) | ||||||
|---|---|---|---|---|---|---|---|---|---|---|
| Mean (μ) | r | N | Mean | Min | Max | Mean | Min | Max | ||
| 2009 | La Venta II | 152.3±0.88 | 0.7 | 1,337 | 14.3±0.7 | 4 | 30 | 635.9±4.5 | 530 | 840 |
| 2010 | Union Fenosa | 136.0±0.70 | 0.8 | 4,364 | 83.5±3.7 | 27 | 158 | 524.9±3.3 | 403 | 756 |
| 2011 | Alesco | 124.0±0.49 | 0.9 | 1,755 | 64.1±4.1 | 30 | 95 | 659.7±6.7 | 584.2 | 882 |
| La Venta II | 147.9±0.72 | 0.7 | 678 | 27.4±1.7 | 16 | 42 | 628.5±6.6 | 483.8 | 825 | |
| Oaxaca 1 | 116.6±0.52 | 0.8 | 1,055 | 48.8±3.8 | 12 | 79 | 719.6±7.8 | 596.5 | 835 | |
| 2012 | La Venta II | 141.3±0.66 | 0.8 | 4,814 | 174.0±10.5 | 38 | 302 | 568.7±4.9 | 452.0 | 732 |
| Peñoles | 126.1±0.80 | 0.8 | 6,839 | 196.9±9.8 | 26 | 362 | 621.5±3.5 | 536.4 | 755 | |
| 2013 | C.E. Santo Domingo | 110.5±0.68 | 0.8 | 2,486 | 133.0±10.3 | 53 | 234 | 549.9±5.2 | 383.7 | 796 |
| La Venta II | 132.5±0.72 | 0.7 | 2,401 | 153.8±11.5 | 79 | 261 | 614.0±5.9 | 498.6 | 697 | |
| Oaxaca 1 | 130.7±0.84 | 0.7 | 2,113 | 131.5±9.3 | 83 | 202 | 569.7±6.3 | 528.0 | 726 | |
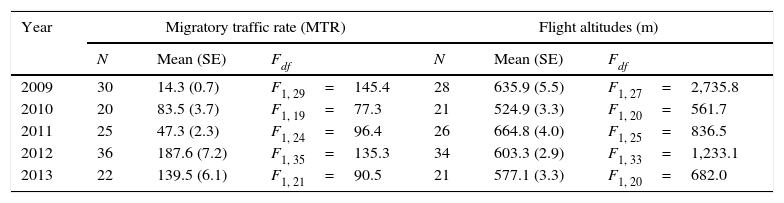
Migratory traffic rates (MTR). Seasonal mean MTR varied significantly among years (F4, 547=487.2; p<0.001, Fig. 3) ranging from ∼14targets/km/h in 2009 to ∼197targets/km/h in 2012 (Table 2). Mean nightly MTR varied significantly among nights in every year (Table 3, Fig. 4). Despite the different magnitude in MTR among years, data from 2012 suggest that migratory activity in the region began in mid-September, and peaked during mid-October (2009, 2010, 2013) or early November (2011, 2012; Fig. 4). Except for 2009, there was a typical curve in the migratory flow along the night, with MTR peaking ∼3–4h after sunset, and declining thereafter (Fig. 5).
 were pooled.")
Comparisons of mean migratory traffic rate (targets/km/h) and mean flight altitudes among nights within years. Standard Errors (SE) are shown in parenthesis. N=number of nights surveyed; p<0.001 in all cases.
| Year | Migratory traffic rate (MTR) | Flight altitudes (m) | ||||
|---|---|---|---|---|---|---|
| N | Mean (SE) | Fdf | N | Mean (SE) | Fdf | |
| 2009 | 30 | 14.3 (0.7) | F1, 29=145.4 | 28 | 635.9 (5.5) | F1, 27=2,735.8 |
| 2010 | 20 | 83.5 (3.7) | F1, 19=77.3 | 21 | 524.9 (3.3) | F1, 20=561.7 |
| 2011 | 25 | 47.3 (2.3) | F1, 24=96.4 | 26 | 664.8 (4.0) | F1, 25=836.5 |
| 2012 | 36 | 187.6 (7.2) | F1, 35=135.3 | 34 | 603.3 (2.9) | F1, 33=1,233.1 |
| 2013 | 22 | 139.5 (6.1) | F1, 21=90.5 | 21 | 577.1 (3.3) | F1, 20=682.0 |
, 2010=Union Fenosa, 2011=Oaxaca 1 (dark gray), La Venta II, Alesco (light gray), 2012=La Venta II, Peñoles (light gray); and 2013=La Venta II, Santo Domingo (light gray), Oaxaca 1 (dark gray).")
Mean migratory traffic rate+SE by date for each of the seasons from different monitoring sites on the Pacific side of the Isthmus of Tehuantepec. 2009=La Venta II (always black bars), 2010=Union Fenosa, 2011=Oaxaca 1 (dark gray), La Venta II, Alesco (light gray), 2012=La Venta II, Peñoles (light gray); and 2013=La Venta II, Santo Domingo (light gray), Oaxaca 1 (dark gray).

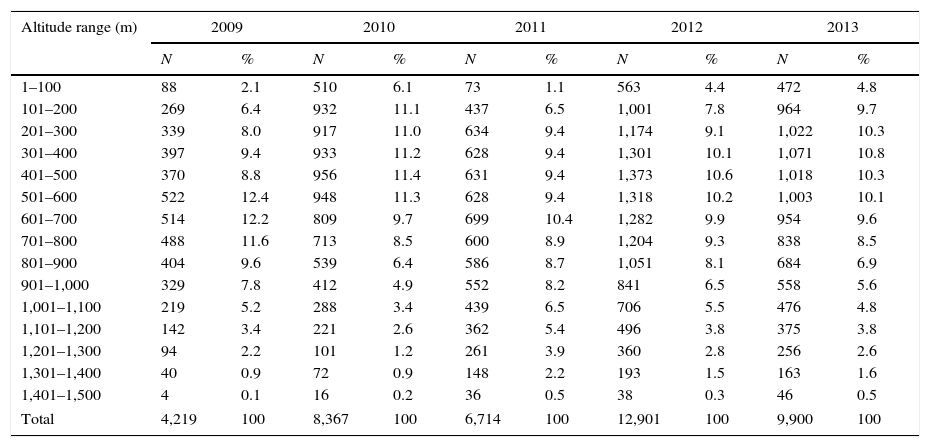
Each season, >50% of targets detected in vertical mode were concentrated between 200 and 600m agl, and<5% on average (range 1.1–6.1%) flew below 100m agl (Table 4, Fig. 6). Seasonal mean flight altitudes were always >500m agl (Table 2). Mean flight altitudes were significantly different among all years, except between 2012 and 2013 (z=1.15, p=0.775). Mean nightly flight altitudes varied significantly among nights each season (Table 3, Fig. 7). Every year; however, there was a pattern of increasing flight altitudes through the night and a variable pattern of increasing or decreasing at the end of our sampling period (Fig. 8).
Number and percentage of targets detected by 100m-flight altitude categories by year.
| Altitude range (m) | 2009 | 2010 | 2011 | 2012 | 2013 | |||||
|---|---|---|---|---|---|---|---|---|---|---|
| N | % | N | % | N | % | N | % | N | % | |
| 1–100 | 88 | 2.1 | 510 | 6.1 | 73 | 1.1 | 563 | 4.4 | 472 | 4.8 |
| 101–200 | 269 | 6.4 | 932 | 11.1 | 437 | 6.5 | 1,001 | 7.8 | 964 | 9.7 |
| 201–300 | 339 | 8.0 | 917 | 11.0 | 634 | 9.4 | 1,174 | 9.1 | 1,022 | 10.3 |
| 301–400 | 397 | 9.4 | 933 | 11.2 | 628 | 9.4 | 1,301 | 10.1 | 1,071 | 10.8 |
| 401–500 | 370 | 8.8 | 956 | 11.4 | 631 | 9.4 | 1,373 | 10.6 | 1,018 | 10.3 |
| 501–600 | 522 | 12.4 | 948 | 11.3 | 628 | 9.4 | 1,318 | 10.2 | 1,003 | 10.1 |
| 601–700 | 514 | 12.2 | 809 | 9.7 | 699 | 10.4 | 1,282 | 9.9 | 954 | 9.6 |
| 701–800 | 488 | 11.6 | 713 | 8.5 | 600 | 8.9 | 1,204 | 9.3 | 838 | 8.5 |
| 801–900 | 404 | 9.6 | 539 | 6.4 | 586 | 8.7 | 1,051 | 8.1 | 684 | 6.9 |
| 901–1,000 | 329 | 7.8 | 412 | 4.9 | 552 | 8.2 | 841 | 6.5 | 558 | 5.6 |
| 1,001–1,100 | 219 | 5.2 | 288 | 3.4 | 439 | 6.5 | 706 | 5.5 | 476 | 4.8 |
| 1,101–1,200 | 142 | 3.4 | 221 | 2.6 | 362 | 5.4 | 496 | 3.8 | 375 | 3.8 |
| 1,201–1,300 | 94 | 2.2 | 101 | 1.2 | 261 | 3.9 | 360 | 2.8 | 256 | 2.6 |
| 1,301–1,400 | 40 | 0.9 | 72 | 0.9 | 148 | 2.2 | 193 | 1.5 | 163 | 1.6 |
| 1,401–1,500 | 4 | 0.1 | 16 | 0.2 | 36 | 0.5 | 38 | 0.3 | 46 | 0.5 |
| Total | 4,219 | 100 | 8,367 | 100 | 6,714 | 100 | 12,901 | 100 | 9,900 | 100 |
 counted by flight height category (Y axis) in five different fall migratory seasons at the Pacific side of the Isthmus of Tehuantepec. Data was pooled from all sites for years when >1 site was monitored (i.e., 2010, 2011 and 2013).")
, recorded from different monitoring sites on the Pacific side of the Isthmus of Tehuantepec, Oaxaca, Mexico during five fall seasons.")

From observations made in 5 different wind farms, we compiled a list of 58 bird species known to have nocturnal migratory habits. Families best represented were Parulidae (13 species) and Scolopacidae (12 species). The most abundant species was the Dickcissel (Spiza americana), followed by the Scissor-tailed Flycatcher (Tyrannus forficatus; Table 5).
Absolute count of individual bird species with nocturnal migratory habits observed from different wind farms in the Pacific side of the Isthmus of Tehuantepec. Counts are combined from point counts across different years. Species are arranged from the most to the least abundant. BNS=Bii Nee Stipa, LVII=La Venta II, LV3=La Venta 3.
| Family | Species | BNS | LVII | LV3 | Ventosa | Alesco | Total |
|---|---|---|---|---|---|---|---|
| Cardinalidae | Spiza americana | 68 | 3,292 | 214 | 106 | 563 | 4,243 |
| Tyrannidae | Tyrannus forficatus | 352 | 3,167 | 372 | 292 | 4,183 | |
| Parulidae | Setophaga petechia | 59 | 418 | 64 | 78 | 3 | 622 |
| Icteridae | Molothrus ater | 355 | 355 | ||||
| Emberizidae | Chondestes grammacus | 52 | 16 | 21 | 134 | 223 | |
| Charadriidae | Charadrius vociferus | 13 | 95 | 53 | 19 | 180 | |
| Icteridae | Icterus spurius | 3 | 78 | 10 | 4 | 3 | 98 |
| Scolopacidae | Calidris minutilla | 6 | 60 | 66 | |||
| Tyrannidae | Tyrannus tyrannus | 53 | 53 | ||||
| Anatidae | Anas discors | 47 | 47 | ||||
| Cardinalidae | Passerina cyanea | 34 | 6 | 40 | |||
| Scolopacidae | Tringa solitaria | 9 | 25 | 34 | |||
| Emberizidae | Ammodramus savannarum | 11 | 8 | 9 | 2 | 30 | |
| Polioptilidae | Polioptila caerulea | 6 | 5 | 12 | 5 | 28 | |
| Scolopacidae | Calidris alba | 23 | 23 | ||||
| Caprimulgidae | Chordeiles minor | 21 | 21 | ||||
| Scolopacidae | Numenius phaeopus | 12 | 7 | 19 | |||
| Charadriidae | Charadrius semipalmatus | 14 | 14 | ||||
| Tyrannidae | Tyrannus verticalis | 7 | 3 | 2 | 12 | ||
| Parulidae | Icteria virens | 1 | 6 | 3 | 1 | 11 | |
| Icteridae | Icterus galbula | 8 | 2 | 10 | |||
| Scolopacidae | Phalaropus tricolor | 9 | 9 | ||||
| Cardinalidae | Passerina ciris | 6 | 2 | 8 | |||
| Parulidae | Cardellina pusilla | 8 | 8 | ||||
| Caprimulgidae | Chordeiles acutipennis | 7 | 7 | ||||
| Mimidae | Dumetella carolinensis | 5 | 1 | 6 | |||
| Vireonidae | Vireo griseus | 6 | 6 | ||||
| Parulidae | Setophaga magnolia | 5 | 5 | ||||
| Cuculidae | Coccyzus americanus | 4 | 4 | ||||
| Scolopacidae | Tringa semipalmata | 4 | 4 | ||||
| Parulidae | Cardellina canadensis | 4 | 4 | ||||
| Turdidae | Catharus ustulatus | 4 | 4 | ||||
| Parulidae | Setophaga ruticilla | 4 | 4 | ||||
| Scolopacidae | Actitis macularius | 1 | 1 | 1 | 3 | ||
| Scolopacidae | Calidris himantopus | 3 | 3 | ||||
| Scolopacidae | Calidris mauri | 3 | 3 | ||||
| Parulidae | Mniotilta varia | 1 | 1 | 2 | |||
| Scolopacidae | Limosa fedoa | 2 | 2 | ||||
| Ardeidae | Nycticorax nycticorax | 2 | 2 | ||||
| Parulidae | Setophaga citrina | 2 | 2 | ||||
| Parulidae | Oreothlypis celata | 1 | 1 | 2 | |||
| Tyrannidae | Empidonax minimus | 1 | 1 | ||||
| Scolopacidae | Limnodromus scolopaceus | 1 | 1 | ||||
| Cardinalidae | Pheucticus ludovicianus | 1 | 1 | ||||
| Cardinalidae | Piranga ludoviciana | 1 | 1 | ||||
| Cardinalidae | Piranga rubra | 1 | 1 | ||||
| Parulidae | Setophaga americana | 1 | 1 | ||||
| Parulidae | Setophaga coronata | 1 | 1 | ||||
| Scolopacidae | Tringa flavipes | 1 | 1 | ||||
| Caprimulgidae | Antrastotomus carolinensis | 1 | 1 | ||||
| Tyrannidae | Contopus sordidulus | 1 | 1 | ||||
| Tyrannidae | Contopus virens | 1 | 1 | ||||
| Ardeidae | Egretta tricolor | 1 | 1 | ||||
| Tyrannidae | Empidonax traillii | 1 | 1 | ||||
| Parulidae | Geothlypis formosa | 1 | 1 | ||||
| Vireonidae | Vireo gilvus | 1 | 1 | ||||
| Vireonidae | Vireo solitarius | 1 | 1 | ||||
| Parulidae | Setophaga virens | 1 | 1 | ||||
| Total | 567 | 7,689 | 698 | 716 | 747 | 10,417 | |
We found some general patterns in nocturnal bird migration characteristics such as: (1) flight directions heading to the southeast each year, (2) peak MTRs occurring during mid-October to early November, (3) MTRs generally peaking 3–4h after sunset and decreasing thereafter, (4) seasonal mean flight altitudes ranging between ∼520 and ∼720m agl, and (5) <7% of detected targets flying below 100m agl every year.
Countries in Central America are the center of winter distribution for Nearctic migrants (Rappole et al., 1983) consequently a southwards flight direction is expected during the fall migratory season in the Northern hemisphere. Faaborg et al. (2010) stated that the geographical position of South America to the east of North America results in many long-distance migrants heading southeast in the fall. Consistent with this, the mean flight directions we recorded were toward the southeast each season, with a concentration parameter always ≥0.6, indicating a strong directionality of the detected targets, as noted previously for the region (Cabrera-Cruz et al., 2013a).
However, seasonal mean flight directions were statistically different among sites within the same season and among sites across years but differed ≤20° in both cases. Mean directions headed toward the Pacific coastline, which might work as a leading line for migrating birds as it would not deviate them greatly from their direction of migration (Bruderer & Liechti, 1998). We consider that the significant statistical differences may not be biologically relevant within our study area, but a product of our large sample sizes (Royall, 1986). Furthermore, we consider that the differences in flight directions among sites within the same season might be explained locally by the different developmental status of the wind farms we worked in, or by the different number and arrangement of wind turbines (Desholm & Kahlert, 2005; Drewitt & Langston, 2006).
Migratory traffic rate (MTR). Considering that the Atlantic side of the isthmus is known to offer important refueling opportunities during stopover (Winker, 1995b) and that the isthmus is considered an avenue for migrants between the Atlantic and the Pacific slopes (Binford, 1989), we expected a high MTR in our study area, but from a continental perspective, our MTRs were lower than most others reported in some fall migratory studies done in eastern North America (NA) with a comparable method, including West Virginia (199–241 targets/km/h [Mabee et al., 2006]) and New York and Pennsylvania (>300–400targets/km/h [Johnston et al., 2013] and references therein). Nevertheless, our 2010–2013 MTR were higher than the MTR reported by Mabee and Cooper (2004) for 2 sites in western NA in northeastern Oregon and southeastern Washington (17–28targets/km/h).
Lower MTRs in the isthmus than in some of the above cited locations in NA may be at least partially explained by its southern location: while almost 50% of bird species inhabiting NA spend the winter in the Neotropics, it has been suggested that Western Mexico is the exclusive wintering location for the majority of western North American long-distance migratory land birds (Hutto, 1992). Hence it may be expected for the migratory flow to be lower because at least some migrants may have settled before reaching our study area, while some others might have followed a different route (Jahn et al., 2013).
Although the duration of our field seasons and the number of days monitored each fall was different every year, we compared mean seasonal MTR derived from data collected only during October, reducing the associated variability. Nevertheless, mean MTRs were significantly different among years, with ∼37targets/km/h as the lower difference in mean MTR between 2 consecutive years (2010 and 2011). The differences between our mean seasonal MTRs might be due to different reasons, including annual variation in populations, weather conditions (affecting the timing of migration), the different number of sites we monitored each season (affecting sampling effort) and their location. Given the nature of bird migration, which depends greatly on weather (Richardson, 1978, 1990), we expected and found significant differences in our comparisons of mean MTR among nights in all years.
We started our observations in early-October (2009, 2013), late-September (2011) and mid-September (2012), within months reported by Winker (1995a) as having an important rate of capture of migrant passerines in the GOM side of the isthmus. In contrast, our 2010 observations started in mid-October, after the peak of migratory activity on the GOM had passed. Although we are not sure that ‘GOM dates’ match with the migratory activity on the Pacific side of the isthmus, our results suggest higher migratory activity during October and early November, similar to the GOM side. What is less clear, however, is the typical level of activity early and late in the fall. Our observations in 2012 showed a lower level of activity during September, though; and in all seasons we ended our monitoring between 4 and 11 November, dates that coincided with an important drop in the rate of captures of migrant passerines in the Atlantic side (Winker, 1995a). Our results showed a decrease in MTR during early November in our 2009–2010 studies, and increase in MTR in the 2011 and 2012 studies, and a decreasing pattern in MTR in 2013 except for the last monitoring night when we recorded a sudden increase in mean MTR. Overall, our study suggests that the end of bird migration in the area is variable and might occur later in the season than was sampled during some years in our studies. Future studies would likely benefit from an earlier start (mid-September) and a later finish (mid to late November) to capture the full range of migratory movements.
Our mean MTR by session from 2010 to 2013 showed a similar pattern as other radar studies made with similar methods in fall migratory seasons, where target activity peaks after sunset (between 2130 and 2330, in this study), and declines thereafter (Gauthreaux, 1971; Harmata et al., 2000; Mabee et al., 2006). Year 2009 was completely different, however, with the highest mean MTR recorded during the first session and the lowest during the second session, possibly due to observer error.
Romero-Centeno, Zavala-Hidalgo, Gallegos, and O’Brien (2003) and Jaramillo and Borja (2004) showed that the mean wind speed in the region increases dramatically from September through February. Hence, the observed significant differences in mean flight altitudes among years and among nights within seasons may be due to differences in wind conditions, as it has been observed that wind profiles highly affect the selection of optimal flight altitudes by nocturnal migrants (Bruderer, Underhill, & Liechti, 1995; Dokter et al., 2011; Dokter, Shamoun-Baranes, Kemp, Tijm, & Holleman, 2013; Liechti, Klaassen, & Bruderer, 2000). Despite these differences, both seasonal and nightly mean flight altitudes were almost always >500m agl. Although no data exist for comparison in Mexico, this pattern is similar to that recorded in other areas of North America where most targets have been observed between 200 and 600m agl including central Alaska (77% of targets below 500m agl. [Cooper & Ritchie, 1995]), northeastern Oregon (mean=606 and 647m agl for 2 study sites [Mabee & Cooper, 2004]), California (means ranged between 329 and 479m agl across 4 sites [Johnston et al., 2013]), and West Virginia (mean=410m agl [Mabee et al., 2006]). Additionally, the seasonal percentage of targets flying at altitudes that could put them at risk of collision (≤100m agl, considering this as the mean altitude of wind turbines in the area) was <5% during 4 out of 5 seasons.
Peak flight altitudes of nocturnal migrants have been reported to occur before or near midnight, declining slowly until dawn (Mabee et al., 2006). In 4 of our 5 seasons, our mean flight altitudes peaked on the 4th or 5th session (2009, 2011–2013) and then decreased. There were ∼11h of nocturnal conditions per night during the 5 sampled seasons of this study, with observations starting between 7pm and 8pm; hence, in our 6-h seasons, the mean peak flight altitude was around midnight.
Due to the importance of the GOM side of the isthmus for migratory passerines, Winker (1995a, 1995b, 1995c) and Shaw and Winker (2011) analyzed the movement and fat storage of 19 migrant species, 7 of which were not recorded on our point counts (Cardellina citrina, Catharus minimus, Helmitheros vermivorus, Hylocichla mustelina, Myiarchus crinitus, Oporornis formosus, and Seiurus aurocapillus). All of the species studied by the above authors were identified by Estrada and Coates-Estrada (2005), who analyzed the diversity of migratory land birds in the GOM side of the isthmus, providing a list including 62 bird species with nocturnal migratory habits, 28 of which were identified in our point counts. Four of the species reported by Estrada and Coates-Estrada (2005) but not by us (S. aurocapillus, Parkesia noveboracensis, Vireo bellii, and V. flavifrons), had been recorded previously in the Pacific side (Hutto, 1992; Villegas-Patraca, MacGregor-Fors, et al., 2012).
Differences between bird species observed in the Atlantic and Pacific sides of the isthmus might be due to differences in migratory movements between birds from eastern and western NA (Kelly & Hutto, 2005). All of the coincident species between the Atlantic side and this study (except for Charadrius vociferous) are landbirds (mainly Parulidae, Tyranidae, Vireonidae and Cardinalidae), with the main differences arising from our inclusion of waterfowl, shorebird, and aquatic species (Anatidae, Scolopacidae and Ardeidae). However, there seems to be a high degree of movement from the GOM to the Pacific side during the fall migratory season.
Within our study area, Villegas-Patraca, MacGregor-Fors, et al. (2012) provided a list of 60 bird species recorded in La Venta II wind farm, including only 13 species with nocturnal migratory habits (Contopus cooperi, Empidonax traillii, Empidonax minimus, T. forficatus, Vireo flavoviridis, Polioptila caerulea, P. noveboracensis, Setophaga petechia, Mniotilta varia, Cardellina pusilla, S. americana, Icterus spurius, and I. galbula). Only 1 of these species (P. noveboracensis) was not observed in our point counts. Thus, our list includes a larger number of nocturnal migrants.
We acknowledge that there were several sources of variability in our data including: (1) the natural differences in migration characteristics among seasons, (2) differences in the surroundings of the monitoring sites (e.g., difference in forest cover among sites, distance to landscape features like ridgelines, water bodies, and towns), (3) the different developmental state of the study sites (i.e., pre- and post-construction), and (4) different extent of our observations. The first 3 points plus the significant differences we found in our comparisons of MTR and altitudes both among years and sites, suggest a need for specific studies to be made at every location where wind farms are being planned. We consider, however, that the statistical differences in flight directions and altitudes are not biologically meaningful but rather stem from our large sample sizes; hence it might be possible to use a single radar station for monitoring close sites. This might not be the case for MTRs, however, because the above mentioned differences in the surroundings of each site may influence not only the use of the area by migrant birds (Madsen & Boertmann, 2008), but also their detectability by the radar, as the presence of large metallic structures (e.g., wind turbines) can create ground clutter which may decrease the ability to detect targets (Larkin & Diehl, 2012), or obstruct radar signals/survey causing “shadow zones” where targets cannot be detected. Hence, it remains to be tested if the presence of wind farms, and their associated landscape features have an effect on the characteristics of bird migration in the area, something that would require a different study design (e.g., paired radar units).
Although Mexican laws require the wind-energy companies to carry out environmental assessments in order to authorize the construction of wind farms, as well as the monitoring of bird migration to keep track of environmental impacts, most of the information collected in the region has remained unavailable in unpublished reports. We consider that the results from such studies should be made public, as these contain not only the information that companies require to accomplish legal regulations, but also ecological data previously unknown for the region.
Authors wish to thank to the many field technicians that contributed collecting radar data, particularly to E. Ramírez-Almaza, R. López-Polanco, J.L. Ponce-Ramos, E. Hernández-Salazar and O. Muñoz-Jiménez. During 2008–2010, S.A.C.C. was supported with a scholarship from the Consejo Nacional de Ciencia y Tecnología. We thank the Comisión Federal de Electricidad, Gas Natural Fenosa, Peñoles, and Alesco, who kindly allowed using part of their data for this publication. Thanks to G. Alva-Álvarez and M. Mora-Acosta who helped to make Figure 1 during different stages of this manuscript. Thanks to Gudmundur A. Gudmundsson for his comments on an earlier version of this manuscript, and to two anonymous reviewers for improving this final version.
Peer Review under the responsibility of Universidad Nacional Autónoma de México.