


Maps have become a key tool to guide priorities for biodiversity conservation, the maintenance of ecosystem services, but much less so for critical action against further service loss in critical areas. Biological invasions are important disruptors of ecosystem services given that they directly or indirectly affect human well being, as they are an important cause of biodiversity loss worldwide and interfere with the provision of many ecosystem services. Here, we propose a general model to identify regions where the probability of plant invasion is higher and can cause and/or aggravate negative effects upon ecosystems. We then apply the general model to Mexico. Our model of probability of invasion considers 4 main variables: propagule availability, vegetation type, anthropic disturbance and native plant species richness. We calculated an invasion risk index combining all factors. We produced 5 maps, one for each variable and another constructed with our model of combined risk, for a grid of 0.5° × 0.5° grid across the whole country. We validated our model with State level data on exotic plants per State and obtained a significant correlation (r= 0.73, p< 0.001) between our invasion risk index derived from the model and the observed density of exotic species. Areas with greater susceptibility to invasion are closer to large human settlements and to areas of intensive agriculture. Very high risk corridors and islands were detected in our maps, as well very high risk areas in high diversity regions such as Chiapas and the Puebla-Veracruz border where we suggest attention should be focused. Our model although simple, provides a useful tool for policy design to detect areas within a specific region or country where biotic invasions are likely to have a large effect. Locating these areas is important in order to maximize return on monetary and human resources and to minimize damaging effects of plant invasions.
El desarrollo de mapas se ha convertido en una herramienta clave para el mantenimiento de los servicios ecosistémicos; sin embargo, ha sido poco utilizada para prevenir la pérdida de estos. Las invasiones bióticas son consideradas como agentes de perturbación debido a que ocasionan importantes pérdidas en la biodiversidad e interfieren con la provisión de servicios. Este trabajo propone un modelo regional para detectar áreas con alta probabilidad de invasión por plantas. El modelo se parametriza y se valida para México considerando 4 variables: disponibilidad de propágulos, tipo de vegetación, disturbio antrópico y riqueza de plantas nativas. Obtuvimos 5 mapas para México, uno para cada factor y otro más con el resultado del modelo de probabilidad de invasión (cuadrícula 0.5° × 0.5°). Validamos nuestro modelo contra la densidad de exóticas por estado y obtuvimos una correlación significativa (r= 0.73, p< 0.001). Las regiones con mayor susceptibilidad de invasión estuvieron cercanas a grandes ciudades y grandes extensiones agrícolas, pero también a regiones con alta biodiversidad, como Chiapas y la frontera entre Puebla y Veracruz.
Nuestro modelo, a pesar de ser simple, provee una herramienta útil para diseñar políticas públicas para detectar áreas con alta probabilidad de invasión y maximizar los recursos financieros y humanos.
Mapping has become a key tool to guide priority action. Recent literature shows an increasing interest in mapping ecosystem services (Martínez-Harms & Balvanera, 2012). The identification of priority areas for maintaining the provision of ecosystem services and for exploring potential synergies or conflicts between biodiversity conservation and that of ecosystem services (Martínez-Harms & Balvanera, 2012; Turner et al., 2007) has relied on this approach. Also, recent emphasis has been put on how much ecosystems have been impacted by human enterprise (Ellis & Ramankutty, 2008; Halpern et al., 2008). Such maps are critical for identifying areas where restoration, for instance, is most urgently needed.
Maps to guide priority action in the prevention and management of invasive species are scarce (Chytry et al., 2009; Mgidi et al., 2007; Nel et al., 2004; Rouget et al., 2004). Invasive species are an increasing threat to human wellbeing and to ecosystems in general. Mapping invasibility, defined as the overall susceptibility of sites to invasion (Williamson, 1996), could become key tools to guide urgent preventive actions. Invasive species can cause severe shifts in ecosystems, leading to native species extinctions, to substantial economic loss, reductions in the ability to provide ecosystem services and threats human health (Mack & Erneberg, 2002; Pimentel, Zuniga, & Morrison, 2005). Today species invasions are considered as the second cause of biodiversity loss, just behind land use change (Leung et al., 2002; Vitousek, D´Antonio, Loope, & Westbrooks, 1996). Big shifts in native species composition have been documented in South Africa, Australia and the USA, where approximately 400 of the 958 species that are listed as threatened or endangered are considered to be at risk because of competition-with and predation by non indigenous species (Pimentel, Lach, Zuniga, & Morrison, 2000). Species invasions also cause substantial economic losses; Pimentel et al. (2005) have calculated that in the US alone over $120 billion are spent due to species invasions whereas Colautti, Bailey, van Overdijk, Amudsen, and MacIsaac (2006) estimated that Canada is losing $187million Canadian per year. Other countries such as Mexico do not have sufficient information about the effects of non- indigenous species on the economy, but few plant and fish species cause severe losses (Aguirre-Muñoz et al., 2009; Espinosa-García & Vibrans, 2009; Espinosa-García, Villaseñor, & Vibrans, 2009).
Invasion research is ripe for the development of invasion risk maps to guide priority action. An increasing amount of empirical data available on invasive species, in many parts of the world (NLWRA, 2007; Rejmánek & Randall, 2004; Stohlgren, Barnet, & Kartesz, 2003; Villaseñor & Espinosa-García et al., 2004Espinosa-García, 2004) and the drivers underpinning invasibility have been widely studied (Arriaga, Castellanos, Moreno, & Alarcón, 2004; ems Chytry et al., 2009; Chytry et al., 2012; Deutschewitz, Lausch, Künh, & Klotz, 2003; Pino, Font, Carbó, Jové, & Pallares, 2005; Stohlgren et al., 2006). On the other hand, niche-based predictions have been employed to project future distribution of individual invasive species (Arriaga et al., 2004; Zimmerman et al., 2011). Yet, this approach is extremely data intensive and action cannot wait until such information is gathered for all possible invasive species in most countries.
Invasion risk maps to guide priority action that can be produced with readily available information are urgent for most countries. This is particularly true for the case of Mexico for various reasons. First, it is a highly diverse country with little public and governmental awareness of the threats of the biological invasions (Espinosa-García, 2009), thus, information on areas where invasive species could have a significant negative effect on ecosystems and human societies are urgently needed (IMTA, TNC, Conabio, Aridamerica, & GECI, 2008). Second, there are well-known examples of how invasives are having a strong effect upon biodiversity, ecosystems and human-well being (Pejchar & Mooney, 1999), e. g. the exotic water hyacinth (Eichhornia crassipes) (Martínez-Jiménez & Gómez-Balandra, 2007; Pérez-Panduro, 1998) and the Itchgrass (Rottboellia cochinchinensis), considered to be one of the worst weeds in the world (Esqueda-Esquivel, 2005; Holm, Plucknett, Pancho, & Herberger, 1977; Medina-Pitalúa & Domínguez-Valenzuela, 2001). Third, ongoing research has already explored what are the most important factors associated with the presence of invasive species in Mexico as well as their relative importance at the country level (Espinosa-García, Villaseñor, & Vibrans, 2004; Villaseñor & Espinosa-García et al., 2004 Espinosa-García, 2004).
In this manuscript we developed a conceptual model and a simple analytical procedure based on readily available information for mapping invasibility. We apply the model to the case of the whole Mexican country, and use empirical data to validate our model. We then discuss how much was gained from this approach and what are its limitations. We also discuss how useful this map could be for other countries beyond Mexico.
Materials and methodsThe conceptual modelFour main factors have been found to be among the most important for plant invasions into a spatially explicit model of invasibility (Chytry et al., 2008; Eschruth & Battles, 2009; Lonsdale, 1999).
Propagule availability regulates the frequency of arrival events and the amount of seeds or individuals of a given exotic species arriving to a particular place. Propagule availability has been linked with local roads and highways, and invasion by exotic plants has been shown to be facilitated by the proximity to roads in wetlands (Choi & Bury, 2003) and semiarid grasslands (Gelbard & Belnap, 2003); the importance of such roads in the maintenance of invasive populations and as a conduit for their dissemination is widely accepted (Christen & Matlack, 2009; Forman, 2000; Gelbard & Belnap, 2003). Furthermore, roads are associated with habitat destruction, which paves the way for invasions (Forman & Alexander, 1998). Also, human activity favors accidental introductions and deliberate plantings of ornamental or domesticated plant species that may become feral (Mack & Erneberg, 2002). Thus towns and cities and road edges become repositories of non-native species and sources of propagules that are dispersed by vehicle adhesion at short or long distance (von der Lippe & Kowarik, 2007; Wichman et al., 2009).
Invasibility depends on habitat characteristics or biophysical conditions. Some systems have been suggested to be more prone to species invasions than others, yet the reasons behind these trends are still not well understood; also, it is known that habitat type interacts with other invasion drivers (Vila, Pino, & Font, 2007; Vila et al., 2008). It is very difficult to infer pattern from process, and invasibility as a habitat property is confounded with propagule pressure and the attributes of the invading species themselves (Lonsdale, 1999). Nevertheless habitat is a better correlate of the level of plant invasion than isolated environmental variables (Chytry et al., 2008; Lonsdale, 1999).
The disturbance regime has also been recognized to be one of the main factors promoting plant species invasions (Daehler, 2003; Espinosa-García et al., 2004; Vila et al., 2007). The larger the departure from the natural disturbance regime (i.e. habitat transformation), the larger the non-native species richness (Chytry et al., 2008; Daehler, 2003; Espinosa-García et al., 2004).
Invasibility is also related to native plant richness (Chytry et al., 2008). Very consistent correlations across the world have shown a very robust positive correlation between native species richness and non-native species richness, particularly at large spatial scales (e. g., Espinosa-García et al., 2004; Lonsdale, 1999; Stohlgren et al., 2003).
Applying the conceptual model to mapping invasion risk in MexicoUsing the arguments presented above we developed an invasion risk model, parametrized it for Mexico and validated the model. Parameterization involved: i) calculating values for propagule availability (road and population density), biophysical conditions (habitat type), disturbance regime (habitat transformation), and native species richness for spatial units in all the country; ii) calculating an invasion risk index adding up all factors, and iii) mapping the resulting predicted values. Validation then involved testing the predictions with independent empirical data gathered at a larger spatial scale than the one used for modeling. Lastly, we refined the model according to the test.
Calculating values for each variableThe territory of Mexico was divided into 861 quadrats of 0.5° × 0.5° where the values of the 4 variables were recorded. Quadrats of regular size are widely used in biodiversity analysis at country and world-wide geographic scales (e. g. Ellis and Ramankutty, 2008). The calculation of the different variables is detailed below.
- 1)
Propagule availability index (PAI). Given that propagule availability is related to anthropogenic activity and to roads, we assumed that highest population densities and highest road densities were predictors of highest anthropogenic activity, which in turn would contribute to highest propagule availability. We calculated a PAI proxy as the population density (log density) per quadrant multiplied by road density (log roads/ha), converted to positive number and then normalized. Road density was obtained from Secretaría de Comunicaciones y Transportes map (SCT, 2008) and population densities were obtained from Mexican population census (Inegi, 2005b).
- 2)
Biophysical condition index (BCI). The conditions that can potentially contribute to establishment and performance of exotic species were assessed using a potential vegetation map of Mexico proposed by Rzedowski (1978) that employs 9 vegetation categories. Such potential vegetation categories were ranked from 1 (less invasible) to 9 (highly invasible) based on general conclusions from previous investigations (Holdgate, 1986; Lonsdale, 1999) and from an assessment coordinated by F. J. Espinosa-García. We used the following categories and ranking (in parenthesis the relative coefficient of invasibility assigned to each vegetation type): wet tropical forest (1), subtropical wet forest (2), cloud forest (3), deciduous tropical forest (4), temperate forest (5), thorn forest (6), aquatic vegetation (7), scrubland (8) and pasture (9). We calculated the area covered by each vegetation type per quadrant, multiplied by the corresponding vegetation ranking and added these up to have one number per cell. Since we wanted to keep our model as simple as possible, and the ranking among land cover classes with an interval scale is practically impossible for the entire country of Mexico, we decided to use our ordinal scale as a proxy of an interval scale. We did not find a more parsimonious option to do the ranking.
- 3)
Disturbance index (DI). We assessed habitat disturbance through intensity of land transformation. Land use and land cover information was obtained from the most recent and most detailed vegetation and land use map from Mexico (Inegi, 2005a). Land use and land cover categories were clumped into 8 groups, and each group was assigned a coefficient of disturbance (between 1 and 7); we assumed that the more heavily transformed the more severe the change in the disturbance regime relative to conserved conditions, and thus the highest the probability of suffering invasions from exotic species. The coefficients were chosen from an expert assessment. From low to high intensity, categories (in parenthesis the coefficients) were: primary vegetation (1), secondary vegetation (2), forests plantations (3), induced pastures (4), rain-fed agriculture (5), intensive irrigated agriculture (6) and human settlements (7). For each quadrant we calculated the surface covered by of each land use type, multiplied it by the coefficient assigned and added them up for each quadrant considering all land use types within it.
- 4)
Species richness index (SRI). Species richness of flowering plants was estimated using the best available floristic database for Mexico that contains herbarium records, the World Network for Biodiversity Information (Red Mundial de Información sobre Biodiversidad, REMIB; http://www. conabio.gob.mx/remib). To refine the obtained richness values, the database for which 1° × 1° grid (as reported in Villaseñor, Maeda, Rosell, & Ortiz, 2007) was modified using Asteraceae and Fabaceae richness values that have been calculated and validated (Villaseñor et al., 2007). The total species number included in our model is 2,848 Asteraceae and 1,543 Fabaceae. While the Villaseñor database is available for a 0.5° × 0.5° grid, it has been most widely used for the 1° × 1° grid to avoid noise from unsampled or incompletely sampled cells. Thus, to maintain data accuracy we used this layer of information based on a 1° × 1° grid and not for a 0.5° × 0.5° grid as we did with the other 3 layers.
- 5)
Invasion risk index (IRI). Our final index was a combination of the 4 variables. Although we know these may not be equivalent, we decided not to assess a differential contribution to each one since there is no agreement upon which is more determinant of plant invasion (Chytry et al., 2008; Eschruth & Battles, 2009; Lonsdale, 1999). Values obtained for each of the 4 variables were normalized assigning the highest score to 1 and the lowest score to 0 to generate an equivalent scale among variables. We ended up with the following index:

We calculated an index per each cell of the grid and produced a final invasibility map of 0.5° × 0.5° for Mexico. Different layers were incorporated using Arcgis 9.3 (ESRI). Because all the 4 variables are normalized to the unit, and the sum of the indices magnitude was also normalized, the theoretical values of IRI runs from 0 through 1, a higher value of the IRI indicates a site with a higher degree of invasibility.
Model validation and refiningTo validate our model we used a readily available database on the density of recorded plant exotics per state from Villaseñor and Espinosa-García (2004). We calculated the mean invasion risk index per Mexican State, based on the data of all grid cells found within such state. We then correlated our predicted values with actually observed ones. Based on these values, we decided to optimize our model by removing the BCI component from the IRI. We recalculated the new average IRI per state without the BCI and correlated it again with the observed density of non-native plants per state. We explored the contributions of each of the components of the IRI to the final IRI for each grid cell to assess for potential overrepresentation of any of these components.
ResultsEmerging patternsThe map produced to assess propagule availability of invasive species (PAI) showed the highest scores close to large urban centers like México City, Monterrey, Guadalajara and Tijuana (Fig. 1A).
, Usage index map based on human population density and road densities; B), biophysical conditions index map based on the Rzedowski´s potential vegetation categories (1978); C), disturbance index map based on land use types, and D), species richness index map for Mexico (SI) based on a 1° × 1° grid. The square on the left-down corner of each map is a zoom of the Mexico City and adjacent areas.")
Variables for the invasion risk model. Maps showing the 4 variables used to construct the invasion risk model for a 0.5° × 0.5° grid in Mexico. A), Usage index map based on human population density and road densities; B), biophysical conditions index map based on the Rzedowski´s potential vegetation categories (1978); C), disturbance index map based on land use types, and D), species richness index map for Mexico (SI) based on a 1° × 1° grid. The square on the left-down corner of each map is a zoom of the Mexico City and adjacent areas.
The map of the biophysical conditions that promote invasibility (BCI; vegetation types) showed a different pattern. Northern Mexico appears more prone to invasion followed by central Mexico and the Pacific Coast following this index (Fig. 1B).
The disturbance index (DI) map also showed the highest score in cells situated in the proximity of cities but regions with technified agriculture like the Veracruz plateau and the Sinaloa fields also scored high. Places with the lowest scores were Baja California Sur and the Chihuahuan desert that are dominated by primary vegetation (Fig. 1C).
The species richness (SRI) map showed a concentration of high species richness in the southern portion of the country with 2 additional hotspots in the Nuevo León-Tamaulipas southern border and in the Sonora-Chihuahua-Sinaloa border (Fig. 1D).
The final invasion risk (IRI) map (Fig. 2) showed that central Mexico appears to be the area with highest risk. Invasion probability is also concentrated close to large urban centers such as Tijuana, Monterrey and Guadalajara. Surprisingly, Southern Chiapas, northern Oaxaca and central Veracruz scored high due to the role played by species richness.
 to 1 (high invasibility) and thus areas in red are potentially more invaded than areas in yellow.")
Many very high invasion risk (VHIR) areas (II= 0.62-1) appeared isolated, while VHI corridors are evident along the Neo-volcanic belt (Estado de México, Distrito Federal, Hidalgo, Puebla, Tlaxcala and Veracruz) for temperate areas. The Neo-volcanic belt has other VHIR areas in Michoacán, Jalisco and Colima, neighboring with high invasion risk (HIR) (II= 0.40- 0.61) areas. If these HIR cells were to change their status to VHIR, then the whole Neo-Volcanic belt would have 2 of the most important commercial seaports at every end: Manzanillo and Veracruz. Seaports, airports and border-crossing terrestrial ports function as gateways for invasive species. Once established, these species disperse easily along corridors such as those formed by VHIR areas.
There is another VHIR corridor for wet tropical lowlands of southern Veracruz, Chiapas and Tabasco, with the Veracruz seaport at the north extreme and several border terrestrial ports at the southeastern extreme. The temperate Chiapas highlands appear very highly invasible, but they are not connected with other temperate VHIR areas.
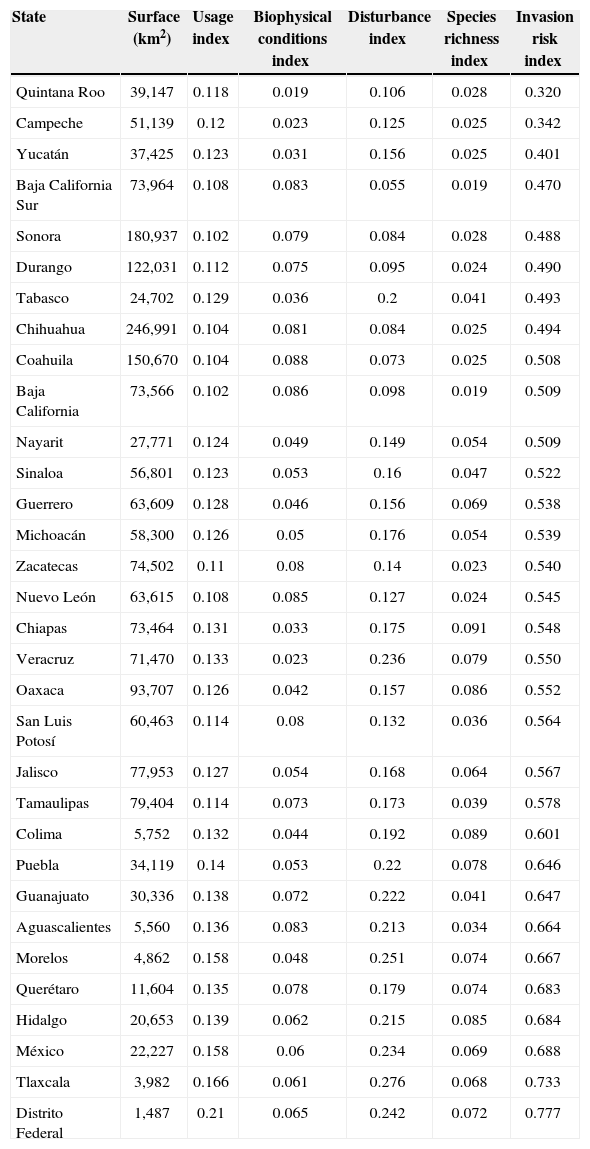
Testing the predictions with empirical data and refining the modelIn our predicted index values at the State level (Table 1), we found that Distrito Federal and Tlaxcala had the highest indices (0.77 and 0.53, respectively) while Quintana-Roo and Campeche had the lowest (0.32 and 0.34 respectively).
Mean values of the invasion risk index and its 4 components calculated for all Mexican States, also showing land surface (km2) for reference. Values go from 0 to 1
| State | Surface (km2) | Usage index | Biophysical conditions index | Disturbance index | Species richness index | Invasion risk index |
|---|---|---|---|---|---|---|
| Quintana Roo | 39,147 | 0.118 | 0.019 | 0.106 | 0.028 | 0.320 |
| Campeche | 51,139 | 0.12 | 0.023 | 0.125 | 0.025 | 0.342 |
| Yucatán | 37,425 | 0.123 | 0.031 | 0.156 | 0.025 | 0.401 |
| Baja California Sur | 73,964 | 0.108 | 0.083 | 0.055 | 0.019 | 0.470 |
| Sonora | 180,937 | 0.102 | 0.079 | 0.084 | 0.028 | 0.488 |
| Durango | 122,031 | 0.112 | 0.075 | 0.095 | 0.024 | 0.490 |
| Tabasco | 24,702 | 0.129 | 0.036 | 0.2 | 0.041 | 0.493 |
| Chihuahua | 246,991 | 0.104 | 0.081 | 0.084 | 0.025 | 0.494 |
| Coahuila | 150,670 | 0.104 | 0.088 | 0.073 | 0.025 | 0.508 |
| Baja California | 73,566 | 0.102 | 0.086 | 0.098 | 0.019 | 0.509 |
| Nayarit | 27,771 | 0.124 | 0.049 | 0.149 | 0.054 | 0.509 |
| Sinaloa | 56,801 | 0.123 | 0.053 | 0.16 | 0.047 | 0.522 |
| Guerrero | 63,609 | 0.128 | 0.046 | 0.156 | 0.069 | 0.538 |
| Michoacán | 58,300 | 0.126 | 0.05 | 0.176 | 0.054 | 0.539 |
| Zacatecas | 74,502 | 0.11 | 0.08 | 0.14 | 0.023 | 0.540 |
| Nuevo León | 63,615 | 0.108 | 0.085 | 0.127 | 0.024 | 0.545 |
| Chiapas | 73,464 | 0.131 | 0.033 | 0.175 | 0.091 | 0.548 |
| Veracruz | 71,470 | 0.133 | 0.023 | 0.236 | 0.079 | 0.550 |
| Oaxaca | 93,707 | 0.126 | 0.042 | 0.157 | 0.086 | 0.552 |
| San Luis Potosí | 60,463 | 0.114 | 0.08 | 0.132 | 0.036 | 0.564 |
| Jalisco | 77,953 | 0.127 | 0.054 | 0.168 | 0.064 | 0.567 |
| Tamaulipas | 79,404 | 0.114 | 0.073 | 0.173 | 0.039 | 0.578 |
| Colima | 5,752 | 0.132 | 0.044 | 0.192 | 0.089 | 0.601 |
| Puebla | 34,119 | 0.14 | 0.053 | 0.22 | 0.078 | 0.646 |
| Guanajuato | 30,336 | 0.138 | 0.072 | 0.222 | 0.041 | 0.647 |
| Aguascalientes | 5,560 | 0.136 | 0.083 | 0.213 | 0.034 | 0.664 |
| Morelos | 4,862 | 0.158 | 0.048 | 0.251 | 0.074 | 0.667 |
| Querétaro | 11,604 | 0.135 | 0.078 | 0.179 | 0.074 | 0.683 |
| Hidalgo | 20,653 | 0.139 | 0.062 | 0.215 | 0.085 | 0.684 |
| México | 22,227 | 0.158 | 0.06 | 0.234 | 0.069 | 0.688 |
| Tlaxcala | 3,982 | 0.166 | 0.061 | 0.276 | 0.068 | 0.733 |
| Distrito Federal | 1,487 | 0.21 | 0.065 | 0.242 | 0.072 | 0.777 |
The synthetic invasion risk index we developed appears to be a good predictor of how many introduced plant species have been found in a State. We found a good correlation between recorded introduced plant species by State and the predicted invasion risk index we propose (Fig. 3A; r=0.73, t(1,30)= 5.88, p< 0.001). The correlation was clearly improved by using the new Invasion Risk Index that does not include the BCI component (Fig. 3B, r= 0.82, t(1,30)=8.11, p< 0.001).
, Invasion risk Index using all the variables; B), index without the index for biophysical conditions (BCI) based on vegetation type.")
Invasion risk index vs. Introduced species density. Correlation between mean invasibility per state and actual density of introduced species per state from Espinosa-García et al., 2004. A), Invasion risk Index using all the variables; B), index without the index for biophysical conditions (BCI) based on vegetation type.
In order to check if the specific contribution of any component of the IRI to the final IRI was not biased towards one of them, we identified those cells where any component contributed in more than 50%, more than 75% and more than 90% to any cell (supplementary material). We found that propagule availability index contributes more than 50% and less than 75% of our final index in 33.4% of cells, the disturbance index contributes more than 50% and less than 75% of our final index in 9.9% of cells and S index contributes more than 50% and less than 75% of our final index only in 1.85% of cells. Also the PA index only contributes more than 75% in 1% of cells, D index only contributes more than 75% in 0.8% of cells and S index do not contribute more than 75% in any cell. Only the disturbance index contributed in 90% in 0.6% of cells (5 cells).
DiscussionMaps for invasion risk at a country level are rare and in this work we present an approach to build them. Our model provides a tool to identify sites with a high potential abundance of exotic plant species, and where the problem of invasive species could be causing great harm to ecosystems, as well as economic losses and threats to human health.
We detected a pattern of very high invasion risk corridors that are potentially useful to set monitoring and control priorities for Mexico. Also Mexican urban areas, among other highlighted areas in the southeast, appear as hotspots for invasion. This information is useful to report to policy makers (both local and national) in order to concentrate efforts and economic resources in high scored areas to monitor and eradicate dangerous invasive species.
Previous efforts of mapping invasibility in Europe (Chytry et al., 2009; Deutschewitz et al., 2003) also showed high invasibil ity areas close to urban centers and predicted high invasibility in lowland areas contrasting with low invasibility in the boreal and mountain regions across the continent. Climate, habitat and landscape diversity, and man-induced disturbance are the most important factors explaining alien diversity in Spain (Pino et al., 2005), Great Britain (de Albuquerque, Castro-Díez, Rodríguez, & Cayuela, 2011), and USA (Guo, Rejmánek, & Wen, 2012). However a recent study on future plant invasion patterns in Europe (Chytry et al., 2012) found that levels of invasion will likely increase in northern Europe. In Mexico there is only 1 study concentrating on the probability of invasion by Buffel grass, showing that the probability of invasion is concentrated in northern Mexico (Arriaga et al., 2004).
Real plant invasion threat may in fact be larger than that shown in our maps. Given that plant species richness is a predictor of invasibility, and that large areas in Mexico are not well explored botanically, we could be underestimating the threat, turning prevention action in key areas as important to attack potential areas where invasion could be larger than shown in our model.
Our model showed very high correlations between our predicted values and the observed ones, especially when the information about biotic conditions (vegetation type) was removed. Correlations found in other studies for validating predictive ecosystem services maps with readily available data can be as low as 0.13 for poor fits (Bowker et al., 2008Bowker, Miller, Belnap, Sisk, & Johnson, 2008) and starting at 0.3 for barely adequate fit, to 0.5 to 0.7 for excellent fits (Bowker et al., 2008; Eigenbrod et al., 2010). Much higher correlations could not be expected given that not all States have been equally sampled. States with higher invasion risk show the greatest density of reported exotic plants (i. e. Distrito Federal, Tlaxcala, Hidalgo, Mexico). Therefore our model appears to be a good predictor for number of invasive plants at the state level in Mexico.
The model validation performed may be limited by the resolution used. While validation at the 0.5° × 0.5° grid level would be needed, no data was available. On the other hand, it is well known that resolution can change results from models based on proxys, as has been observed for the case of ecosystem services (Eigenbrod et al., 2010). Nevertheless, in this case our model had the highest resolution, and was then averaged for each state for the validation. It has been shown that predictive maps for ecosystem services have low error at broad resolutions (e. g. grids cells that are 20km wide), such as the ones used here (ours are 25Km wide), but not so much at finer scales (e. g. 2km wide).
The model developed here may be useful for other countries or regions, but we strongly suggest that sensitivity analyses for each particular site and supporting empirical data will be important for decision making along with mapping services for conservation.
The invasion risk map presented here has limitations, as most models based on proxies can have, particularly since some exotic species introduced on purpose are not always regarded as harmful and different stakeholders may have different appreciations of the same situation (Talliset al., 2012). For example in northern Mexico there is a conflict of interests with the exotic Cenchrus ciliaris (Buffel grass) since it is highly appreciated by ranchers because it provides large quantities of fodder in very dry areas. Yet, this species promotes fire, causing native species displacement or even extinction that concern conservationists (Arriaga et al., 2004; Búrquez, Millar, & Martínez-Irízar, 2002; Franklin et al., 2006). Such conflicts cannot be predicted here.
This model, considers all species to be equivalent on their impacts on ecosystems, a highly unlikely scenario. It has been well established that some species act as ecosystem engineers (sensuJones, Lawton, & Shackak, 1994) therefore altering ecosystem dynamics in essential features while other do not have great impact on ecosystems. For example invasion by saltcedar (Tamarix ramosissima) in northern Mexico may have exacerbated outcomes because it can alter water flow of large areas along the riverbanks (Zavaleta, 2000). On the other extreme, weeds that live in small populations could add biodiversity without altering ecosystem dynamics (Espinosa-García et al., 2004). Yet, considering the whole load of exotic plants is supported by the fact that there is a good correlation between the number of exotic plant species present in a particular site and the number of noxious exotic plant species (Rejmánek & Randall, 2004).
The information provided by this map can guide action in a country with incipient information about invasive plant species. Raising awareness on government and society of key highlighted areas is much needed. The mapping initiative presented in this paper provides a framework to evaluate invasion risk at regional scales. Our invasion risk model simplified to 3 variables that are easily obtained, give good estimations of exotic plant species densities at the state level in Mexico. Since species invasions are believed to be the second cause of biodiversity loss globally, the cause of many economic losses and impacts on the human welfare, our model could be used as a tool to prioritize resources where invasion risk is high and material resources are limited.
AcknowledgementsWe would like to express our gratitude to Urani Carillo for help with data processing; Heberto Ferreira, Alberto Valencia and Atzimba López provided logistical support to enable communication and data sharing among the co-authors. Conabio funded this research through project FQ003 to P. Balvanera. P. Balvanera ackowledges PASPA-UNAM for sabbatical fellowship.