


Chamaedorea alternans is a palm species that has suffered from selective extraction, and habitat loss. We collected 11 populations from fragmented and conserved forest. We assess genetic variation of C. alternans, genetic exchange, differentiation, bottlenecks, effective population size and signals of natural selection. Genetic diversity was higher in conserved than in fragmented forest but not significant. Fragmentation did not play a significant role in genetic diversity, possibly due to the populations heterogeneity. C. alternans has been subject to a pronounced isolation of trees as a product of logging, thus raising inbreeding. Bayesian clustering show a trend towards an increased structuring over the course of generations but also, indicates that populations have recently gone through a bottleneck. The bottleneck following deforestation was not severe enough to lower the effective size, this could lead to high standing genetic diversity, providing a buffer against genetic erosion. We observed directional and balancing selection in C. alternans. Maintenance of variability and increased differentiation signify that their populations have been subject to a differential selective pressure at the ecological and the landscape level, combined effect could lead to disturb pollination and dispersion processes, modifying in the long term the effective population size.
Chamaedorea alternans es una especie de palma que ha sufrido extracción selectiva y pérdida del hábitat. Se colectaron 11 poblaciones de bosques fragmentados y conservados. Se calculó la variación genética de C. alternans, intercambio genético, diferenciación, cuellos de botella, el tamaño efectivo y las señales de selección natural. La diversidad genética fue mayor en el bosque conservado que en el fragmentado, pero no fue significativa posiblemente debido a la heterogeneidad de las poblaciones. La fragmentación no ha desempeñado un papel importante en la diversidad genética. C. alternans ha sido objeto de un marcado aislamiento de árboles, elevando así los coeficientes de endogamia. El agrupamiento bayesiano indica una tendencia hacia la estructuración con el curso de las generaciones, incluso, muestra evidencias de poblaciones que han sufrido cuellos de botella. Si el cuello de botella no fue tan severo para reducir el tamaño efectivo, esto pudo resultar en una alta diversidad genética, sirviendo como buffer contra la erosión genética. Observamos selección direccional y balanceadora en C. alternans. La disminución y el mantenimiento de la variabilidad y el aumento de la diferenciación significan que sus poblaciones han sido objeto de una presión diferencial a nivel ecológico y a nivel de paisaje; el efecto combinado podría llevar a alterar los procesos de polinización y dispersión, modificando a largo plazo el tamaño de la población.
Fragmentation is a process that reduces the surface of continuous forests forming several sized patches leading to modifications in the environment (Broadhurst & Young, 2007; Young & Pickup, 2010). At the landscape level, isolation between fragments could disturb pollination and dispersion and reduce the distribution areas, thus modifying the effective population size (Moreira, Fernandes, & Collevatti, 2009; Young & Clarke, 2000). Habitat degradation could upset the population's ability to respond to environmental and selective pressures (Lowe, Boshier, Bacles, & Navarro, 2005; Willi, Van Buskirk, & Hoffmann, 2006), but it could also in the short and long terms reduce the genetic variability of populations and affect their establishment (Farwig, Braun, & Bohning-Gaese, 2008; Hamrick, 2010; Kettle, Hollingsworth, Jafre, Moran, & Ennos, 2007; Zhang, Miao-Miao, Dong-Wei, & Xiao-Yong, 2012). Habitat modification in tropical and subtropical forests has been one of the main causes for the vulnerability of tropical ecosystems (Trejo & Dirzo, 2000). In Mexico an important reservoir of tropical forest is located in the eastern portion in the Los Tuxtlas region, Veracruz. The landscape in Los Tuxtlas is composed of a mosaic of forest fragments of tropical rain forest, secondary vegetation locally denominated as “acahuales” and large areas of grasslands (Barrera-Bassols, 1992). The main causes of deforestation are related to agriculture, cattle rising, human activities and the extraction of precious wood species (Barrera-Bassols, 1992; Guevara, Loborde, & Sánchez-Ríos, 2005). To try to ameliorate the fragmentation impacts, the area was considered as the Biophere Reserve Los Tuxtlas in 1998 (Semarnat-RBLT, 2001) and was designed as follows: the first core area was the San Martín Tuxtla Volcano (9,805ha), the second core area was the Santa Marta Sierra (18,031ha), and the third core area was the San Martín Pajapan Volcano (1,883.3ha). A buffer zone of 125,401ha was also instituted bringing the total area in the biosphere reserve of Los Tuxtlas to 155,122ha. The 3 large islands of conserved forest remained in the area, which are connected to each other by 2 large forest corridors: Catemaco and Sontecomapan serves as vegetation corridors very important to the connectivity of species (Dirzo, González-Soriano, & Vogt, 1997). Several studies have found that connectivity between patches is very important for the maintenance of biological diversity (Oyama, 1990). Conservation of rain forests depends on the quantity and quality of biological corridors that can mitigate the effects of deforestation (Dirzo et al., 1997; Guevara et al., 2005). Palms are among the forest species that have historically been exploited, in particular, Chamaedorea alternans (Arecaceae) is frequently used in floristry or as an ornamental plant, its populations undergoing a selective extraction and very possibly, their populations have suffered the effects of habitat loss and transformation (Hodel, 1992). Previous studies have been focused around ecological dynamics of endangered Chamaedorea species (Pérez-Farrera, Vovides, Martínez-Camilo, & Meléndez-Martínez, 2007), and the potential distribution of C. elegans in Veracruz with focus on its cultivation and conservation (Pérez-Portilla & Geissert-Kientz, 2004). Also, studies on population genetics performed on C. alternans and Chamaedorea ernesti-augusti highlighted high levels of genetic diversity and inbreeding among populations (Cibrián-Jaramillo et al., 2009; Luna, Epperson, & Oyama, 2007). As well, there are studies on the taxonomy and conservation status of C. alternans (Bacon & Bailey, 2006). But also, the short term genetic consequences of habitat loss and fragmentation in other palm species such as Oenocarpus bataua (Browne, Ottewell, & Karubian, 2015). But, it is still important to know the genetic dynamics between patches and more important about how fast the effects of fragmentation would be manifested, whether they be genetic, demographic or environmental.
In this study, we hypothesize that fragmented populations should have lower levels of genetic diversity and higher levels of genetic differentiation. Furthermore, in contrast with populations in conserved sites, populations in fragments were expected to have lower levels of gene flow and more evident effects of genetic drift and inbreeding. The main objectives of this work were: (i) to evaluate the levels of genetic variation and structure among populations of Chamaedorea alternans in conserved and fragmented forest of Los Tuxtlas, Veracruz, Mexico using isozyme markers; (ii) to determine the levels of genetic exchange and genetic differentiation between populations in conserved forest and in fragments in order to find out if fragmented populations are in some way being affected by environmental changes resulting from the process of fragmentation, and (iii) to identify the possible signal of natural selection in populations from C. alternans and how this can be associated with its life history and ecology.
Materials and methodsStudied speciesThe species of the genus Chamaedorea, commonly named “palms,” are dioecious and are distributed in neotropical rainforests and in cloud forest along the Atlantic slopes from southern San Luis Potosí and Tamaulipas to the northeast of Ecuador, western Brazil and northern Bolivia (Hodel, 1992). Mexico and Central America are the main centre of diversity and speciation of the genus Chamaedorea (Bacon & Bailey, 2006). Chamaedorea alternans H. Wendl., is a tropical unisexual (dioecious) palm tree of up to 5metres in height with showy inflorescences of small white or yellow flowers that are produced from October to January (Oyama, 1990). Male palms produce more flowers and inflorescences than female individuals. In general, most species of Chamaedorea have aromatic flowers, although they are mainly wind-pollinated species (Barfod, Hagen, & Borchsenius, 2011). Also, many species have brightly coloured flowers, such as yellow, red and orange, and sticky pollen, suggesting that insects participate in the pollination (Ríos, Fuchs, Hodel, & Cascante-Marín, 2013). The seeds are dispersed mainly by gravity and it is possible that some small mice and birds disperse the fruits at short distances (Hodel, 1992). C. alternans populations have high abundances and are fairly commonly found forming dense patches under the canopy of the forest (Bacon & Bailey, 2006).
Sampling procedureLeaf samples of the palm Chamaedorea alternans were randomly collected in 11 localities of tropical forests in Los Tuxtlas, Veracruz, Mexico (Table 1; Fig. 1). Deforestation of tropical rain forests in Mexico has been a vast process that has changed tropical landscapes (Dirzo et al., 1997). In the Tuxtlas region, about 10–15% of the original 2,500km2 of rain forest that once covered the entire region remains. There are 3 core areas of management in the reserve San Martín Tuxtla Volcano, Sierra Santa Marta Volcano, the San Martín Pajapan Volcano and the buffer zone (Semarnat-RBLT, 2001). We collected 11 populations with at least 30 individuals in the 3 different core areas of management: San Martín Tuxtla Volcano, Vigía (C), Estación Caminos (C), Estación Arriba (C), Laguna (F), Cerro Borrego (F), Ruíz Cortines (F), and Cola de Pescado (F). For the core area Sierra Santa Marta Volcano, López Mateos (C), Amates Cascada (F), and Amates Norte (F). Finally, in the core San Martín Pajapan Volcano the population of Pajapan (C) (Table 1). Leaf samples were stored in the laboratory at -70°C until genetic analyses were conducted.
Locality name, sample size, N/W geographical coordinates (degrees), altitude, mean number of alleles (Na), mean number of effective alleles per locus (Ne), mean observed heterozygosity (HO), mean expected heterozygosity (HE) and the inbreeding coefficient (FIS) for 11 populations of C. alternans from Los Tuxtlas, Veracruz, Mexico. Standard errors are included in parentheses. Bold letters mean the total for each estimation for the group.
| Locality | Sample size | Coordinates | Altitude | Genetic diversity | ||||
|---|---|---|---|---|---|---|---|---|
| Na | Ne | HO | HE | FIS | ||||
| Conserved | ||||||||
| 1. Estación Caminos | 30 | 18°35′/95°4′ | 71 | 3.5 (0.42) | 2.58 (0.31) | 0.417 (0.05) | 0.567 (0.06) | 0.265 (0.05) |
| 2. Estación Arriba | 30 | 18°34′/95°4′ | 66 | 3.0 (0.30) | 2.32 (0.22) | 0.465 (0.06) | 0.546 (0.04) | 0.169 (0.07) |
| 3. Vigia | 30 | 18°35′/95°4′ | 109 | 2.6 (0.44) | 2.0 (0.33) | 0.388 (0.06) | 0.462 (0.07) | 0.159 (0.06) |
| 4. López Mateos | 30 | 18°26′/94°57′ | 214 | 3.5 (0.34) | 2.62 (0.26) | 0.405 (0.06) | 0.589 (0.04) | 0.328 (0.09) |
| 5. Pajapan | 30 | 18°18′/94°43′ | 665 | 3.3 (0.37) | 2.55 (0.28) | 0.351 (0.06) | 0.564 (0.05) | 0.395 (0.08) |
| Total | 3.62 | 2.696 | 0.443 | 0.621 | 0.263 | |||
| Fragmented | ||||||||
| 6. Ruiz Cortines | 30 | 18°31′/95°7′ | 939 | 3.1 (0.37) | 1.99 (0.20) | 0.362 (0.22) | 0.508 (0.19) | 0.296 (0.09) |
| 7. Amates Cascada | 30 | 18°20/95°3′ | 881 | 3.9 (0.22) | 2.84 (0.20) | 0.468 (0.20) | 0.626 (0.08) | 0.261 (0.07) |
| 8. Amates CNorte | 30 | 18°30′/95°03′ | 228 | 3.5 (0.20) | 2.53 (0.17) | 0.411 (0.14) | 0.581 (0.10) | 0.288 (0.06) |
| 9. Laguna | 30 | 18°35′/95°05′ | 327 | 3.4 (0.32) | 2.57 (0.25) | 0.439 (0.20) | 0.621 (0.15) | 0.296 (0.07) |
| 10. Cerro Borrego | 30 | 18°37′/95°05′ | 143 | 3.3 (0.30) | 2.29 (0.19) | 0.465 (0.17) | 0.589 (0.14) | 0.211 (0.04) |
| 11. Cola de Pescado | 30 | 18°38/95°04′ | 172 | 3.1 (0.32) | 2.42 (0.27) | 0.414 (0.20) | 0.583 (0.18) | 0.298 (0.05) |
| Total | 3.60 | 2.617 | 0.424 | 0.603 | 0.275 | |||
. We include the first core area the San Martín Tuxtla Volcano (1), the second core area the Santa Marta Sierra (2) and the third core area was the San Martín Pajapan Volcano (3) with grey colour. The number 4 shows the buffer zone in light green and 5 shows the Catemaco Lake.")
Map showing the delimitation of 11 populations of C. alternans sampled in the Biosphere Reserve Los Tuxtlas (black circles). We include the first core area the San Martín Tuxtla Volcano (1), the second core area the Santa Marta Sierra (2) and the third core area was the San Martín Pajapan Volcano (3) with grey colour. The number 4 shows the buffer zone in light green and 5 shows the Catemaco Lake.
Starch gel electrophoresis was conducted following standard methods (Cheliak & Pitel, 1984; Conkle, Hodgkiss, Nunnally, & Hunter, 1982). Sections of fresh, young leaves were crushed in 0.3mL of the grinding buffer (3:1 [v:v]) mixture of buffer YO from Yeh and O’Malley (1980) and VegII from Pitel and Cheliak (1984). Leaf extracts were adsorbed in Whatman no. 17 paper wicks that were applied to a 12% starch gel. We tested different systems of electrode and gel buffers to determine the best system for each enzyme. Anodic peroxidase (APX, E.C. 1.11.1.7, expressing 2 loci) and cathodic peroxidase (CPX, E. C. 1.11.1.7, 2 loci) resolved best in system R of Ridgway (Sherburne & Lewis, 1970). Glutamic-oxaloacetic transaminase (GOT, E.C. 2.6.1.1, 2 loci) and phosphoglucose isomerase (PGI, E. C. 5.3.1.9, 2 loci) were adequately resolved in system D of Stuber, Wendel, and Goodman (1988). Esterase (EST, E.C. 3.1.1, 4 loci) and ribulose biphosphate carboxylase (RUB, E.C. 4.1.1.39, 2 loci) were run in system C of Stuber et al. (1988). Starch gels (12%) were run at 30mA for 4–6h on the R system and for 6–8h on the C and D systems. The staining recipes were modified from Wendel and Weeden (1989), and Luna, Epperson, and Oyama (2005). Enzymatic systems with more than 2 locus were numbered in ascending order beginning with the locus which had more mobility. Allelic variants within loci (allozymes) were distinguished from the products of different loci (isozymes). The alleles were numbered according to their mobility relative to the alleles of standard individuals present in all gels in each system. Allelic variants were numbered sequentially from anode to cathode.
Genetic diversity and structureWe estimated the levels of inter and intrapopulation genetic diversity in 11 populations of C. alternans in the Los Tuxtlas forest. Using the GENETIX 4 program (Belkhir, Borsa, Chikhi, Raufaste, & Bonhomme, 1996–2004) we calculated the values and standard error of mean number of alleles per locus (Na), mean effective number of alleles (Ne), mean observed heterozygosity (HO), mean expected heterozygosity (HE) and mean of fixation index (FIS) between conserved and fragmented populations. Pairwise population genetic differentiation FST was estimated by the infinite alleles model (IAM) performed with 104 permutations in the ARLEQUIN 3.5.1.2 software (Excoffier & Lischer, 2010). Estimates of genetic exchange among conserved and fragmented populations were obtained using the program MIGRATE 3.2.7 (Beerli & Felsenstein, 2001) by the estimation of the Bayesian-scaled long term effective population size (Ne) and the migration rate (m). Analyses were performed setting the starting value of the chain to 206 visited and 16 recorded genealogies, with a burn-in of 503 (Beerli & Felsenstein, 2001). In addition, Mantel test analysis was performed in TFPGA 1.3 (Miller, 1997) to find correlations between genetic and geographic distances.
To identify possible geographic and genetic discontinuities among populations of C. alternans, we used the Monmonier's maximum difference algorithm with the software BARRIER version 2.2 (Manni, Guerard, & Heyer, 2004), a program that creates a map of sampling locations from their geographical coordinates. Barriers were then represented on the map by identifying the maximum values within the population pairwise genetic distance matrix. We utilized an average square distances (ASD) matrix of (Goldstein, Ruiz-Linares, Cavalli-Sforza, & Feldman, 1995; Slatkin, 1995) estimated for 11 populations of C. alternans. Resampling random subsets of individuals within populations provided 100 bootstrap replicate distances were constructed utilizing the MSA program (Dieringer & Schlötterer, 2003) to achieve statistical significance for the predicted barriers.
Population bottleneck, size change and test of selectionWe used the software BOTTLENECK 1.2 (Piry, Luikart, & Cornuet, 1999) to detect population bottlenecks, using the 2 genetic groups previously obtained with STRUCTURE. Recent bottlenecks, could be defined as a population where the rare alleles are the first to be lost decreasing the mean number of alleles per locus. In contrast, heterozygosity is less affected, producing a transient excess in heterozygosity relative to that expected given the resulting number of alleles (Cornuet & Luikart, 1996; Luikart & Cornuet, 1998). To test the data set, we used 90% stepwise and 10% multistep mutations 104 iterations with the Wilcoxon signed-rank test, and the stepwise mutation (SMM), the infinite allele (IAM) and 2-phase mutation (TPM) models. Additionally, we also estimated the effective population size in populations of C. alternans with the program LDNe (Waples & Do, 2008), which implements the bias-correction method developed by Waples (2006) to obtain Ne from each sample of S individuals. For LDNe, we used the criterion Pcrit=0.02 (alleles with frequency <0.02 are excluded), which generally provides a good balance among accuracy and bias (Waples & Do, 2008). Confidence intervals (CIs) for Ne were based in the chi-square approximation implemented by LDNe (Waples, 2006).
Additionally, we tested the loci for patterns indicative of selection using LOSITAN which evaluates the relationship between FST and expected heterozygosity (HE) to identify outlier loci. Theoretically, a shared demographic history should result in similar FST/HE values for all loci; those that deviate may be candidates for selection (Beaumont, 2005). We ran 99,000 simulations starting with a neutral mean FST using either the entire dataset and then we tested the different groups of C. alternans. Finally, we used the frequentist method to test selection with the program FDIST2 (Beaumont & Balding, 2004). This approach calculates θ, Weir and Cockerham (1984) as an estimator of diversity for each locus in the sample. This method provides evidence for selection by looking for outliers with higher/lower observed FST values, controlling for heterozygosity (Beaumont & Balding, 2004). Coalescent simulations were then performed to determine the quantiles of the simulated FST within which the observed FST's fell, and significance level (P-values) for each locus. Simulation parameters were under an infinite allele mutation model for 100 demes, and sample sizes 100.
Bayesian cluster analysisA Bayesian cluster analysis was conducted using STRUCTURE version 2.3.3 (Falush, Stephens, & Pritchard, 2003; Hubisz, Falush, Stephens, & Pritchard, 2009; Pritchard, Stephens, & Donnelly, 2000). In this analysis individuals are probabilistically assigned to one of the predefined K populations (gene pools) to identify the optimal number of genetic groups (Evanno, Regnaut, & Goudet, 2005). The optimum number of groups (K) was determined by varying the value of K from 1 to 10 and running the analysis 10 times per K value, in order to determine the maximum value of posterior likelihood [LnP (D)]. Each run was performed using 504 burn-in periods and 106 Markov Chain Monte Carlo (MCMC) repetitions after burn-in. We used a model allowing for admixture with correlated allelic frequencies without any prior information. Also, we determined the most probable value of K using the maximum value of ΔK according to Evanno et al. (2005) implemented in the program Structure Harvester 0.6.1 (Earl & Von Holdt, 2011).
ResultsThe values of the genetic diversity parameters estimated in 11 populations of C. alternans (Table 1) were higher in conserved (Na=3.62, Ne=2.696, HO=0.443) than in fragmented populations (Na=3.60, Ne=2.617, HO=0.424) (Table 1); although differences were not statistically significant in an Anova 1-way test. Wright's inbreeding coefficients within populations (FIS) were in all cases positive, indicating a deficit of heterozygotes (Table 1) that was slightly higher in fragmented (FIS=0.275) than in conserved populations (FIS=0.263), although not showing statistical significance in a 1-way Anova test. Pairwise genetic differentiation among populations indicated that the highest genetic differentiation based on FST (Table 2) was observed between conserved and fragmented populations: Vigía/Estación Caminos (FST=0.29), Ruíz Cortines/Estación Caminos (FST=0.28), and Cerro Borrego/Vigía (FST=0.27), while moderate differentiation was observed between López Mateos/Pajapan (FST=0.134), Cerro Borrego/Estación Arriba (FST=0.169). Finally, lower differentiation was found between Cola de Pescado/Laguna (FST=0.066). Mantel test did not show statistical correlation between geographic and genetic distances estimated by the linearized FST(FST/1−FST). Levels of gene exchange detected with MIGRATE resulted in moderate to high values among all populations of C. alternans (Table 3). While the highest values of gene flow were detected between populations in conserved and fragmented forest (Nm 1–2.12). Moderate levels of gene flow were observed between populations in fragmented and conserved forest (Nm=1–1.9). The lowest number of migrants per generation was identified within conserved and fragmented populations (Nm=0.53–0.9).
Pairwise population genetic differentiations FST (IAM) among localities of C. alternans in Los Tuxtlas, Veracruz, Mexico, over 104 replicates in the Arlequin 3.5 software (Excoffier & Lischer, 2010).
| FST | Estación Caminos | Estación Arriba | Vigia | López Mateos | Pajapan | Ruiz Cortines | Amates Casca | Amates Norte | Laguna | Cerro Borrego | Cola de Pescado |
|---|---|---|---|---|---|---|---|---|---|---|---|
| Estación Caminos | – | ||||||||||
| Estación Arriba | 0.213 | – | |||||||||
| Vigía | 0.299 | 0.175 | – | ||||||||
| López Mateos | 0.122 | 0.235 | 0.319 | – | |||||||
| Pajapan | 0.222 | 0.143 | 0.228 | 0.134 | – | ||||||
| Ruiz Cortines | 0.280 | 0.174 | 0.299 | 0.197 | 0.078 | – | |||||
| Amates Cascada | 0.180 | 0.111 | 0.187 | 0.195 | 0.122 | 0.147 | – | ||||
| Amates CNorte | 0.219 | 0.130 | 0.253 | 0.230 | 0.146 | 0.178 | 0.070 | – | |||
| Laguna | 0.208 | 0.166 | 0.260 | 0.140 | 0.073 | 0.127 | 0.109 | 0.133 | – | ||
| Cerro Borrego | 0.224 | 0.169 | 0.274 | 0.164 | 0.076 | 0.100 | 0.139 | 0.167 | 0.070 | – | |
| Cola de Pescado | 0.244 | 0.144 | 0.210 | 0.161 | 0.033 | 0.072 | 0.117 | 0.155 | 0.066 | 0.073 | – |
Levels of genetic exchange estimated with the program MIGRATE. Directional pairwise migration rates among 11 C. alternans populations in Los Tuxtlas, Veracruz, Mexico. Donating and receiving populations are below and above the diagonal, respectively. Migration rates are given as the value of effective number of migrants per generation (Nm).
| +Receiving | Population | ||||||||||
|---|---|---|---|---|---|---|---|---|---|---|---|
| Population | EstCam C | EstArrib C | Vigia C | LopezMat C | Pajapan C | RuizCort F | AmatCasc F | AmatCeno F | Laguna F | CerrBorre F | ColPesc F |
| EstCam C | – | 1.77 | 0.615 | 0.759 | 1.038 | 1.023 | 0.591 | 1.046 | 1.33 | 1.047 | 0.990 |
| EstArrib C | 1.00 | – | 0.951 | 0.673 | 0.790 | 0.859 | 1.379 | 0.708 | 1.015 | 0.849 | 1.965 |
| Vigia C | 1.329 | 0.566 | – | 1.007 | 0.930 | 1.059 | 1.079 | 0.979 | 0.526 | 0.975 | 1.260 |
| LopezMat C | 0.991 | 1.377 | 0.514 | – | 1.061 | 1.228 | 0.734 | 0.771 | 0.844 | 0.697 | 1.498 |
| Pajapan C | 1.104 | 1.034 | 0.317 | 0.900 | – | 0.848 | 1.044 | 0.748 | 0.847 | 1.227 | 1.047 |
| RuizCort F | 0.674 | 1.213 | 0.857 | 0.895 | 0.864 | – | 0.755 | 0.828 | 0.820 | 1.407 | 0.571 |
| AmatCasc F | 1.718 | 1.514 | 1.517 | 0.564 | 0.535 | 1.517 | – | 1.603 | 1.078 | 1.015 | 1.171 |
| AmatCeno F | 0.634 | 1.267 | 0.643 | 0.775 | 1.098 | 0.757 | 2.128 | – | 0.770 | 0.706 | 0.560 |
| Laguna F | 1.066 | 0.574 | 1.086 | 1.607 | 0.492 | 1.273 | 1.411 | 1.213 | – | 1.270 | 0.820 |
| CerrBorre F | 0.806 | 1.292 | 1.164 | 1.209 | 1.229 | 1.074 | 0.404 | 1.057 | 0.691 | – | 1.228 |
| ColPesc F | 0.867 | 0.459 | 1.272 | 1.277 | 1.352 | 1.242 | 1.841 | 0.891 | 0.616 | 0.850 | – |
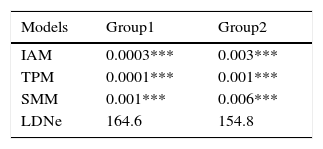
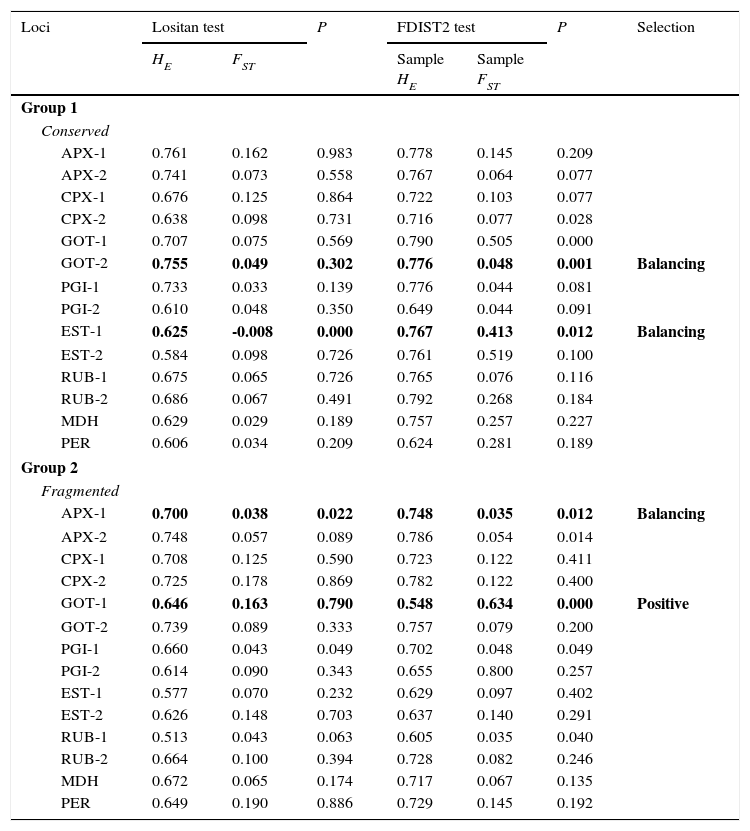
The results of the analysis to test the evidence of recent bottlenecks (excess heterozygosity) using the infinite allele model (IAM), 2-phase model (TPM) and stepwise mutation models (SMM) are presented in Table 4. Results were-significant (p<0.50) for IAM p=0.0003 and TPM p=0.001 and the SMM p=0.006 in the lociCPX-2, APX-2 and GOT-2 models. Populations of the 2 genetic groups exhibited evidence of excess heterozygosity for C. alternans populations suggesting that the populations have recently undergone a bottleneck. The results of estimation of effective population size (Ne) performed with the program LDNe in populations of C. alternans show that the both genetic groups had the moderated values in the first group (Ne=164 individuals), followed by the second group (Ne=154); in all cases, estimates had high Jacknife support and a good confidence interval (CIs) (Table 4). Results of analyses to detect outlier loci performed with the FDIST2 and with the LOSITAN programs are presented in Table 5. With both approaches, based on simulated and observed FST values, could identified 4 loci (GOT-2, EST-1, APX-1 and GOT-1) as outliers showing footprints of selection in populations from conserved and fragmented populations with a 5% significance level. One of these outlier significant loci the GOT-1 did show higher FST values that probably indicated a signal of directional selection. The other 3 outlier significant loci the GOT-2, EST-1 and APX-1 appearing in the lower tail of the FST distribution that possibly suggested a signature potentially affected by balancing selection (Table 5).
Bottleneck analysis for C. alternans populations in Los Tuxtlas, Veracruz, Mexico using Wilcoxon rank test under infinite allele, stepwise mutation and 2 phase model. Parameters for TPM: variance=10%, proportion of SMM=90%, estimation based on 104 replications. P, probability. IAM, infinite allele model; TPM, 2 phase model; SMM, stepwise mutation model. *** indicate significant deviation from equilibrium as value less than 0.01. Also, we include the results obtained for the estimation of the population effective size for the 2 genetic groups, values obtained with the program LDNe.
| Models | Group1 | Group2 |
|---|---|---|
| IAM | 0.0003*** | 0.003*** |
| TPM | 0.0001*** | 0.001*** |
| SMM | 0.001*** | 0.006*** |
| LDNe | 164.6 | 154.8 |
LOSITAN and FDIST2 test of detection of selection in populations of C. alternans from conserved and fragmented landscapes. Bold numbers show the significant deviation of neutrality in a particular locus and the type of selection involved.
| Loci | Lositan test | P | FDIST2 test | P | Selection | ||
|---|---|---|---|---|---|---|---|
| HE | FST | Sample HE | Sample FST | ||||
| Group 1 | |||||||
| Conserved | |||||||
| APX-1 | 0.761 | 0.162 | 0.983 | 0.778 | 0.145 | 0.209 | |
| APX-2 | 0.741 | 0.073 | 0.558 | 0.767 | 0.064 | 0.077 | |
| CPX-1 | 0.676 | 0.125 | 0.864 | 0.722 | 0.103 | 0.077 | |
| CPX-2 | 0.638 | 0.098 | 0.731 | 0.716 | 0.077 | 0.028 | |
| GOT-1 | 0.707 | 0.075 | 0.569 | 0.790 | 0.505 | 0.000 | |
| GOT-2 | 0.755 | 0.049 | 0.302 | 0.776 | 0.048 | 0.001 | Balancing |
| PGI-1 | 0.733 | 0.033 | 0.139 | 0.776 | 0.044 | 0.081 | |
| PGI-2 | 0.610 | 0.048 | 0.350 | 0.649 | 0.044 | 0.091 | |
| EST-1 | 0.625 | -0.008 | 0.000 | 0.767 | 0.413 | 0.012 | Balancing |
| EST-2 | 0.584 | 0.098 | 0.726 | 0.761 | 0.519 | 0.100 | |
| RUB-1 | 0.675 | 0.065 | 0.726 | 0.765 | 0.076 | 0.116 | |
| RUB-2 | 0.686 | 0.067 | 0.491 | 0.792 | 0.268 | 0.184 | |
| MDH | 0.629 | 0.029 | 0.189 | 0.757 | 0.257 | 0.227 | |
| PER | 0.606 | 0.034 | 0.209 | 0.624 | 0.281 | 0.189 | |
| Group 2 | |||||||
| Fragmented | |||||||
| APX-1 | 0.700 | 0.038 | 0.022 | 0.748 | 0.035 | 0.012 | Balancing |
| APX-2 | 0.748 | 0.057 | 0.089 | 0.786 | 0.054 | 0.014 | |
| CPX-1 | 0.708 | 0.125 | 0.590 | 0.723 | 0.122 | 0.411 | |
| CPX-2 | 0.725 | 0.178 | 0.869 | 0.782 | 0.122 | 0.400 | |
| GOT-1 | 0.646 | 0.163 | 0.790 | 0.548 | 0.634 | 0.000 | Positive |
| GOT-2 | 0.739 | 0.089 | 0.333 | 0.757 | 0.079 | 0.200 | |
| PGI-1 | 0.660 | 0.043 | 0.049 | 0.702 | 0.048 | 0.049 | |
| PGI-2 | 0.614 | 0.090 | 0.343 | 0.655 | 0.800 | 0.257 | |
| EST-1 | 0.577 | 0.070 | 0.232 | 0.629 | 0.097 | 0.402 | |
| EST-2 | 0.626 | 0.148 | 0.703 | 0.637 | 0.140 | 0.291 | |
| RUB-1 | 0.513 | 0.043 | 0.063 | 0.605 | 0.035 | 0.040 | |
| RUB-2 | 0.664 | 0.100 | 0.394 | 0.728 | 0.082 | 0.246 | |
| MDH | 0.672 | 0.065 | 0.174 | 0.717 | 0.067 | 0.135 | |
| PER | 0.649 | 0.190 | 0.886 | 0.729 | 0.145 | 0.192 | |
The highest posterior probability was obtained from Bayesian likelihood [LnP (D)] and the ΔKEvanno et al. (2005) approach implemented in the program Structure Harvester (Earl & Von Holdt, 2011). These statistics determined that K=2 is the optimum value for the number of genetic clusters included in the analysis (Fig. 2). Figure 3 shows a conserved (i.e. Cluster 1, green) and a fragmented (i.e. Cluster 2, red) group of genotypes, forest populations being consistently structured according to fragment type. Conserved populations (i.e. Cluster 1, green) Estación Caminos C, Estación Arriba C, Vigía C, and López Mateos C form their own genetic group (green) with an ancestry coefficient Q from 0.532 to 0.882. Populations from fragmented forest (i.e. Cluster 2, red), such as Amates Cascada F, Amates CNorte F and Laguna belong to the fragmented genetic group (red) with ancestry coefficient (Q) going from 0.759 to 0.853. The remaining populations of Cerro Borrego F, and Cola de Pescado F sites were principally grouped within the green genetic cluster (Q 0.732–0.848). Figure 3 displays the distribution of ancestry proportions by means of pie charts placed on each collection site. According to the Barriers analysis, using 100 bootstrap replicates of ASD matrixes, 4 barriers were identified in the 11 populations of C. alternans tested with over 50% bootstrap support (Fig. 3). The most significant barrier, with a bootstrap support of 95%, separates the eastern part of Catemaco Lake and south of Catemaco, Veracruz. The second barrier, with 89% bootstrap value, divides the San Martin Pajapan volcano and the rest of the populations of C. alternans. The third barrier with a 79% bootstrap support separated populations in the northern area of Los Tuxtlas, such as Cola de Pescado and Cerro Borrego, from populations in conserved sites from Vigia and Estación Caminos. The fourth barrier, with a 68% bootstrap support, separated the populations from Laguna and Estación Arriba from populations in the north of Catemaco Lake, such as Ruíz Cortines and Amates Norte (Fig. 3).
.")
Values of ΔK plotted against K, the peak indicates the most probable number of genetic groups given the data using Structure Harvester (Earl & Von Holdt, 2011).

Map shows sampling localities representing 11 populations of C. alternans in Los Tuxtlas, Veracruz, Mexico. Each pie chart represents the proportions in each population of the 2 genetic groups as assigned by the program STRUCTURE. Green and red represent the genetic groups corresponding to conserved and fragmented sites, respectively. Numbers next to each symbol correspond to the population numbers given in Table 1. Black lines represent 4 detected barriers.
We studied the joint effect of landscape changes, altering environmental conditions and genetic diversity on the palm Chamaedora alternans. We observed that estimated parameters of genetic diversity were higher in conserved (Na=3.62, Ne=2.69, HO=0.44) than in fragmented forests (Na=3.60, Ne=2.61, HO=0.42) even if the differences were not statistically significant (Table 1). These results, suggested that fragmentation effect did not play a significant role on genetic diversity in the isolated habitats, as previously reported in tree species (Aguilar, Quesada, Ashworth, Herrerias, & Lobo, 2008; Figueroa-Esquivel, Puebla-Olivares, Eguiarte, & Núñez-Farfán, 2010; Kettle et al., 2007; Zhang et al., 2012). Particularly, for C. alternans, which has been subject to increasing pressures for at least 50 years, which in combination with the high rates of deforestation in its geographic areas (Bacon & Bailey, 2006) and forest conversion to agriculture and grasslands, has caused habitat loss, pollinators, and dispersers (Govaerts & Dransfield, 2005; Hodel, 1992). Although, the relaxed effect on genetic diversity is probably due to the substantial amount of population heterogeneity even if they belong to the same type of fragmentation. This outline particularly indicates different evolutionary histories of populations within a single group, even if they present common geographical and ecological characteristics. These results suggest that, in the short term, genetic diversity can be maintained in fragmented landscapes among early generations of this long-lived palm species, despite increasing levels of within- and between-population genetic structure among populations (Browne et al., 2015; Kettle et al., 2007). But also, could be evidence of the early signals for an anthropogenic impact on the evolutionary trajectory for C. alternans in our study area. Similarly, in C. alternans inbreeding coefficients underlined higher values in populations from fragments (FIS=0.275) and conserved forest (FIS=0.263) and indicate a deficiency of heterozygosity relative to expected in Hardy–Weinberg equilibrium. Populations of C. alternans have been subject to a gradually and pronounced isolation of mature trees in fragmented areas as the product of selective logging that reduces the density of adult trees, thus raising inbreeding coefficients. We can expect changes in reproductive traits, such as the decrease in outcrossing rate because of adult trees in disturbed landscapes generally are mating more frequently with closely related individuals, or even through autogamous pollination (e.g. Andre, Lemes, Grogan, & Gribel, 2008; Kettle et al., 2007; Lowe et al., 2005; Oostermeijer, Luijten, & Den Nijs, 2003). Chamaedorea and other palm genera have local aggregations of specific cohorts or sexes (Porter-Morgan, 2007; Souza & Martins, 2003; Svenning, 2001). If there is mating-pair heterogeneity, or if floral resources from either females or males are not available in given years, the number of genetic donors per generation could be decreased. Local spatial distribution of sexes can lower reproductive success, decrease observed heterozygosity, and in some cases increase local differentiation (Cibrián-Jaramillo et al., 2009; Otero-Arnaiz & Oyama, 2001). In this sense, we observed signals of recent bottlenecks (excess of heterozygosity) in both genetic groups of C. alternans with the models IAM, TPM and SMM were-significant (p<0.010) with the loci CPX-2, APX-2 and GOT-2. Demographic bottlenecks also have been observed in other Chamaedorea palms (e.g. C. eliator, C. tepejilote, C. ernesti-augusti (Cibrián-Jaramillo et al., 2009; Luna et al., 2007). Commonly, Chamaedorea species occurred in aggregated clusters of individuals and occur at densities of less than 100 individuals per hectare in some areas at the scale of a few hundred individuals per hectare for most of its distribution (Penn et al., 2008; Pérez-Farrera et al., 2007). Low density of C. alternans within subpopulations could further limit pollen movement by reducing the number of donors, and increasing susceptibility to genetic drift by reducing local effective population sizes (Cibrián-Jaramillo et al., 2009; Flores & Ashton, 2000). Despite the huge reduction in abundance because of drastic environment change, habitat destruction and illegal harvesting in the Los Tuxtlas region (Dirzo & García, 1992; Pérez-Portilla & Geissert-Kientz, 2004). Still fragmented and continuous populations of C. alternans show moderate to high values of population size such as the first group showing the highest values (Ne=164 individuals) and the second genetic group (Ne=154). Studies in conservation genetics have pointed out a rule to define the effective population size to avoid genetic harmful effects (Frankham, Ballou, & Briscoe, 2002; Pickup & Barrett, 2013). A population with an effective size of 50 is considered the minimum to maintain sufficient genetic variability, while 500 individuals are required to offset effective drift (Charlesworth, 2009; Vicoso & Charlesworth, 2009). One possible explanation is that the genetic bottleneck following deforestation was not severe enough to lower the effective size of remnant populations to a point where loss of genetic diversity would be pronounced (Browne et al., 2015; Kramer, Ison, Ashley, & Howe, 2008; Lowe et al., 2005). This could lead to high standing genetic diversity in the populations left after fragmentation, providing a buffer against genetic erosion (Hamrick, 2004; Young & Clarke, 2000).
Genetic differentiation FST parameters are more variable within groups of populations than among groups (Table 2) and resulted slightly higher when we compared between genetic groups obtained with the Bayesian-clustering approach (i.e. cluster 1, green and cluster 2 red). This could be because both genetic groups have a slightly moderate genetic differentiation between each other, perhaps due to geographic isolation in the fragments or may also indicate an incipient effect produced by the selective extraction of individuals of C. alternans. For instance, the genetic/geographic barriers (e.g. B1) observed in populations of C. alternans (Fig. 3) separated the east part of Catemaco Lake from southern portion of Catemaco Lake, which represents a barrier to the movement of pollinators and dispersers (Dirzo & García, 1992; Dirzo et al., 1997). The second barrier (e.g. B2) divides San Martín Pajapan volcano mountain chain reaching 1,900m of elevation, that probably acting as a barrier against gene flow between populations (Guevara et al., 2005). The third and fourth barriers (e.g. B3 and B4) that divide populations from Cola de Pescado and Cerro Borrego occur in several isolated remnants of vegetation, which play an essential role acting as a vegetation corridor that linked populations in the last northern remnants of tropical rain forest in the state of Veracruz. Particularly, for C. alternans these results indicate the importance of fragmented areas for the maintenance of connectivity in modified landscapes, current distribution of fragmented remnants in the habitats may not completely isolate palm populations. Studies suggested that, if established on degraded sites along the forest edge, theses buffer zones can act as catalysist for recolonization by the native flora through the influence on microclimate, soil fertility, suppression of dominant grasses and habitat for seed-dispersing wildlife (Kramer et al., 2008; Lowe et al., 2005; Schroth et al., 2011). Seed dispersal from conserved to fragmented areas may be responsible for the low-moderate genetic differentiation and in the long term can balance fragmentation if population size is not too small (Barfod et al., 2011; Hamrick, 2010; Montoya, Zavala, Rodríguez, & Purves, 2008; Young & Clarke, 2000).
More important, it is essential to consider the role of natural selection influencing the genetic structure of the studied populations. For instance, the contrasting environmental conditions due to changes in the conserved and fragmented populations may impose a selection pressure. Recently, Pérez-Portilla and Geissert-Kientz (2004) performed the potential distribution of C. elegans, a close relative to C. alternans. The results show the variables that help explain the distribution of this species are related to climate (temperature and precipitation), edaphic (drainage surface) and physiographic (landform). In relation to climate, it could have a strong influence on the populations because altered landscapes can be very heterogeneous (Eiserhardt, Svenning, Kissling, & Balslev, 2011; Svenning, 2001). Also, studies have emphasized that landforms have an indirect effect on the distribution of species, thus affecting moisture availability, solar radiation and wind exposure (Ohmann & Spies, 1998; Souza & Martins, 2003; Wagner et al., 2014). Hodel (1992) also mentioned that the presence of salinity in the soil does not favour the development and growth of Chamaedorea. In this sense, C. alternans have been subject to a very complex pattern of selective pressure that resulted detectable with the analysis of deviation of neutrality in the loci surveyed in C. alternans (i.e. performed with FDIST2 and LOSITAN programs). We found 3 outlier significant loci the GOT-2, EST-1 and APX-1 appearing with lower FST distribution that possibly suggested balancing selection shown in populations from conserved and fragmented. Balancing selection refers to forms of natural selection which work to maintain genetic polymorphisms or multiple alleles within a population (Charlesworth, 2006; Wright & Gaut, 2005). Although, the landscape of C. alternans is highly fragmented, we observed a continuous natural gene flow among more geographically close populations than between those in distant stands; these genetic aggregating structure was previously reported by Otero-Arnaiz and Oyama (2001) having important implications for management because it would increase the variability of the populations (Guevara et al., 2005). One possible explanation is where several populations may comprise a much bigger and more isolated area than the large ones contains, probably a high rate of dispersal from fragmented populations leads to the possibility to maintain the same or more genetic diversity than conserved habitat. More important, the interaction among migration and population size are the mechanism that regulates the preservation of genetic diversity in isolated environments (Andre et al., 2008; Willi et al., 2006; Zhang et al., 2012). Directional selection was observed in the outlier loci, the GOT-1 did show higher FST values in populations from fragmented habitats, that probably indicated directional selection a decrease of genetic diversity, called selective sweep (Maynard-Smith & Haigh, 1974) and an excess of high-frequency mutations (Fay & Wu, 2000). Decrease and maintenance of genetic variability and increased population differentiation, signify that populations of C. alternans, have been subject to a historical differential selective pressure at the ecological and the landscape level, both effects could lead to disturb pollination, dispersion processes (Andre et al., 2008) reduce the distribution areas, modifying to the long term the effective population size (Broadhurst & Young, 2007; Lowe et al., 2005; Vicoso & Charlesworth, 2009). The results are in agreement with the study of Pérez-Portilla and Geissert-Kientz (2004) that indicated that Chamaedorea species are susceptible to cool temperatures, precipitation regimes, prolonged dry season and soil with poor drainage, which also have been identified as important variables in the ecological and physiological processes to the species belonging to Chamaedorea (Eiserhardt et al., 2011; Hodel, 1992; Svenning, 2001). In small populations we can expect negative impacts on population genetic parameters, such as an increase of inbreeding, and a reduction of genetic variation caused by genetic drift, founder effect or accumulation of deleterious mutations (Andre et al., 2008; Farwig et al., 2008; Moreira et al., 2009; Young & Pickup, 2010). In Mexico, which like other countries currently is undergoing increased anthropogenic pressures, conservation efforts seem to be necessary that could diminish the effects of fragmentation on tropical tree species populations. One possible way to help to mitigate the effects of fragmentation is to create continuous corridors between fragments. Stepping stone fragments allow the mixing of populations and the sharing of genes, thereby reducing problems of inbreeding depression and genetic stochasticity in fragmented populations (Kramer et al., 2008; Oostermeijer et al., 2003; Schroth et al., 2011). Also, a possible conservation strategy could be to legalize the commercial trade of leaves with a horticultural company established in the Los Tuxtlas region which provides leaves for the national and international markets to fulfil ornamental demand (Ash, Gorchov, & Endress, 2013; Bridgewater et al., 2006; Flores & Ashton, 2000; Newton & Freyfogle, 2005).
To D. Lugo-Aquino, O. Chassin-Noria, S. Zárate Pedroche and V. Rocha-Ramírez, for technical assistance and suggested improvements to the manuscript.
Peer Review under the responsibility of Universidad Nacional Autónoma de México.