


California's acute care system provides several essential services and compares favorably with other developed countries. For developing systems, a critical analysis of the California model suggests: (1) ambulatory patients require timely access to urgent and continuing primary care in communities to allow the ED to focus on more essential services; (2) outcomes from highly specialized care in California support the wider consensus that time-sensitive, life-threatening emergency conditions are best managed within regionalized systems of care; (3) ED-oriented care teams are well positioned to rapidly evaluate and treat patients with acute exacerbations of chronic conditions, reducing the need for more costly hospital admission or readmission; (4) frequent visitors to ED's due to poorly controlled behavioral health require their own urgent treatment pathways to preserve ED capacity.
If California were a country rather than the largest of the United States, its population would be slightly greater than Canada. The World Bank and California Department of Finance estimated that the state had the world's sixth largest gross domestic product in 2015. California has advanced systems for acute care, yet has lower per capita utilization of hospital-based emergency care than other US regions, as well as other developed countries. Wider understanding of the strengths and weaknesses of the acute care continuum in California may be useful in other population health settings.
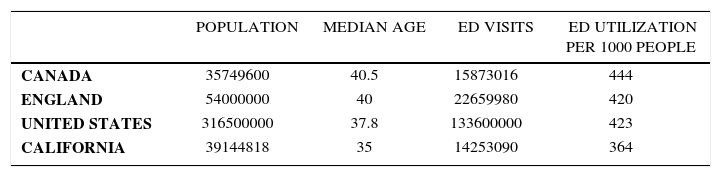
DEMOGRAPHICS OF EMERGENCY CAREPolicy makers in most countries place a lower priority on acute care than primary care, health screening, or population surveillance. In many Commonwealth countries with universal health insurance programs, overall emergency department (ED) utilization remains higher than policy makers might desire (see Table 1). In 2015, utilization in Canada was 444 ED visits per thousand. In England, ED utilization was 420 visits per thousand. In 2013, the most recent year where federal data is available for all 50 states, ED utilization in the US was similar at 423 ED visits per thousand.
EMERGENCY DEPARTMENT VISITS AND UTILIZATION PER THOUSAND FOR CANADA, ENGLAND, UNITED STATES, AND CALIFORNIA - 2015
| POPULATION | MEDIAN AGE | ED VISITS | ED UTILIZATION PER 1000 PEOPLE | |
|---|---|---|---|---|
| CANADA | 35749600 | 40.5 | 15873016 | 444 |
| ENGLAND | 54000000 | 40 | 22659980 | 420 |
| UNITED STATES | 316500000 | 37.8 | 133600000 | 423 |
| CALIFORNIA | 39144818 | 35 | 14253090 | 364 |
Notes: Age, population estimates came from public data sets. For Canada, Statistics Canada. For England, the United Kingdom National Center for Statistics. For US and California, the US Census Bureau. The 2013 US population was used for this table because it was the most recent year that national data on ED visits was available from the American Hospital Association. ED utilization estimates for Canada were from the National Ambulatory Care Reporting System; for England, the House of Commons Library. California ED visits were from the Office of Statewide Health Planning and Development
Global causes of high ED utilization include: inadequate access to unscheduled ambulatory care, inadequate primary care workforces, delays in specialized care due to insufficient providers or payments, and geographic barriers to care. Many developed countries also struggle with aging populations with multiple chronic conditions (MCC)1,3. Acute care providers often face challenges to meet the needs of sub-populations with acquired or developmental disability, substance abuse and behavioral health disorders.
In 2015, ED utilization by Californians was notably lower at 364 per thousand. Without formal risk adjustment, some of the variation may be attributed to California's slightly younger population (35 v. 37.8-40.3). The population of California is also more diverse than the US overall: Hispanics (39%) now exceed white non-Hispanics (just under 38%). Asians are the third largest ethnic group in California (13%] and African Americans are the fourth4. The US Census Bureau estimated the total population of California at 39144818 persons in 20155.
Of interest, per capita ED utilization in California was lower before expansion of public and private health insurance under the Affordable Care Act (ACA) in 2014. This behavioral effect has been attributed to new beneficiaries of public and private coverage. By 2015 less than 10% of California residents lacked health insurance coverage6, of whom 1.5 million were ineligible due to their immigration status7.
OVERVIEW OF CALIFORNIA EMERGENCY CARE SYSTEMIn 2015, the Office of Statewide Health Planning and Development [OSHPD] reported there were 7558 treatment stations in 328 public and private hospitals with ED's8. That year there were 12367716 visits to California's ED's who were discharged following treatment, and another 1885374 visits that required hospitalization statewide.
Prehospital Care AdministrationThe three-digit 911 standard was adopted by the US telephone industry in 1968. Public Safety Answering Points to coordinate police, fire, and emergency medical service (EMS) responses were widely implemented by local governments over the following decade. Funding for the 911 communications infrastructure is covered by surcharges on telephone users. Present-day residents of California have ubiquitous access to pre-hospital emergency medical services as a result. In 2013, the California Ambulance Association reported that 3600 ambulances were operating in California; 74% by 170 private companies and 26% by public agencies, primarily fire departments. The association estimated 2.7 million ambulance transports in California during 2013, almost 90% of which were for emergency medical response or interfacility transport requiring medical care9.
Ambulance response to EMS dispatch is structured by local government agencies. Contracts areperiodically opened for competitive bidding between ambulance companies. Agencies typically include performance benchmarks for response times for Basic Life Support (BLS) and Advanced Life Support (ALS) calls and other quality indicators. In all cases, service agreements offer geographic exclusivity for single-incident calls to prevent unnecessary duplication of pre-hospital emergency transportation. Mutual aid agreements define disaster or mass-casualty situations when multiple ambulance service providers are needed. In metropolitan areas, paramedics are extensively trained above ALS level and are usually employed by fire departments. All fire personnel are typically certified at BLS level and act as first-responders to EMS calls. In some cases, paramedics are employed by ambulance transport companies. In rural areas, fire personnel are more likely to be BLS certified volunteers with paramedical training at an intermediate level known as Emergency Medical Technician.
California's statewide EMS authority is responsible for maintaining standards for emergency facilities and personnel. Standards are categorized under state law because of the wide range in training, equipment, and capabilities between rural and urban areas of the state. There are six multi-county EMS agencies that are responsible for 30 rural counties. Metropolitan counties administer local EMS agencies that coordinate pre-hospital care, ED services available at each hospital, and some specialized services, such as trauma and stroke care. Hospitals can define which medical and surgical specialties are available through the ED, provided they meet standards defined under state law.
Emergency Care Coordination in Urban AreasEMS agencies in metropolitan counties with the largest number of acute care hospitals feature the most advanced care coordination between pre-hospital and ED personnel. In 2015, Los Angeles County had 9818605 residents, 73 hospitals receiving EMS patients, 2002 ED treatment stations serving slightly more than 3 million ED patients. Because Los Angeles also has large numbers of medical and surgical specialists, interventions for time sensitive conditions are available at many paramedic receiving hospitals. In 2015, the Los Angeles EMS Agency reported 3946 pre-hospital STEMI cases based on paramedic interpretation of initial ECG. At receiving ED's with interventional cardiologists on call, 1364 patients underwent cardiac catheterization, including 1088 undergoing percutaneous coronary intervention (PCI). Intervention was deemed unnecessary in 2585 patients with STEMI designations by paramedics because of discordant ECG interpretation in the receiving ED or other medical contra-indications. For PCI patients, median time from EMS medical contact to balloon was 76minutes and median time from ED arrival to balloon was 58minutes10. The agency reported similar benefits from the multi-level country trauma system.
Rural Emergency DepartmentsAt the beginning of 2015 OSHPD reported that there were 58 ED's in hospitals with 75-beds or less in rural areas of California. Most operate with low patient volumes and narrow scope of specialty services backing up emergency physicians. Forty-two hospitals (68%) operated as Basic ED's with physicians on duty in the department at all times. Eighteen (28%) operated as Standby facilities, where the emergency physician may not be present but is available for rapid response. In many remote regions, the physician or advanced practice providers on duty in the ED is the only one available for primary care as well. Nurse practitioners and physician assistants with experience in emergency medicine are increasingly important in rural facilities in California and other states.
OPPORTUNITIES FOR IMPROVEMENTUniversal Access Without Universal coverageIn 1966, the US enacted Medicare, public insurance for the elderly, and Medicaid, public insurance for the poor. Medicare is administered by the federal government, though a growing percentage of beneficiaries receive services through Medicare Advantage (MA), private insurance companies contracting with the federal government. Because it is partially funded and operated by state governments, Medicaid (MediCal in California), has evolved in a much less uniform manner, leaving tens of millions of US residents in many states living below the poverty level without health insurance coverage11.
Widely-publicized failures of some hospitals to provide adequate screening and stabilization for emergency conditions resulted in the next step toward to universal US care. In 1986, President Reagan (previously California's Governor), established emergency care as the first health service protected under federal law for all US residents. The Emergency Treatment and Active Labor Act (EMTALA)was structured as a mandate on hospitals participating in Medicare rather than a program directly funded by the US government12. Hospitals were required to uniformly screen and treat all patients for emergency conditions without respect to their ability to pay, including hospitalization if medically necessary. Because 16-18% of US residents lacked any health insurance coverage, this created a large burden of uncompensated care for providers involved in emergency services13.
Because Medicaid (and to a lesser extent Medicare) do not cover the full cost of emergency care for their own patients, most hospitals attempted to shift the cost of uncompensated emergency care to ED patients with private health insurance (Figure 1) 14. As ED visits and emergency hospitalizations by uninsured US residents continued to rise, cost-shifting by hospitals and physicians providing emergency services became an important political rationale for the ACA, enacted along partisan lines by Congress and President Obama in 2010.
ENHANCING PRIMARY CARE AND POST-ACUTE CARE. 2014 May; 33(5): 792–799.")
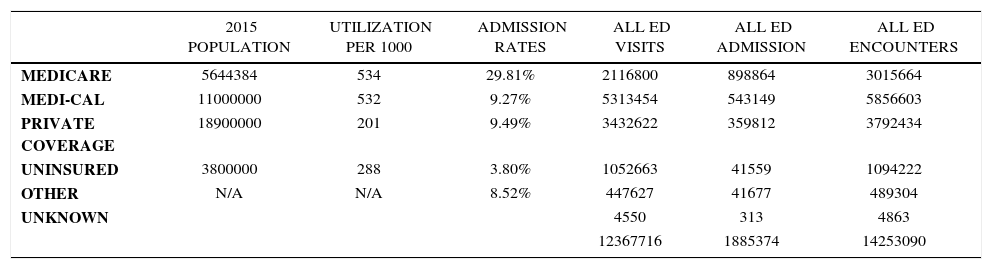
On a per capita basis, the elderly and the poor remained the most frequent visitors to California ED's in 2015 (Table 2). ED utilization continues to vary widely by health insurance programs. This is seen most clearly in the high rates of utilization by Medicaid members; a systemic deficiency and a chronic concern of policy makers15. Because overall payment rates are low compared to other health insurance programs, few primary or specialty physicians in the community are willing to treat Medicaid beneficiaries in private practices. Most private health insurance programs seek to control ED utilization with increasing share of costs. In patients without MCC, financial incentives have been shown to increase likelihood to use community clinics with lower cost structures than hospitals for their lower-acuity problems16.
CALIFORNIA EMERGENCY DEPARTMENT VISITS AND UTILIZATION PER THOUSAND BY INSURANCE - 2015
| 2015 POPULATION | UTILIZATION PER 1000 | ADMISSION RATES | ALL ED VISITS | ALL ED ADMISSION | ALL ED ENCOUNTERS | |
|---|---|---|---|---|---|---|
| MEDICARE | 5644384 | 534 | 29.81% | 2116800 | 898864 | 3015664 |
| MEDI-CAL | 11000000 | 532 | 9.27% | 5313454 | 543149 | 5856603 |
| PRIVATE COVERAGE | 18900000 | 201 | 9.49% | 3432622 | 359812 | 3792434 |
| UNINSURED | 3800000 | 288 | 3.80% | 1052663 | 41559 | 1094222 |
| OTHER | N/A | N/A | 8.52% | 447627 | 41677 | 489304 |
| UNKNOWN | 4550 | 313 | 4863 | |||
| 12367716 | 1885374 | 14253090 |
Notes: Data on insurance coverage of the population in California came from the Kaiser Family Foundation. All data on ED visits and admissions were from the Office of Statewide Health Planning and Development
Beneficiaries of Medicare, which covers Californians over 65 years old or with permanent disability, have more chronic health conditions, resulting in higher rates of ED utilization than younger ED patients. Since the elderly and chronically ill have the highest risk of hospital admission and readmission from the ED, the Medicare program is placing more emphasis on the quality of post-acute care and transitions of such patients back to the community and their primary care providers17.
Economics of Hospital Closures and Rising ED VisitsThe number of hospitals offering emergency care has been steadily decreasing for many years. Studies have shown that lower-income areas are most often impacted by this trend18. Some of the capacity loss has been offset by increasing numbers of beds and treatment areas in the remaining ED's. Between 2004 and 2013, OSHPD trend data showed emergency department beds increased 34% while emergency department visits grew by 40%. The average treatment station was used by 1727 patients per year, or 4.73 patients per day.
ED Capacity and OvercrowdingFor 2014, California hospitals reported 306085 patients had left their ED's during the year without being seen. They also reported 72572 total hours of diversion time, when their ED's were operating beyond capacity and unable to accept new patients arriving by ambulance. Peak hours on diversion were in January 2014, when ED's statewide were closed to ambulance patients 4.09% of the time. During a twelve-month period ending in March 2014, they reported the average time for patients admitted to inpatient status to reach their hospital beds from arrival in the ED was 340minutes19.
Frequent Visitors to Emergency DepartmentsOne of the systemic challenges facing crowded ED's is that large percentages of visits are attributable to a very small number of patients. A recent Harvard study suggested that more than one set of independent demographic and functional metrics can be used to predict which ED patients are at greatest risk for admission or readmission20.
A study published in 2015 from UCSF based on ambulance transport data in San Francisco showed two important sub-populations that are consistent with the finding of other studies of frequent ED visitors. Moderate use (2-4 ambulance arrivals per year) is strongly associated with older age, fragility, and MCC. Many also have deficits in cognition, mobility, and community care presenting challenges to primary care. Super-users (15 or more ambulance arrivals per year) tended to be middle-aged, male, with a strong association with acute-on-chronic alcohol use. Super-users accounted for only 0.3% of all ED patients but consumed more than 6% of all EMS/ED resources during the study period21.
Psychiatric Emergency CareAt the beginning of 2015, there were only 29 hospitals licensed by the state of California for acute psychiatric care with only 2557 beds. During 2014 they rendered only 683669 days of inpatient care during 90493 admissions for psychiatric care. Such facilities are often legally structured to isolate them from requirements on general acute care hospitals to screen and stabilize all patients for emergency medical conditions. The total number of acute inpatient psychiatric beds has been dropping for several decades in the US because of changes in treatment and health insurance payment standards.
Because of unmet needs in communities, multiple studies have shown that 10-12% of all ED visits are now because of mental health emergencies, often compounded by substance abuse issues. Waiting or boarding times for ED patients with psychiatric emergencies has been reported at 10-12hours in California, and is often measured in days for patients without private health insurance. Some communities are beginning to develop specialized outpatient treatment centers for behavioral health. Under the Psychiatric Emergency Service model (PES) developed in Alameda County, after intensive assessment and treatment, most patients with urgent mental health problems can be safely discharged home. Waiting times in Basic ED's able to transfer patients with psychiatric emergencies to PES facilities have dramatically dropped23.
INTEGRATING EMERGENCY CAREIn 2015, most health care in California was provided through three separate industries. With some exceptions in rural areas and government-owned facilities, California's hospitals were privately operated in competition with each other. Government-sponsored health insurance programs like Medicare and MediCal operated separately from several dozen private health insurance programs. And the vast majority of physicians continued to practice in small, single-specialty groups in one region. The fragmented nature of all three industries contributed to many of the inefficiencies of emergency care in California described above.
In contrast, approximately 18% of California residents are covered by closely related entities known collectively as Kaiser Permanente. KP includes a non-profit health insurance program, a non-profit system of hospitals, and the Permanente medical groups, which operate many of their own clinics. As a population, KP members were shown to be comparable to Californians covered by other private health insurance programs in terms of age, race, and employment status; KP members had lower mean income level24. Kaiser contracts with Medicare to care for nearly one million members of their MA program in California. Making up nearly 13% of all KP members, this population of elderly or permanently disabled Californians had risk adjustment scores comparable to the rest of Medicare members in California (0.935 and 0.947, respectively for Northern California, and 0.969 and 0.977 for Southern California).
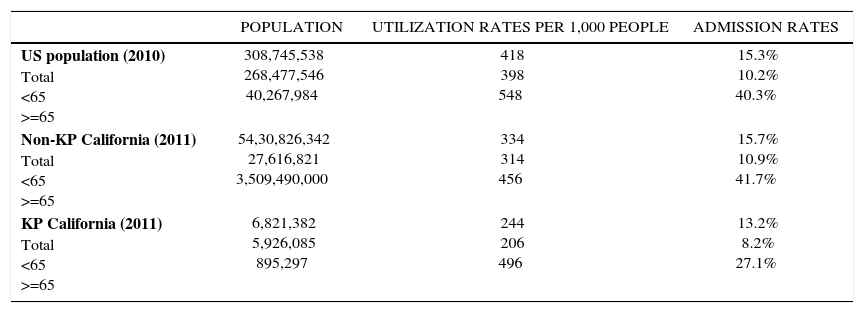
KP is also the largest integrated care system in the US, referred to as an ‘accountable care organization’ (ACO) in the ACA. KP aspires to achieve the Triple Aim: improving the care of individual patients, promoting overall population health, and reducing per capita health insurance costs. Because KP is unique in California in terms of scale as well as integration, it may provide a model for optimizing the acute care continuum. Several outcome trends were seen in a recent study of the KP population requiring acute care in 2011(Table 3) 25. Key findings included: KP members less than 65 had lower ED visit rates than the rest of the California population; KP members over 65 were more likely to visit the ED than other California residents over age 65. Most significant, however, is that KP seniors were a third less likely to be admitted to inpatient status from the ED, when compared to Californians over 65 treated in community ED's. These outcomes were based on KP strategies and practice protocols which contrast with their competitors in the insurance and hospital industries, and most of California's medical community.
EMERGENCY DEPARTMENT UTILIZATION AND HOSPITAL ADMISSION RATES FOR THE US, CALIFORNIA, AND KAISER PERMANENT (KP) MEMBERS, 2010 AND 2011
| POPULATION | UTILIZATION RATES PER 1,000 PEOPLE | ADMISSION RATES | |
|---|---|---|---|
| US population (2010) Total <65 >=65 | 308,745,538 268,477,546 40,267,984 | 418 398 548 | 15.3% 10.2% 40.3% |
| Non-KP California (2011) Total <65 >=65 | 54,30,826,342 27,616,821 3,509,490,000 | 334 314 456 | 15.7% 10.9% 41.7% |
| KP California (2011) Total <65 >=65 | 6,821,382 5,926,085 895,297 | 244 206 496 | 13.2% 8.2% 27.1% |
+ Notes: This table was originally published in Selevan J, Kindermann D, Pines JM, Fields WW. What Accountable Care Organizations Can Learn from Kaiser Permanente California's Acute Care Strategy. Popul Health Manag. 2015 Aug;18(4):233-6. Statistics on national and California specific ED utilization and admission rates come from publicly available datasets. For national data, we used the Healthcare Cost and Utilization Project's National Emergency Department Sample (NEDS), the largest all-payer ED database in the US. 16 The most recent data available from the NEDS was 2010. For California data, we used the 2011 State of California's Office of Statewide Health Planning and Development Emergency Department and Ambulatory Surgery Data (treat and release patient visits) and Patient Discharge Data (admitted patient visits).17 Data on KP's utilization and admission rates came from the Management Information and Analysis department at KP California.9
One of the common criticisms of US emergency care is over-utilization of advanced imaging and other ancillary services. Another is medical errors based on inadequate data regarding allergies and medications of individual patients. A third is transitions of care in the ED not based on a complete understanding of each patient's established medical conditions and care plans. Many of these challenges are mitigated for KP emergency physicians because of their ability to access real-time medical information through a system-wide electronic health record [EHR]. Most EHR systems in California, as elsewhere in the US, are financed by hospital systems based on government mandates, but not shared outside their own secure environment. The multi-billion dollar EHR project financed by the KP insurance program was designed to optimize data-sharing between clinics, hospitals, and physicians treating KP patients.
TelemedicineIn part because of the observations of Billings on Medicaid populations in New York City, a common refrain of US health policy makers is that a large percentage of ED patients could or should be safely treated in community settings. To reduce ED utilization, however, urgent care for ambulatory patients must be timely as well as affordable. KP is one of the few ACO's to make significant investments in combining their EHR with clinic capacity for unscheduled care, and telephone advice centers staffed by nurses with ED experience. KP OnCall provides all plan members with 24/7 access to medical advice, protocol-based algorithms identifying patients needing immediate evaluation in ED's. In 2011, KP OnCall processed 850,000 calls from KP members; most of whom were treated without referral to ED.
Post Stabilization Care and RepatriationIt is inevitable that many acute illnesses and injuries within ACO populations will occur when individual patients are at work or away from their primary clinic and hospital. Approximately 15% of KP member ED visits occur at non-KFH EDs. In California, the KP Emergency Prospective Review Program (EPRP) is staffed 24/7 by emergency physicians and ED nurses, coordinating KP patient care by non-KP providers in community EDs. When medically indicated, EPRP providers also assist with inter-facility transfers of KP patients back to KP facilities, including physician-level critical care transport. Thus, thousands of high-risk KP patients each year are safely repatriated without deleterious clinical outcomes26.
Urgencia as Hub for Complex ConditionsIn the RAND study on the role of ED's in the US system, the single largest cost center for most health insurance programs was noted to be hospital care27. Most of KP competitors in the private insurance market, as well as MA contracting with Medicare for senior populations, attempt to control hospital costs by viewing ED visits as a negative metric; a failure of primary care and disease management. The RAND study also noted, however, that an ED visit is only one tenth of the cost of an inpatient hospital stay.
KP is somewhat unique among ACO's in its preferential use of the ED over primary clinics to rapidly evaluate more complex or high-risk conditions, as well as acute exacerbations of many chronic diseases. KP programs direct members with lower-acuity conditions to other points of care, preserving ED capacity and resources for emergency physicians and related specialists to collaborate on more intensive, prolonged ED related care for complex or high-acuity KP patients, often preventing the need for hospitalization, and delivering post-acute care in other settings. Selevan et al reported ED use of the KP disease management protocol for congestive heart failure resulted in lower rates of readmission, return ED visits and 90-day mortality rates in their 2011 outcomes study.
Alignment of IncentivesKP programs are pre-paid fixed amounts of insurance premiums for its private members, and larger amounts by Medicare for elderly members in their MA program. KP also intends to keep members enrolled in their programs for many years by delivering high-value care; the Triple Aim. Most emergency physicians in California are paid by the number of patients they treat and how many procedures they perform. Emergency physicians in KP are more likely to be paid a flat salary, with rewards for optimizing hospital care. This is reflected in lower admission rates at KP hospitals than non-KP hospitals than patients treated in other ED settings in California or across the US. A complex set of checks and balances in the contracts between KP entities protect patient safety or discourage cost-shifting. Evidence based medical practices in KP also help control costs without negatively impacting outcomes28.
CONCLUSIONCalifornia, along with neighboring Oregon and Washington, has the fewest number of hospital beds per capita of any US state29. Now that RAND has affirmed the ED has become the primary portal of entry for hospital admissions, it is also the last if not best place to safely manage demand for inpatient care. The non-partisan Congressional Budget Office has predicted that the trust fund for hospital services in the Medicare program will be unable to pay the full cost of projected care by 202830. States face similar challenges for Medicaid programs31. Most states are seeing rapid rise in the price of coverage through ACA exchanges, with fewer private insurance companies participating32. Acute care stakeholders need to aim higher than saving individual lives. They must align to save essential systems of acute care.
The author declare no conflicts of interest, in relation to this article.
recomendados