


This paper presents the Vocalization–Silence Dynamic Patterns (VSDP) method for the analysis of coordination in psychotherapeutic conversation. The objectives of its development are to empirically account for vocal coordination patterns in dialogs and to examine the association between interactional coordination and positive relational outcomes. The VSDP method makes it possible to demonstrate that vocal activity is a nonverbal phenomenon entwined with and which influences the linguistic code. The analyses which can be carried out through this method are illustrated with real acoustic signals taken from psychotherapy segments. The VSDP method is discussed, considering its usefulness for psychotherapeutic research as well as the study of dyadic conversation within other scenarios.
Este trabajo presenta el método de Patrones Dinámicos de Vocalización–Silencio (PDVS) para el análisis de la coordinación en la conversación psicoterapéutica. Los objetivos de su desarrollo son dar cuenta empíricamente de los patrones de coordinación vocales en diálogos y examinar la asociación entre la coordinación interaccional y los resultados relacionales positivos. El método PDVS hace posible demostrar que la actividad vocal es un fenómeno no verbal entrelazado con y que influye en el código lingüístico. Los análisis que se pueden realizar a través de este método se ilustran con señales acústicas reales tomadas de segmentos de psicoterapia. El método PDVS es discutido teniendo en cuenta su utilidad para la investigación en psicoterapia, así como para el estudio de la conversación diádica dentro de otros escenarios.
The study of coordination in dyadic interaction has traditionally been based on two notions: this phenomenon is present in nearly all the aspects of our social lives; and, interpersonal coordination is part of the kind of behaviors we conduct in our everyday face-to-face interactions (Tschacher, Tomicic, Martínez, & Ramseyer, 2012). Likewise, it has been observed that we attain better coordination when we interact with others we like, and, on the other hand, problems in our coordination with others may result in feelings of frustration and alienation (Ramseyer & Tschacher, 2014; Tschacher, Rees, & Ramseyer, 2014). This has prompted the development of a series of studies that seek to establish the association between interpersonal coordination and rapport, and the result or quality of interpersonal relationships (Bock, Huber, Peham, & Benecke, 2015; Tschacher et al., 2012). In the field of psychotherapeutic interaction, interpersonal coordination has been mainly studied in non-verbal terms. Specifically, these studies have focused on the analysis of facial expression (e.g. Bock et al., 2015; Merten, 2005), of body movements (e.g. Nagaoka & Komori, 2008; Ramseyer & Tschacher, 2014; Tschacher et al., 2014) and, to a lesser extent, of vocal quality (e.g. Holtz, 2004; Reich, Berman, Dale, & Levitt, 2014; Tomicic, Martínez, & Krause, 2014; Tomicic et al., 2015).
According to Scherer (1982), lack of studies on vocal phenomena in the past is due to the technical difficulties involved in the recording and analysis of sound, but mainly to the notion that vocal activity is governed by the rules of language, and that – consequently – it cannot be considered non-verbal behavior as such. Nevertheless, this author also proposes that this is a wrong assumption, for two reasons: (a) many human vocalizations are essentially non-linguistic (such as spontaneous vocalizations of affection or interjections) and, (b) not all aspects of speech are verbal or linguistic in nature. All sentences produced by humans are characterized by a high number of non-linguistic or non-verbal aspects, such as intonation, vocal quality, and rhythm. These are the aspects that combine with and modulate the mainly verbal or linguistic code of speech (Scherer, 1982).
The study of human voice in psychotherapy is especially relevant, since it is the main medium (although not the only one) through which verbal communication occurs in psychotherapeutic dialog. Likewise, the sound of speech can be one of the main sources of information about the meaning of the acts performed in patient–therapist communication (Buchholz, 2014; Knoblauch, 2000).
Jaffe and Feldstein (1970) developed a model of communication in dyadic systems through the empirical study of vocal rhythm coordination in adult dyads. They defined vocal rhythm as pause–vocalization cycles, and coordination as an interpersonal contingency (co-action), so that a participant vocal rhythm can be predicted based on that of the other. In order to analyze the dyadic coordination of vocal rhythm, the aforementioned authors defined five vocal states: speaker switches, vocalizations, pauses, exchange pauses, and simultaneous speech (Feldstein & Welkowitz, 1978; Jaffe, Beebe, Feldstein, Crown, & Jasnow, 2001).
Following the model developed by Jaffe and Feldstein (1970), we created the Vocalization–Silence Dynamic Pattern (VSDP) system, whose development pursues two underlying objectives: to empirically account for vocal coordination patterns in dialogs conducted in psychotherapeutic settings, and to examine the hypothesis of the association between vocal coordination patterns and positive relational outcomes.
MethodSegmentation and preparation of the acoustic signalThe first aspect – encountered even before applying the VSDP method – is the large amount of information produced by a digital acoustic recording. The issue with this quantity of information is not practical but a theoretical one: how to determine which parts are relevant? For the case of the study of the psychotherapeutic process this question has been answered by researchers of the so-called microprocess (Lambert, 2013; Orlinsky, Ronnestad, & Willutzki, 2004). Microprocess studies have shown that psychotherapy is made up by a series of segments, periods, or phases whose causal and temporal relationships are complex, and not necessarily linear (Orlinsky et al., 2004). Therefore, researchers have begun trying to identify relevant episodes (e.g. change and stuck episodes; Fernández et al., 2012)
Therefore, when using the VSDP system, the first step for the analysis of vocalization–silence coordination patterns consists in the selection of relevant episodes. By means of a temporal delimitation, these segments make it possible to reduce the amount of information to be analyzed, and, at the same time, enable researchers to assign a meaning to the results of such analysis within the context of the full interactional process from which they were taken.
A second step involves extracting the audio from the video recording and cleaning the audio signal thus obtained. The audio from the whole DVD-recorded session was extracted using AoA DVD Ripper 5.1.9. (AoA Media, 2008). Subsequently, Audacity 2.0.2 (Ash et al., 1991) was used to segment the audio fragment corresponding to the relevant episodes.
Since the audio recording of real dyadic interaction, like psychotherapeutic sessions, is carried out in a non-experimental fashion, the signal extracted contains three types of sounds: vocalizations (sounds uttered by the participants of the conversation, modulated by linguistic codes), noise (environmental sounds, not articulated or modulated by linguistic codes), and silence (absence of noise or vocalization).
In order to clean the noise from the recording, Audacity 2.0.2 Effects/Noise Reduction tool was used. It makes it possible to obtain the profile or frequency of the noise selected and subtracts it from the original signal. To check the result of this procedure, a human observer (the first author of this paper) heard the entire segment to be sure to erase only the noises.1
Definition of parameters for the calculation of Vocalization–Silence Dynamic PatternsThe VSDP system makes it possible to evaluate the degree of periodicity in the participant interaction through the joint use of two graphic approaches: Vocalization–Silence Scattergrams and Vocalization–Silence Dynamic Graphs. Periodicity measurement is used as an indirect indicator of vocalization–silence coordination. This is based on the assumption that the coordination of two participants is the property that makes observation of said regularity possible, that is to say, a pattern (Bernieri & Rosenthal, 1991). Vocalization–Silence Scattergrams enable researchers to examine the presence of regularities in the relevant segments, considering the degree of dispersion or clustering of the points, whereas Vocalization–Silence Dynamic Graphs display how these regularities or patterns take place over time.
In order to create both graphs (Vocalization–Silence Scattergram and Vocalization–Silence Dynamic Graph), certain parameters are required for automatically determining vocalizations and silences.
Reduction of signal points: In order to reduce the number of points of the signal to be analyzed, “1 every 2 points” and “1 every 6 points” are sampled depending on the number of points of the whole signal. The objective sought is to lower the size of the signal in terms of bytes.
Extraction of signal envelope: In order to extract the signal envelope, the analytic signal ζ(t) is calculated, as described in Le Van Quyen, Martineire, Navarro, Baulac, and Varela (2001).
where s˜ is the Hilbert transform computed as:where the integral is taken in the sense of Cauchy Principal Value.
The process consists in softening the real signal described above – s(t) –, by adding an imaginary part – s˜(t) – which is calculated through a Hilbert transform. The advantage of transforming a real signal into an analytic one is that, in the latter, it is possible to instantaneously define its amplitude (or envelope – A(t) –) and its phase ejφ(t).
Given the speed of the transients (changes) present in the acoustic signal, a final smoothing step is carried out by applying a 1000-point moving average window.2
Automatic determination of vocalizations and silences: A threshold is defined in order to automatically determine vocalizations and silences. This makes it possible to discard the baseline noise level of the recording, and that is a remnant of the previous steps for the preparation of the signal.
Vocalization–Silence Scattergram: It must be stressed that Vocalization–Silence Scattergrams are not an original idea, but an adaptation of Poincare sections or Stroboscopic Maps (Solari, Natiello, & Mindlin, 1996). Vocalization–Silence Scattergrams are built based on the automatic determination of vocalizations and silences. The x axis plots the length of a vocalization, while the y axis graphs the length of the subsequent silence. The resulting scattergram makes it possible to evaluate regularity levels (through dispersion or clustering criteria) and the characteristics of such patterns. Based on percentile distribution of vocalization values (R .001–610.39, Mdn .80, M 8.44) and on percentile distribution of silence values (R .001–67.25, Mdn .34, M 1.80), the following criteria were established for determining vocalization–silence patterns (see Fig. 1).

Pattern A of vocalization–silence: Comprise by short vocalizations (<0.023s) followed by short silences (<0.023s), short vocalizations (<0.023s) followed by short/middle silences (>0.023 to ≤0.144s), short/middle vocalizations (>0.023 to ≤0.202s) followed by short silences (<0.023s), and short/middle vocalizations (>0.023 to ≤0.202s) followed by short/middle silences (>0.023 to ≤0.144s).
Pattern B of vocalization–silence: Comprise by short vocalizations (<0.023s) followed by middle/long silences (0.636 to ≤2.03s), short vocalizations (<0.023s) followed by long silences (>0.023s), short/middle vocalizations (>0.023 to ≤0.202s) followed by middle/long silences (0.636 to ≤2.03s), and short/middle vocalizations (>0.023 to ≤0.202s) followed by long silences (>0.023s).
Pattern C of vocalization–silence: Comprise by middle/long vocalizations (1.64 to ≤8.16s) followed by middle/long silences (0.636 to ≤2.03s), middle/long vocalizations (1.64 to ≤8.16s) followed by long silences (>0.023s), long vocalizations (>8.16s) followed by middle/long silences (0.636 to ≤2.03s), and long vocalizations (>8.16s) followed by long silences (>0.023s).
Pattern D of vocalization–silence: Comprise by middle/long vocalizations (1.64 to ≤8.16s) followed by short silences (≤0.023s), middle/long vocalizations (1.64 to ≤8.16s) followed by short/middle silences (>0.023 to ≤0.144s), long vocalizations (>8.16s) followed by short silences (≤0.023s), and long vocalizations (>8.16s) followed by short/middle silences (>0.023 to ≤0.144s).
Vocalization–Silence Dynamic Graphs: Vocalization–Silence Dynamic Graphs are built based on the automatic determination of vocalizations and silences. The average value of the points in a 5-second window is plotted: the y axis represents values between 1 (vocalization) and 0 (silence). The x axis graphs the extension of the signal divided into 5-second windows. The length of the time window was defined considering, on the one hand, that conversations tend to be dominated by vocalizations, and, on the other hand, that a silence over 2s long can be relevant.
As can be observed in Fig. 1, the y axis graphs the average values in the 5-second non-overlapping sliding window that advances from the beginning to the end of the signal. Each resulting value shows if a given 5-second conversation segment was dominated by vocalization, silence, or was equally shared by both vocalization and silence. Additionally, the values corresponding to 1.96 standard deviations above and below the average of the whole signal are established. In this way, it is possible to evaluate which values remain within the pattern (that is, within the confidence interval) and which break the pattern in a statistically significant manner. Finally, a stricter additional criterion is defined to consider an average value as displaying a tendency toward silence. This criterion requires an average equal to or lower than 0.4, since it represents a 60% of silence, that is to say, at least 10% more silence than vocalization.
Application and interpretation of the Vocalization–Silence Dynamic Pattern (VSDP) system using change and stuck episodes in psychotherapyIn order to illustrate the application and the interpretation possibilities offered by the VSDP system for the study of vocalization–silence coordination between the participants of a dyadic conversation, the analysis of six change and six stuck episodes taken from a short-term psychoanalytic therapy is presented below.
The patient was a 32 year-old single female, with undergraduate university studies. She asked for help to understand her relationship with her family and to cope with her difficulties in establishing a stable romantic relationship and to cope with the emotions derived from a health problem. The 50-year-old male therapist had over 15 years of professional experience as a psychiatrist and psychoanalyst. The patient received 31 sessions of therapy. The whole treatment was evaluated by means of an outcome measurement using the Outcome Questionnaire 45.2 (OQ-45.2). The patient's OQ score at the third session was 33, while her OQ score at the last session was 34; that is, in terms of this measurement, she was classified within the functional population (von Bergen & de la Parra, 2002) both at the beginning and the end of the therapy (von Bergen & de la Parra, 2002). Nevertheless, from the point of view of the Generic Change Indicators (GCIs, see Krause, Altimir, Pérez, & de la Parra, 2015), the therapy was successful, considering the number of changes (46 intra-session and 19 extra-session changes) and their high level in the whole process. As it is shown in Fig. 2, the percentage of level I GCIs (Initial consolidation of the structure of the therapeutic relationship) is lower in the final phase than the initial, meanwhile the percentage of level III GCIs (Construction and consolidation of a new understanding) is bigger in the final stage of the psychotherapy than in the initial one (Fisher exact probability test, p<0.01). In light of the above, it is possible to state that this therapy showed a positive evolution from the GCIs point of view.
 correspond to analyzed episodes.")
All sessions were audio and video recorded for later analysis. The patient and the therapist were extensively informed before commencing therapy and consented to video and audio recordings and data collection at all times.
For the upcoming analysis, the sample comprised 12 episodes, 6 change episodes and 6 stuck episodes. Identification of change and stuck episodes was performed by coders trained by the Chilean Research Program on Psychotherapy and Change.
The sequence of 19 GCIs that makes it possible to identify specific events, called change moments during which a transformation in subjective meaning takes place was used. These constituted an observer-based method for the evaluation of micro-changes as they occur during therapy sessions, allowing identifying what is changing in the moment-to-moment process (Krause et al., 2015). In turn, a change episode is an interaction segment in a psychotherapeutic session in which a patient's microchange takes place. In the rating procedure, this moment marks the end of the episode. At this point, a rater establishes the beginning of the episode by identifying the moment when the participants start conversing about the content of the change (Krause et al., 2007).
Considering the conceptual meaning of each GCI, these can be divided into three levels that reflect the different phases of the psychotherapeutic change process (Krause et al., 2015). The first level is named Initial consolidation of the structure of the therapeutic relationship, because the change indicators that belong to this category reflect the relevance of the establishment of the psychotherapeutic contract and relationship before the start of the process of construction of new explanations about the patient's problems. The second level is considered a medial one, and was named Increase in permeability. The change indicators of this cluster refer to several kinds of observed transformations with respect to patient's emotions, cognitions and behaviors. Finally, the change indicators corresponding to the third level, named Construction and consolidation of a new understanding, reflect the patient's elaboration of a new subjective theory and his or her autonomous use of the psychological context of interpretation.
As a way of identifying episodes of contrast, Fernández et al. (2012) have coined the notion of stuck episodes. The researchers define stuck as a temporary halting of the patient's process of change due to the reedition of his or her problem during the therapeutic session. They characterize this reedition as the persistence of forms of understanding, behavior and emotion that contribute to sustaining the problem and stopping the progression of change as described by change indicators (Fernández et al., 2012).
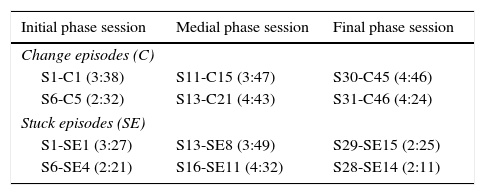
The selection of these episodes was deliberate, to choose change episodes belonging to each of the phases of the psychotherapy process: initial (session 1 to session 10), medial (session 11 to session 20) and final (session 21 to session 31). Also, the selection was deliberate to match the choice of initial phase change episodes with those with an initial (Level I) type of change, medial phase change episodes with those with an intermediate (Level II) type of change, and final phase change episodes with those with a more complex (Level III) type of change. The intent of this sample strategy was to represent in some way the ideal evolution of the process of change in psychotherapy. For the selection of stuck episodes, the criterion was that they should occur within the nearest session of the change episode selected previously (see Table 1).
Characterization of study sample.
| Initial phase session | Medial phase session | Final phase session |
|---|---|---|
| Change episodes (C) | ||
| S1-C1 (3:38) | S11-C15 (3:47) | S30-C45 (4:46) |
| S6-C5 (2:32) | S13-C21 (4:43) | S31-C46 (4:24) |
| Stuck episodes (SE) | ||
| S1-SE1 (3:27) | S13-SE8 (3:49) | S29-SE15 (2:25) |
| S6-SE4 (2:21) | S16-SE11 (4:32) | S28-SE14 (2:11) |
Note. S, Number of session. In bracket episode length (minute:seconds).
The results of applying the VSDP system to the sample of change and stuck episodes from a psychotherapeutic process are presented.
In order to obtain the Vocalization–Silence Scattergrams of the change episodes from each phase, each episode pair was analyzed as a single set of data. The same process was followed in the case of stuck episodes (see Fig. 3).
; short/middle (>0.023 to ≤0.202); middle (>0.202 to ≤1.64); middle/long (1.64 to ≤8.16); and long (>8.16). Silence: short (≤0.023); short/middle (>0.023 to ≤0.144); middle (>0.144 to ≤0.636); middle/long (0.636 to ≤2.03); and long (>2.03). Values are percentage of points of vocalization–silence corresponding to each pattern (change episode initial phase N=689; stuck episode initial phase N=863; change episode medial phase N=1229; stuck episode medial phase N=394; change episode final phase N=828; stuck episode final phase N=659).")
Voice–Silences Patterns in change and stuck episodes. Note: Vocalizations: short (≤0.023); short/middle (>0.023 to ≤0.202); middle (>0.202 to ≤1.64); middle/long (1.64 to ≤8.16); and long (>8.16). Silence: short (≤0.023); short/middle (>0.023 to ≤0.144); middle (>0.144 to ≤0.636); middle/long (0.636 to ≤2.03); and long (>2.03). Values are percentage of points of vocalization–silence corresponding to each pattern (change episode initial phase N=689; stuck episode initial phase N=863; change episode medial phase N=1229; stuck episode medial phase N=394; change episode final phase N=828; stuck episode final phase N=659).
The results indicate that – within the three phases of the psychotherapy – the change and the stuck episodes present the four prototypical patterns: (a) pattern of short vocalizations followed by short silences; (b) pattern of short vocalizations followed by long silences; (c) pattern of long vocalizations followed by short silences and (d) pattern of long vocalizations followed by long silences (see Fig. 1). Nevertheless, as can be seen in Fig. 3, in the initial phase the pattern D is more prevalent in the change episodes (34.8%) meanwhile the pattern A is more prevalent in the stuck episodes (41.2%). In turn, in the medial phase the dispersion of points of both types of episodes are concentrated mainly in the same patterns (A and D), but in this phase the stuck episodes show in a greater extend the pattern D (34.3%). Lastly, in the final phase, again, pattern A is more prevalent in the stuck episodes (31.7%) and the pattern D is more prevalent in the change episodes (27.1%).
A dispersion index was estimated for each point in the two-dimensional space (vocalization/silence), which accounts for its distance from a reference point (centroid). The centroid value was estimated using the classification command K-Means with 4657 data points, corresponding to 99.9% of total points within the space of the plane formed by the axes of vocalization/silence3 (SPSS; the cluster's centroid was vocalization .951 and silence 58.969).
The dispersion index was regressed by using the hierarchical regression (by means HLM 6.8) in a tree levels model. The micro-analytic level, that refers to the vocalization–silence point (Level-1, N=4657) nested in episode (Level-2, N=12), which is nested in psychotherapy session (Level-3, N=9).
Initially, a fully unconditional model was applied to the outcome variable, in order to estimate its reliability and the adequacy of the multilevel analysis. After that, a level-1 model was fitted. This model was conformed by the Intercept (vocalization–silence point at the beginning of the episode) and the slope (the expected change in vocalization–silence score per time). This variable (named Episode Time) was operationalized by a numerical sequence that accounts for the temporal sequence of the vocalization–silence point along the episodes (beginning in Zero).
In a second step, we searched those episode characteristics that predicted the Level-1 intercept and slope parameters. Thus, the type of episode predictor was included in the model as a Level-2 variable. Finally, at Level 3 (therapy session), therapy phase was modeled as predictor of the intercept to control this variable effect. Therapy phase was measured by the number of therapy sessions in which the episode occurs, distinguishing three phases (initial, medial and final). They were modeled as dummy variables in the regression equation, the medial phase being the reference category.
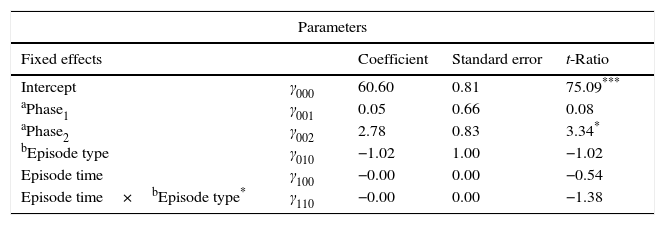
The results (see Table 2) show no differences between types of episode in the dispersion index intercept, t (8)=−1.02, p=.34, and slope, t (4651)=−1.38, p=.17. Instead statistically significant differences were observed in the average dispersion index considering the phase of therapy in which they occur. Specifically, the mean of the dispersion index of final phase is 2.78 points higher than medial phase average, t (6)=3.19, p=.02, (Mmiddle=60.60 vs. Mfinal=63.68), controlling by the others variables in the model.
Multilevel regression model for dispersion index.
| Parameters | ||||
|---|---|---|---|---|
| Fixed effects | Coefficient | Standard error | t-Ratio | |
| Intercept | γ000 | 60.60 | 0.81 | 75.09*** |
| aPhase1 | γ001 | 0.05 | 0.66 | 0.08 |
| aPhase2 | γ002 | 2.78 | 0.83 | 3.34* |
| bEpisode type | γ010 | −1.02 | 1.00 | −1.02 |
| Episode time | γ100 | −0.00 | 0.00 | −0.54 |
| Episode time×bEpisode type* | γ110 | −0.00 | 0.00 | −1.38 |
| Random effect | Standard deviation | Variance component | Chi-square |
|---|---|---|---|
| E | 13.63 | 185.66 | |
| r0 | 0.09 | 0.01 | Not estimated |
| u00 | 1.16 | 1.34 | 7.54** |
| u01 | 2.11 | 4.44 | 12.57** |
Note. Outcome variable is dispersion Index. Dichotomous and continuous predictors were not centered.
Although the analysis of Vocalization–Silence Scattergrams revealed some coordination patterns of vocal rhythm via the vocalization–silence regularities found throughout the psychotherapeutic process, the following results of the application of Vocalization–Silence Dynamic Graphs make it possible to observe how such regularities appear over the course of the change and stuck episodes analyzed.
In contrast with previous analyses, Vocalization–Silence Dynamic Graphs were obtained by analyzing each episode as an independent set of data. Considering the data set (n=693 windows average of 5s) and the criteria for establishing a trend toward silence (5s window average ≤0.40) or vocalization (mean 5s window ≥0.41) it was obtained the following distribution: 3.5% corresponding to silence and 96.5% are vocalization.
As can be observed in Figs. 4–6, there is one Vocalization–Silence Dynamic Graph per change and stuck episode in each phase. In addition, the graphs corresponding to each change episode pair and each stuck episode pair (defined according to the sampling procedure) are superimposed, in order to make visual comparisons easier.


The pair of change episodes from the initial phase of the therapy analyzed shows a trajectory with peaks toward vocalization and toward silence. Also, both episodes present breakdowns toward silence equal to or below the 0.4 criterion previously defined (see Fig. 4, above). The pair of stuck episodes from the initial phase shows a trajectory with peaks toward vocalization (see Fig. 4, below). In this case, there are no breakdowns toward silence below the 0.4 criterion. A comparison between change episodes and stuck episodes regarding the percentage of point below the criterion points shows that there are differences, X2 (1,143)=3.837, p=.05. In this phase, the change episodes show the 100% of the point below 0.4.
The pair of change episodes from the medial phase shows a trajectory with peaks toward vocalization and toward silence. Also, both episodes display breakdowns toward silence equal to or below the 0.4 criterion (92.9%; see Fig. 5, below). In the pair of stuck episodes from the medial, it is possible to observe breakdowns toward silence equal to or below the 0.4 criterion too (7.1%; see Fig. 5, below). The differences between both type of episodes are supported statistically X2 (1, 203)=10.672, p=.001.
One of the pairs of change episodes from the final phase shows a trajectory with peaks toward vocalization and toward silence. In contrast, the second one shows a trajectory with a sustained tendency toward vocalization. Nevertheless, both episodes show breakdowns toward silence below the 0.4 criterion (see Fig. 6, below). The pair of stuck episodes display peaks toward silence, and in one of them there are breakdowns toward silence below the 0.4 threshold (see Fig. 6, below). In sum, both type of episodes show equally a tendency toward vocalization with the 51.1% of the points above the criterion in the case of the change episodes and with the 48.4% of the points above the criterion in the case of the stuck episodes X2 (1, 347)=2.378, p=.123.
The average of silence–vocalization was modeled by using the hierarchical regression (by HLM version 6.8) in a tree levels Model. The micro-analytic level, that refers to the Sliding five second window (Level-1, N=693) nested in Episode (Level-2, N=12), which is nested in psychotherapy session (Level-3, N=9).
Initially, a fully unconditional model was applied to the outcome variable, in order to estimate its reliability and the adequacy of the multilevel analysis. After that, a level-1 model was fitted. This model was conformed by the Intercept (vocalization–silence score at the beginning of the episode) and the slope (the expected change in vocalization–silence score per window time). This slope represents the linear evolution of the Vocalization–Silence Dynamic Graph as the episode moves over the time. This variable (named episode time) was operationalized by a numerical sequence that accounts for the window sequence of 5s.
In a second step, we searched for episode characteristics that predicted the Level-1 intercept and slope parameters. So, type of episode predictor was included in the model as Level-2 variable. Finally, at Level 3 (Session), the effects of phase of therapy were modeled as predictor of the intercept to control this variable effect (following the same procedure indicated in p. 16).
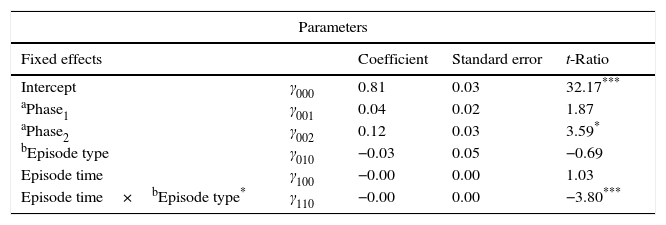
The results (see Table 3) show differences between type of episodes in the vocalization–silence average slope, t (687)=−3.80, p<.001, but not in the intercept, t (6)=−0.69, p=.51. As Fig. 7 shows, to the extent that the change episode progresses it shows a tendency toward silence. However, the opposite happens in the stuck episode, which is a trend toward vocalization.
Multilevel regression model for vocalization–silence average.
| Parameters | ||||
|---|---|---|---|---|
| Fixed effects | Coefficient | Standard error | t-Ratio | |
| Intercept | γ000 | 0.81 | 0.03 | 32.17*** |
| aPhase1 | γ001 | 0.04 | 0.02 | 1.87 |
| aPhase2 | γ002 | 0.12 | 0.03 | 3.59* |
| bEpisode type | γ010 | −0.03 | 0.05 | −0.69 |
| Episode time | γ100 | −0.00 | 0.00 | 1.03 |
| Episode time×bEpisode type* | γ110 | −0.00 | 0.00 | −3.80*** |
| Standard deviation | Variance component | Chi-square | |
|---|---|---|---|
| E | 0.16 | 0.02 | |
| r0 | 0.00 | 0.00 | Not estimated |
| u00 | 0.05 | 0.00 | Not estimated |
| u01 | 0.12 | 0.01 | 77.33*** |
Note. Outcome variable is Vocalization–Silence average (VSDG). Dichotomous and continuous predictors were not centered.

Regarding therapy phases, controlling by the others variables in the model, only statistically significant differences were observed when comparing the medial and final phases. The mean of the vocalization–silence in the final phase is 0.12 points higher than the average of it in the middle one, t (6)=3.59, p=.02 (MMiddle=0.81 and Mfinal=0.93).
DiscussionThe application of the VSDP to real acoustic signals, taken from relevant episodes identified in a psychotherapeutic process, shows its usefulness for studying patient–therapist vocal coordination as a non-verbal dimension of the psychotherapeutic interaction.
Regarding the VSDP studied in patient–therapist dyad throughout a sample of change and stuck episodes, it was possible to observe a general configuration of vocalization–silences patterns of coordination in the whole therapeutic process, mostly based on some difference between the phases of the therapy and between change and stuck episodes. The final and medial phase of the therapy showed differences in their degree of regularity or coordination, showing less regularity (more point dispersion) at the final phase of the therapy. These results allowed us – in part – to hypothesize the presence of a configuration of vocalization–silence pattern of coordination of therapeutic dialog shaped like an inverse U-shaped trajectory of the therapeutic process, that has been described in other studies on the evolution of therapeutic interaction throughout the treatment (e.g. Tomicic et al., 2014). It has been proposed that it may reflect a part of the therapeutic process during which tension between the participants seems to increase due to therapeutic work (Krause & Martínez, 2011). In the case of the results of this study, this increased tension may be reflected by a greater extend of coordination. That is to say more regularity and coordination in terms of vocalization–silence patterns observed since the middle phase of this therapy. The phenomenon of the coordination degrees has been analyzed from the viewpoint of the mutual regulation dyadic interactions. McGarva and Warner (2003) point out that nonverbal interaction (e.g. voice intensity, length and frequency of pauses, response latency) tending toward convergence between speakers reflect the desire among them to increase their integration and identification. Meanwhile, the trend toward nonverbal divergence explains the intention toward differentiation or termination of the relationship. In this direction, Warner (1988) found a quadratic relationship between the levels of vocal rhythm coordination and positive affect in the interaction, such that moderate levels of coordination were assessed as optimal by the participants, whereas insufficient or excessive levels were evaluated in a less satisfactory. Other authors (Jaffe et al., 2001), in the context of research on mother–infant interactions have found an association between high levels of coordination and disorganization, disgust and surprise in the interactions. Therefore, according to the results of this study, it is possible to hypothesize that the difference between the levels of coordination between the medial and the final phase may be due to in the first case participants experiment greater tension and need for integration in the relationship, while in the second case, and before the finalization process of psychotherapy, participants show a greater tendency toward differentiation.
With respect to the way in which these coordination patterns appear along the episodes, it was observed that to the extent that goes by the stuck episode increases the average of vocalization, while to the extent that goes by the change episode it is higher the average of silence. In this regard, a preliminary interpretation of this difference could be that vocalization in stagnation processes can be associated with other-orientation in order to get out of or resolve the impasse by talking about. While the silence in the processes of change can be associated with a self-absorbed, inward processing or questioning and personal elaboration of new meanings (see Levitt, 2001; Nagaoka et al., 2013; Daniel, Folke, Lunn & Poulsen, 2015).
Considering that the results discussed above are an illustration of the application of VSDP system, their main limitation is that they could hardly be generalized as findings for psychotherapy in general. Since it is a single-case analysis, several questions arise about possible differences in the general and specific configurations of the vocalization–silence coordination patterns observable when comparing psychotherapeutic processes of different modalities and theoretical approaches, dyads of the same or different sexes, or even patients with different diagnoses. For this reason, the findings presented must be carefully interpreted when weighing their external validity.
Nevertheless, the scope of this paper was the description of a method that makes it possible to account of vocalization–silence coordination, and, specifically, with the possibility of understanding their characteristics and their evolution throughout a psychotherapeutic process. In this regard, and with respect to the system's requisites, possibilities, and technical limitations, it must be highlighted that the recordings, were not originally intended for the study of this subject. This implies a series of technical limitations, for example, these were one-track recordings with no ambient noise control, and in consequence, a human being must monitor the results of the data processing of the VSPD system. This means that, the VSPD is a semiautomatic system that is capable of producing a description of an important non-verbal dimension of dyadic conversational interactions in naturalistic conditions.
Author noteThis manuscript has been developed with support of National Council for Science and Technology of Chilean Government (Projects Fondecyt No. 1110361 and Fondecyt Postdoctorado No. 3150029) and by the Fund for Innovation and Competitiveness (FIC) of the Chilean Ministry of Economy, Development and Tourism, through the Millennium Scientific Initiative, Grant No. IS130005.
Special thanks to Dr. Paulo Barraza who initially contributed to the development of system Vocalization–Silence Dynamic Patterns.
Because this procedure involves the manual selection by the researcher of the signal segments in which is heard only the noise to set as the reference frequency to subtract it to the full signal, the success rate of the procedure depends on the selection of the segment will not include the sound corresponding to the speech of participants.
These calculate can be performed using MatLab software and the available standard scripts. Also, we have developed a specific MatLab script for the automatic calculation of the parameters depicted and the automatic creation of VS-Scattergrams and VS-Dynamic Graphs.
It was established a solution of 2 clusters. In the second cluster were pooled 5 cases (1%), including the outliers of the dimension vocalization (5 cases, 1%). This second cluster was eliminated from the analysis. To select the initial cluster centers, a single pass of the data is made. The values of the first of clusters cases with no missing values are assigned as cluster centers, then the remaining cases are processed as follows: (a) If the distance between vector of Kth observation and its closest cluster mean (Mi) is greater than the distance between the two closest means (Mm and Mn), then Kth observation replaces either of the centroids (Mm or Mn), whichever is closer to Kth observation. (b) If Kth observation does not replace a cluster mean in (a), this test is made: If Kth observation is further from the second closest cluster's center than the closest cluster's center is from any other cluster's center, replace the closest cluster's center with Kth observation. At the end of one pass through the data, the initial means of all clusters requested are set (IBM, 2011).