The aim of this study is to analyze the dimensionality of the Spanish version of the Revised Life Orientation Test (LOT-R), to examine the relationship between psychological well-being and dispositional optimism/pessimism in a sample of college students (n=291), as well as to consider the effect of dispositional optimism/pessimism on academic progress. The results indicated that the properties of the Spanish version of the LOT-R (α=.72) were very similar to the original. The questionnaire clearly presented two partially independent factors, and the items assessing optimism demonstrated greater discriminant validity than the items assessing pessimism. Optimism was positively linked to psychological well-being and negatively related to psychological-distress. In the male students, a certain degree of preoccupation about academic results was linked to progress in studies, while excessive worry about academic progress could obstruct the successful completion of studies in the female students. These results suggest that the LOT-R can be used as a reliable and valid tool for the analysis of optimism and its positive effects on health and academic progress.
Este estudio pretende analizar la dimensionalidad de la versión española del Revised Life Orientation Test, para examinar la relación entre el bienestar psicológico y el optimismo/pesimismo disposicional en una muestra de estudiantes universitarios (n=291) y analizar la repercusión del optimismo/pesimismo disposicional en el progreso académico. Los resultados indican que las propiedades de la versión española del Revised Life Orientation Test (α=0.72) son muy similares a los de la versión original. El test presenta una estructura clara con dos factores parcialmente independientes, los ítems del factor optimismo tienen un poder discriminatorio mayor que los del factor de pesimismo. El optimismo está relacionado positivamente con el bienestar psicológico y negativamente con el malestar psicológico. En hombres, cierto grado de preocupación por los resultados académicos estaría relacionado con el progreso académico en los estudios, mientras que en mujeres, una excesiva preocupación académica podría ser perjudicial para finalizar con éxito los estudios. Estos resultados sugieren que el Revised Life Orientation Test puede ser un instrumento fiable y válido para analizar el optimismo y su relación con la salud y progreso académico.
In recent years, educational psychologists have become increasingly interested in the theoretical conceptualization of such terms as optimism, well-being or positive thinking and in the use of these as constructs to predict college students’ academic performance (Chemers, Hu, & Garcia, 2001; Haugen, Ommundsen, & Lund, 2004). There has been particular interest in the notion of dispositional optimism, which refers to the students’ belief that the future holds more successes than failures (Scheier, Carver, & Bridges, 2001; Throndsen, 2010), and their expectation that they can control the results of their actions and achieve positive future outcomes. Dispositional optimism also involves a component of self-efficacy (Gillham, Shatte, Reivich, & Seligman, 2001).
Dispositional optimism has been closely linked to positive affectivity, well-being and self-confidence (Marshall, Wortman, Kusulas, Hervig, & Vickers, 1992), while pessimism has been linked to the presence of negative affectivity, physical symptoms (Chang, 1998) and to pessimistic attributions of both negative and positive accounts in undergraduate students (Ahrens & Haaga, 1993) and at advanced teacher students (Haugen & Lund, 2002). Many studies also indicate that optimism has a significant effect on performance and adjustment, both directly on academic performance and indirectly through expectations and coping perceptions on classroom performance, overall satisfaction and commitment to remain in university (Chemers et al., 2001). Optimistic strategy is related to better processing of ideas in databases than pessimistic strategy (Koivusaari, 2006).
This study uses the Life Orientation Test (LOT, Scheier & Carver, 1985), developed by Scheier and Carver and revised in 1994 as the Revised Life Orientation Test – LOT-R (Scheier, Carver, & Bridges, 1994). These authors use the model of the self-regulation of behavior to conceptualize optimism and they suggest that when difficulties arise, favorable expectations increase people's efforts to attain their objectives, while unfavorable expectations reduce these efforts. In this model, optimism and pessimism are considered as generalized outcome expectancies about the things that happen to a person during their life (Scheier & Carver, 1985). Since its beginnings, the evidence has demonstrated the LOT's psychometric properties and the questionnaire is currently one of the most widely used instruments for assessing dispositional optimism.
In line with the theory proposed by Scheier and Carver, the optimism–pessimism construct is unidimensional and bipolar, i.e. a single trait with two poles. However, practically all factor analyses of the LOT-R (including Scheier & Carver, 1985) obtain two factors with one formed by items assessing optimism and the other formed by items assessing pessimism (Robinson-Whelen, Kim, MacCallum, & Kiecolt-Glaser, 1997). This could be due to two reasons: (a) the item format produces a bias (the wording of items assessing optimism is positive while the wording of items assessing pessimism is negative); or (b) the scale measures two partially independent constructs. This is relevant for the significant link between the scale and variables like depression (Haugen & Lund, 2002), self-regulation and/or psychological well-being (Haugen et al., 2004), social support (Hatchett & Park, 2004) and performance and academic adjustment (Chemers et al., 2001).
Gender-specific difference is a central and also controversial subject in research on psychology and is studied in a variety of areas, from cognitive style and prosocial behavior to psychological well-being and optimism (Chrisler & McCreary, 2010; Fine, 2010). In a sample of young university students from Santiago of Chile, they did not find significant differences between men and women in dispositional optimism (Vera-Villarroel, Córdova-Rubio, & Celis-Atenas, 2009). Women generally score higher in the dimensions Positive relationships with others, Purpose in life, and Autonomy (Ryff, Keyes, & Hughes, 2003), and also adjust better than men to academic environments (Boman & Yates, 2001). On the other hand, men score higher in Self-acceptance and Self-confidence (Visani, Albieri, Offidani, Ottolini, Tomba, & Ruini 2011). Optimism was negatively related to anxiety, stress and depression (Brydon, Walker, Wawrzyniak, Chart, & Steptoc, 2009; Vera-Villarroel, Zych, Celis-Atenas, Córdova-Rubio, & Buela-Casal, 2011), while it has a positive interaction in the opposite direction with factors such as life satisfaction and self-esteem (Caprara et al., 2009) and psychological wellbeing (Lyubomirsky, 2008). The dispositional optimism has been researched widely in different cultures, proving its utility as a related variable and as a predictor of important psychological variables and states of health (Pavez, Mena, & Vera-Villarroel, 2012). Another area of study that requires further attention is gender-specific differences in dispositional optimism/pessimism in college students’ academic progress.
This study aimed to analyze the dimensionality of the Revised Life Orientation Test (LOT-R), the predictive capacity of psychological well-being in college students and the influence of the optimism–pessimism construct in academic progress. First, the descriptive data of the LOT-R were analyzed and the dimensionality of this tool was reviewed in the reference group. Secondly, the relationship between psychological well-being and dispositional optimism/pessimism was analyzed using two scales: (a) the Brief Symptom Inventory-18 (BSI-18), we expected to see a negative relation with optimism and a positive relation with pessimism; and (b) Ryff's Psychological Well-Being (PWB) Scales, and we expected to see a positive relation with optimism and a negative relation with pessimism. Third, to consider the effect of dispositional optimism/pessimism on academic progress. We expected the pessimism to explain part of the variance in student staying power in the completion of studies.
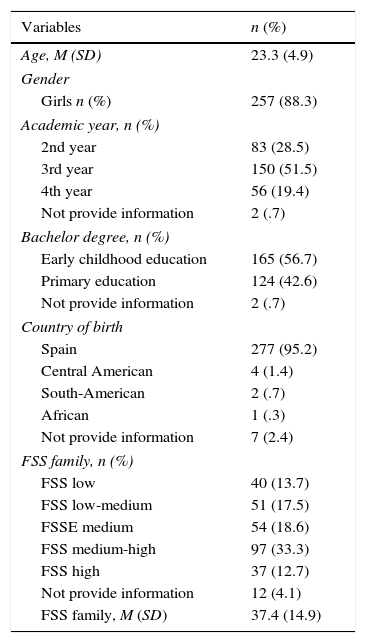
MethodParticipantsParticipants were 357 undergraduate college students at a Spanish university. These students were enrolled in a bachelor's degree course in early childhood education, or in primary education. Students were approached in their classroom. Two hundred ninety-one students (81.5%) completed questionnaires. The mean age of the university sample was 23 years (SD=4.9, range 18–43 yrs.). There were 88.3% women and 11.7% men in the sample. The percentage of women studying early childhood education or primary education is 87.5% at the University of Barcelona; there are no significant differences with our sample (t=1.455 and p=.147). With regard to the grade, there were 56.7% (n=165) students of Early Childhood Education and 42.6% (n=124) were students of Primary Education, the 0.7% (n=2) did not provide their Bachelor's degree. The large majority was born in Spain (95.2%), 1.4% being Central American, South-American (0.7%), and African (0.3%); 2.4% of the respondents did not provide their country of birth (see Table 1).
Descriptive Statistics of Relevant Variables (n=291).
| Variables | n (%) |
|---|---|
| Age, M (SD) | 23.3 (4.9) |
| Gender | |
| Girls n (%) | 257 (88.3) |
| Academic year, n (%) | |
| 2nd year | 83 (28.5) |
| 3rd year | 150 (51.5) |
| 4th year | 56 (19.4) |
| Not provide information | 2 (.7) |
| Bachelor degree, n (%) | |
| Early childhood education | 165 (56.7) |
| Primary education | 124 (42.6) |
| Not provide information | 2 (.7) |
| Country of birth | |
| Spain | 277 (95.2) |
| Central American | 4 (1.4) |
| South-American | 2 (.7) |
| African | 1 (.3) |
| Not provide information | 7 (2.4) |
| FSS family, n (%) | |
| FSS low | 40 (13.7) |
| FSS low-medium | 51 (17.5) |
| FSSE medium | 54 (18.6) |
| FSS medium-high | 97 (33.3) |
| FSS high | 37 (12.7) |
| Not provide information | 12 (4.1) |
| FSS family, M (SD) | 37.4 (14.9) |
Based on Hollingshead four factor index (Hollingshead, 1975), the participants’ families corresponded to the following categories: 13.7% low Familiar Socioeconomic-Status (FSS), 17.5% FSS low-medium, 18.6% FSS medium, 33.3% FSS medium-high, 12.7% FSS high, and the 4.1% did not provide information.
MeasuresThe following questionnaires were administered:
The socio-demographic data sheet. It provided information about several characteristics of the group: age, gender, year of study, degree being studied, country of birth, and parental educational level and occupational field. These last two factors were introduced in the Hollingshead Occupational Scale (Hollingshead, 1975) to obtain family socioeconomic status. The students specified their high school grade-point average and the number of academic credits they had successfully completed. This last variable was considered as an indicator of academic progress.
The Revised Life Orientation Test – LOT-R (Scheier et al., 1994) in its Spanish version (Otero, Luengo, Romero, Gómez-Fraguela, & Castro, 1998). The LOT-R consists of Optimism and Pessimism scales, with 10 items (three items assess optimism, three assess pessimism, and four of them are fillers). The respondents indicated the extent to which they agreed with each item on a 5-point Likert scale that ranged from strongly agree to strongly disagree. The internal consistency (Cronbach's alpha) ranged between .74 and .78 (Schou, Ekeberg, Ruland, Sandwik, & Karesen, 2004).
Brief Symptom Inventory. The BSI-18 (Derogatis, 2001) was used to measure participants’ psychological distress (PD). This inventory includes 18 symptoms to assess the degree of distress on a Likert-type five-point scale ranging from 1 (total absence of symptom) to 5 (full presence of symptom). The scale provides three groups of symptoms: somatization disorder, depression, and anxiety. A global severity index (GSI) and a positive symptom distress index (PSDI) were calculated. The test-retest reliability ranged from .78 to .90. Cronbach's alpha ranged from .81 to .90 (Derogatis, 2001). In the present research, Cronbach's alpha for BSI-18 were: somatization (α=.663), depression (α=.821) and anxiety (α=.736).
Ryff Scales of Psychological Well-Being. The scale PWB (Ryff, 1989) is a self-report scale designed to measure psychological well-being. The instrument consists of six subscales: Self-acceptance, Positive-relationships with others, Personal-growth, Purpose in life, Autonomy, and Environmental-mastery. Each subscale consists of 14 items divided approximately equally between positive and negative items. The self-acceptance dimension assesses positive attitudes held toward the self. The positive-relationships with others dimension assesses the ability to love, trust, and establish deep relationships with others. The personal growth dimension measures one's needs to actualize and realize one's potentials. The purpose in life item seeks to measure one's sense of directedness and goals. Autonomy assesses self-determination, independence, and an internal locus of control. Finally, the environmental mastery measures one's ability to manipulate and control complex environments. Participants respond on a 6-point Likert scale that ranges from strongly disagree (1) to strongly agree (6). Certain items are reverse coded. The total score is the sum of the 84 items. Ryff and Keyes (1995) reported the following internal consistency reliability coefficients ranged from .81 to .85. In the present research, Cronbach's alpha for PWB were: self-acceptance (α=.848), positive-relationships (α=.809), personal-growth (α=.778), purpose in life (α=.846), autonomy (α=.751), and environmental-mastery (α=.731).
ProceduresThis study was approved by Ethics Committee of the University of Barcelona (Spain) and was conducted in line with the guidelines of the National Commission for the Protection of Human Subjects of Biomedical and Behavioral Research (1978). Subsequent to a full explanation of the study procedures to students in their classrooms, students were invited to participate. A consent form to be signed by students was requested the day of the data collection. The participation of study was voluntary and anonymous. Students that declined to participate did not differ in age, socioeconomic status, or grade level from those who did participate.
The questionnaires were applied collectively in groups of 15–30 students over an 1-hour session in their classrooms. Students were informed that there were no good or bad answers, and that the answer should be chosen according to their own experiences. Special attention was paid in order to ensure privacy and confidentiality of the data, and to avoid random answers. Two members of the research team were present in the classroom to clarify doubts and help if necessary.
Data analysesDescriptive analyses were conducted for each of the LOT-R items and their discriminatory power was calculated by item-total correlation which measures the relationship between a given item and the rest of the scale. For empirical evidence of the internal structure of the scale an exploratory factor analysis was conducted using the principal axis technique and Oblimin rotation. The Kaiser–Meyer–Olkin (KMO) measure of sampling adequacy was used to test whether the application was relevant to factor analysis. Two factorial solutions were confirmed: unidimensionality and bifactoriality. The loadings of the items to the factors were established at .30. The two-factor solution was accepted. Reliability analysis was conducted based on the analysis of internal consistency by calculating Cronbach's alpha. The minimum acceptable value for Cronbach's alpha coefficient is .60 and the expected maximum value is .90. No redundancy or duplication of items are thought to occur above this value. Criterion validity was examined using non-parametric Kendall's tau correlations between LOT-R and BSI (both total and scales scores) and PWB scales. Two analyses of linear regression were conducted to study the link between optimism and academic progress both in men and women. Control variables were age, socioeconomic status and the grade-point average in the student's academic transcript. The study used a stepwise selection method and Version 16.0 of the Statistical Package for the Social Sciences (SPSS) for the statistical analysis. For all the tests carried out, bilateral statistical significance was set at p equal to or less than .05.
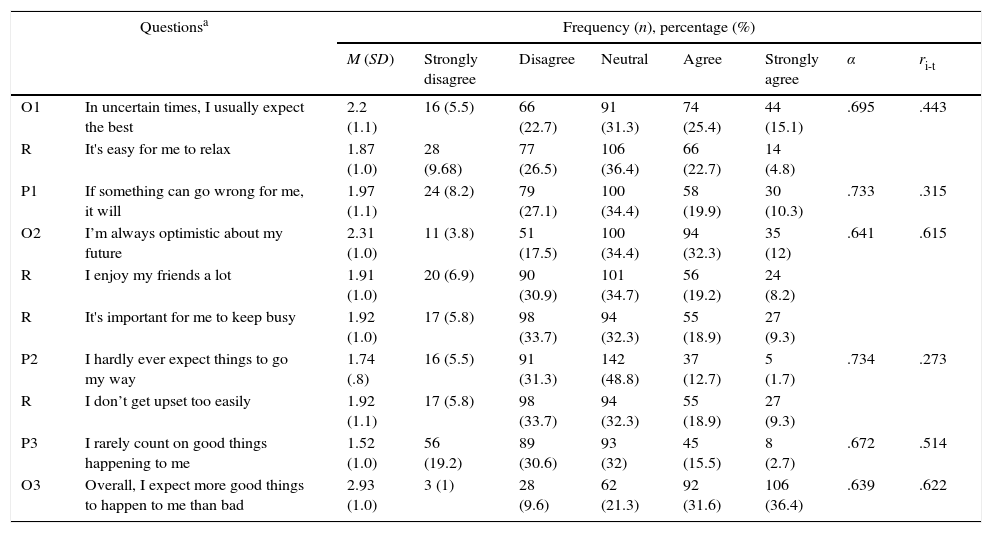
ResultsDescriptive data of the LOT-RTable 2 describes the means, standard deviations and response frequencies for the items in the LOT-R, as well as the item-total correlation and the estimation of the questionnaire's internal consistency. The absolute value of most of the correlations between the six items and the four filler items were found to be below .20. These results suggest that the filler items really operated as such, and these items were therefore not considered in subsequent analyses. The mean score for all the scale was 14.23 (SD=4.0, 2–23) excluding the filler items. The mean for the items assessing optimism was 7.46 (SD=2.6) and the mean for the items assessing pessimism was 5.22 (SD=2.1). The inter-item correlations matrix was analyzed using exploratory factor analysis. The estimation of internal consistency with Cronbach's alpha for LOT-R was .724.
Mean, standard deviation, frequencies in 291 students, analysis of the Cronbach's alpha on standardized items, and item-total correlation of LOT-R.
| Questionsa | Frequency (n), percentage (%) | ||||||||
|---|---|---|---|---|---|---|---|---|---|
| M (SD) | Strongly disagree | Disagree | Neutral | Agree | Strongly agree | α | ri-t | ||
| O1 | In uncertain times, I usually expect the best | 2.2 (1.1) | 16 (5.5) | 66 (22.7) | 91 (31.3) | 74 (25.4) | 44 (15.1) | .695 | .443 |
| R | It's easy for me to relax | 1.87 (1.0) | 28 (9.68) | 77 (26.5) | 106 (36.4) | 66 (22.7) | 14 (4.8) | ||
| P1 | If something can go wrong for me, it will | 1.97 (1.1) | 24 (8.2) | 79 (27.1) | 100 (34.4) | 58 (19.9) | 30 (10.3) | .733 | .315 |
| O2 | I’m always optimistic about my future | 2.31 (1.0) | 11 (3.8) | 51 (17.5) | 100 (34.4) | 94 (32.3) | 35 (12) | .641 | .615 |
| R | I enjoy my friends a lot | 1.91 (1.0) | 20 (6.9) | 90 (30.9) | 101 (34.7) | 56 (19.2) | 24 (8.2) | ||
| R | It's important for me to keep busy | 1.92 (1.0) | 17 (5.8) | 98 (33.7) | 94 (32.3) | 55 (18.9) | 27 (9.3) | ||
| P2 | I hardly ever expect things to go my way | 1.74 (.8) | 16 (5.5) | 91 (31.3) | 142 (48.8) | 37 (12.7) | 5 (1.7) | .734 | .273 |
| R | I don’t get upset too easily | 1.92 (1.1) | 17 (5.8) | 98 (33.7) | 94 (32.3) | 55 (18.9) | 27 (9.3) | ||
| P3 | I rarely count on good things happening to me | 1.52 (1.0) | 56 (19.2) | 89 (30.6) | 93 (32) | 45 (15.5) | 8 (2.7) | .672 | .514 |
| O3 | Overall, I expect more good things to happen to me than bad | 2.93 (1.0) | 3 (1) | 28 (9.6) | 62 (21.3) | 92 (31.6) | 106 (36.4) | .639 | .622 |
Note. M: mean; SD: standard deviation. α=Cronbach's alpha if item deleted; ri-t=corrected item-total correlation.
Score range from 0 (strongly-disagree) to 4 (strongly-agree). Sum items 1, 3, 4, 7, 9 and 10 to obtain an overall score. Reverse code items 3, 7 and 9 prior to scoring (0=4) (1=3) (2=2) (3=1) (4=0).
O1, O2, and O3 are optimistic items. P1, p2, and p3 are pessimistic items. ‘R’ are filler items.
Cronbach's alpha based on standardized items for LOT-R was .724.
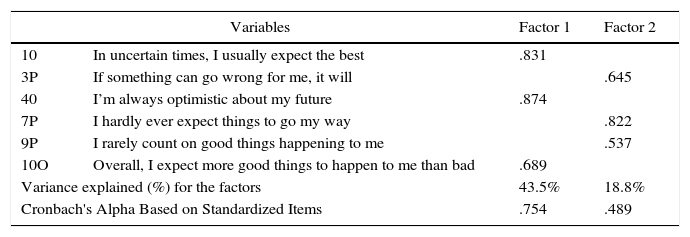
To analyze the test's factorial structure in the target population we used the maximum likelihood method with direct Oblimin rotation. The Kaiser–Meyer–Olkin (KMO)=.752 and Bartlett's Test of Sphericity (χ2=393.372, p<.001) indicate the goodness-of-fit of the correlations matrix required for this analysis. The results of the factoring by PCA and Oblimin rotation are described in Table 3.
Exploratory analysis of LOT-R with the values of the two factors (Oblimin rotation) and percentage of the variance explained by each factor and a sampling adequacy index (KMO).
| Variables | Factor 1 | Factor 2 | |
|---|---|---|---|
| 10 | In uncertain times, I usually expect the best | .831 | |
| 3P | If something can go wrong for me, it will | .645 | |
| 40 | I’m always optimistic about my future | .874 | |
| 7P | I hardly ever expect things to go my way | .822 | |
| 9P | I rarely count on good things happening to me | .537 | |
| 10O | Overall, I expect more good things to happen to me than bad | .689 | |
| Variance explained (%) for the factors | 43.5% | 18.8% | |
| Cronbach's Alpha Based on Standardized Items | .754 | .489 | |
Note. Extraction method: principal component analysis.
Rotation method: Oblimin with Kaiser normalization.
KMO (Kaiser–Meyer–Olkin measure of sampling adequacy)=.752.
Bartlett's Test of Sphericity (χ2)=393.372, p=.0001.
The factorial structure shows a bidimensional solution which explains 62.3% of the variance. The first factor, which explains 43.5% of the variance, gathers the items assessing optimism, with factor loadings between .689 and .874, and reaches α=.75.
The second dimension explains 18.8%, and gathers the items assessing pessimism, with saturations between .645 and .822, and α=.49. The correlation between the dimensions was highly significant (r=.46, p<.001).
Given the low number of items comprising each factor, reliability would be substantially increased if the number of items was doubled (Spearman–Brown prediction formula: α=.86 for Factor 1, and α=66 for Factor 2).
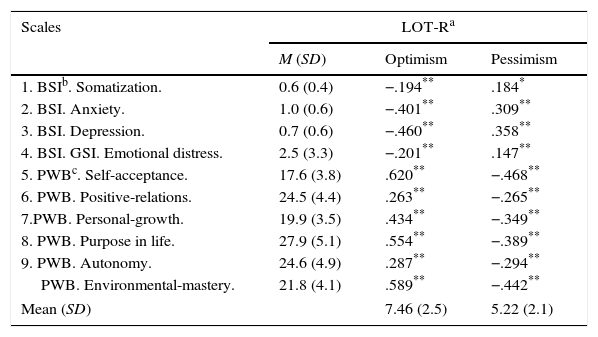
Reliability analysisTable 4 describes the Kendall's tau correlations between the dimensions of the LOT-R and the global score of the scale with regard to the Brief Symptom Inventory (BSI) and the Psychological Well-Being (PWB) Scales. If we take into consideration two factors, optimism correlates negatively with the BSI, especially in Depression (r=−.460, p<.001) and Anxiety (r=−.401, p<.001) and correlates positively with the PWB Scales, especially in Self-acceptance (r=.620, p<.001), Environmental-mastery, (r=.589, p<.001), Purpose in life (r=.554, p<.001) and Personal-growth (r=.434, p<.001).
Kendall's Tau correlations between scores of LOT-R and BSI (scales and total) and PWB (scales).
| Scales | LOT-Ra | ||
|---|---|---|---|
| M (SD) | Optimism | Pessimism | |
| 1. BSIb. Somatization. | 0.6 (0.4) | −.194** | .184* |
| 2. BSI. Anxiety. | 1.0 (0.6) | −.401** | .309** |
| 3. BSI. Depression. | 0.7 (0.6) | −.460** | .358** |
| 4. BSI. GSI. Emotional distress. | 2.5 (3.3) | −.201** | .147** |
| 5. PWBc. Self-acceptance. | 17.6 (3.8) | .620** | −.468** |
| 6. PWB. Positive-relations. | 24.5 (4.4) | .263** | −.265** |
| 7.PWB. Personal-growth. | 19.9 (3.5) | .434** | −.349** |
| 8. PWB. Purpose in life. | 27.9 (5.1) | .554** | −.389** |
| 9. PWB. Autonomy. | 24.6 (4.9) | .287** | −.294** |
| PWB. Environmental-mastery. | 21.8 (4.1) | .589** | −.442** |
| Mean (SD) | 7.46 (2.5) | 5.22 (2.1) | |
M: mean; SD: standard deviation.
The pessimism factor (LOT-R) correlates positively with the BSI, especially in Depression (r=.358, p<.001) and Anxiety (r=.309, p<.001) and correlates negatively with the PWB Scales, especially in Self-acceptance (r=−.468, p<.001), Environmental-mastery (r=−.442, p<.001), and Purpose in life (r=−.389, p<.001).
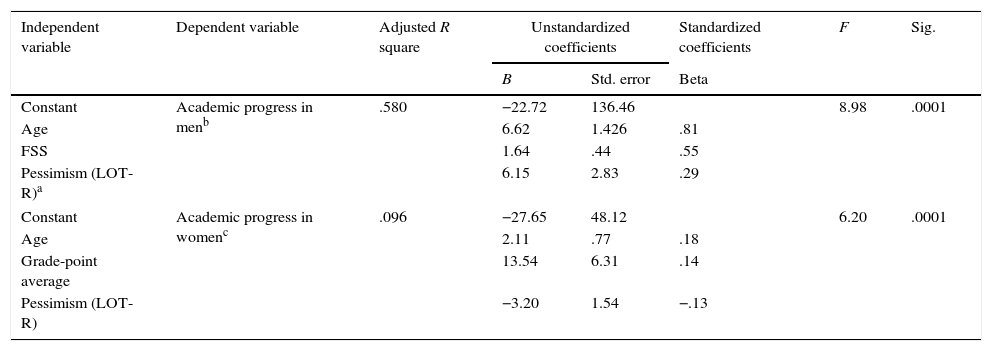
Effect of dispositional optimism/pessimism on academic progressWe were interested in studying the link between dispositional optimism/pessimism and academic progress in both men and women. Three control variables were considered in the analyses of linear regression: age, socioeconomic status and the grade point average in the student's academic transcript. Two linear regression models were carried out – one for each gender. The average age of the men was 25.1 (SD=5.9) and the average age of the women was 23.1 (SD=4.7) and there were no differences between the two groups (t=1.895, p=.065). Average socioeconomic status in men was 42.5 (SD=16.3) while in the women this was 36.8 (SD=14.6), with differences between the two groups (t=2.063, p=.040). The grade-point average in the male students’ academic transcripts was 7.5 (SD=.4) while in the women's this was 7.6 (SD=.5) and there were no differences between the two groups (t=−1.409, p=.160).
The mean score for optimism (LOT-R) was 8.0 (SD=2.1) in men and 7.3 (SD=2.6) in women and there were no statistically significant differences between the two groups (t=1.435, p=.152). The mean score for pessimism (LOT-R) was 4.9 (SD=2.2) in men and 5.2 (SD=2.1) and there were no statistically significant differences in women between the two groups (t=1.417, p=.158). Academic progress was determined by calculating the average number of credits successfully completed by the students, and in the men this was 142.1 (SD=48.1) while in the women it was 122.3 (SD=51.3), with no differences between the two groups (t=2.121, p=.035).
In the men, the results of the linear regression indicated that age, socioeconomic status and the pessimism scores (LOT-R) explained 58% of the variance of the successfully completed credits (F=8.987, p<.0001). In the women, 9.6% of the variance of the successfully completed credits could be explained by age, the grade-point average and the LOT-R scores (F=6.206, p<.001), see Table 5.
Two models of regression models to study the link between optimism–pessimism and academic progress based on gender.
| Independent variable | Dependent variable | Adjusted R square | Unstandardized coefficients | Standardized coefficients | F | Sig. | |
|---|---|---|---|---|---|---|---|
| B | Std. error | Beta | |||||
| Constant | Academic progress in menb | .580 | −22.72 | 136.46 | 8.98 | .0001 | |
| Age | 6.62 | 1.426 | .81 | ||||
| FSS | 1.64 | .44 | .55 | ||||
| Pessimism (LOT-R)a | 6.15 | 2.83 | .29 | ||||
| Constant | Academic progress in womenc | .096 | −27.65 | 48.12 | 6.20 | .0001 | |
| Age | 2.11 | .77 | .18 | ||||
| Grade-point average | 13.54 | 6.31 | .14 | ||||
| Pessimism (LOT-R) | −3.20 | 1.54 | −.13 | ||||
Note. Control variables: age, familiar Socioeconomic-Status and grade-point average in the student's academic transcript.
The results of this study suggest that the Spanish version of the LOT-R applied to students of teaching has acceptable psychometric properties. The global internal consistency is moderate (α=.72) and matches the results obtained in the original test (Scheier et al., 1994) and those obtained by Schou et al. (2004).
The test has a clear structure with two related factors; optimism and pessimism, which together explain 62.3% of the variance. The factors found show adequate psychometric properties for optimism (α=.75) and moderate properties for pessimism (α=.49) if we bear in mind the length of the instrument. Reliability of the scale would substantially increase by doubling the number of items (from six to twelve items: optimism [α=.86]; pessimism [α=.66]). The emergence of the two factors could be explained by the wording of the items (the wording of items assessing optimism is positive while the wording of items assessing pessimism is negative), without affecting the questionnaire's underlying construct (McPherson & Mohr, 2005). The bidimensional model found matches the proposal made by various studies (Herzberg, Glaesmer, & Hoyer, 2006; Schou et al., 2004; Vera-Villarroel et al., 2009) indicating that the LOT-R is a measure with two separate constructs (optimism and pessimism) and that these two constructs should be considered separately. This is at odds with the results of the validation made with college students in Brazil, which found a single dimension explaining 39.78% of the variance (Bandeir et al., 2002).
The reliability coefficients are moderately high with regard to the Brief Symptom Inventory (BSI) and the Psychological Well-Being (PWB) Scales. As expected, the factor of optimism related positively with the PWB Scales (especially in self-acceptance, environmental-mastery, and purpose in life) and negatively with the BSI (especially in depression and anxiety), while the factor pessimism related negatively with the PWB Scales (especially in self-acceptance and environmental-mastery) and positively with the BSI (especially in depression and anxiety). These results agree with a number of studies that show that depressive symptoms (Mosher, Prelow, Chen, & Yackel, 2006; Vickers & Vogeltanz, 2000), somatization (Scheier & Carver, 1985) and psychological distress (Chang, Rand, & Strunk, 2000; Creed, Patton, & Bartrum, 2002) relate negatively with optimism and positively with academic adjustment at university (Schaufeli & Salanova, 2007), la professional efficacy, work engagement (Caprara, Vecchione, Alessandri, Gerbino, & Barbarenelli, 2011; Mauno, Kinnunen, & Ruokolainen, 2007) and psychological well-being (Chico & Ferrando, 2008; Haugen et al., 2004; Kivimaki et al., 2005). One explanation may be that subjective well-being and optimism are closely linked. The assessment made by college students of their subjective well-being depends to some degree on an affective component (the presence of positive and negative emotions) and on a cognitive component (the belief that the future will be better than the present), the second of these being related to dispositional optimism.
Another interesting aspect is the relationship between optimism and academic progress on the basis of gender. Our results indicate that pessimism, age and socioeconomic status in male students explained more than half the variance of the successfully completed credits, i.e., older men with a more privileged socioeconomic status and a lower sense of self-efficacy had more staying power in their studies, while the same staying power in studies was related to age, the grade-point average in the student transcript and the respondent's sense of self-efficacy in female students. Note that these variables only explain one tenth of the staying power in studies, and that other variables intervene in the explanatory model in female students. Moreover, because of the lower number of men in the sample, the results for men should be considered with caution.
The results of our study explain the differences between men and women in academic progress, and it appears that excessive self-confidence in men is linked to less academic progress, while a certain degree of optimism is necessary in women for academic progress. The expectancy-value model of achievement performance and choice proposed by Eccles (2005) establishes the importance of confidence in self-efficacy, motivation and academic performance in the choice of educational and professional options based on gender over and above the capacities and abilities demonstrated. Some of the gender-specific differences could be explained in this model by the fact that women tend to cultivate more realistic expectations about their abilities while men over-estimate their abilities.
In light of the above, men's excessive self-confidence can lead to a lower level of academic performance, whereas the presence of greater self-confidence in women increases chances of success (Watt, 2005). The explanatory value that pessimism has in men in our study – in relation to the number of successfully completed credits suggests that men are more realistic and practical when addressing academic tasks.
To conclude, the evidence convincingly demonstrates the LOT-R questionnaire's psychometric properties and its potential as a reliable and valid instrument in studies addressing the importance of optimism in physical and psychological well-being. In men, a certain degree of preoccupation about academic results – together with age and socioeconomic status – is linked to progress in studies, while excessive worry about academic matters in women could obstruct their successful completion of studies. The assessment of optimism/pessimism would allow researchers to quickly and efficiently identify the expectations college students will require if they are to address academic challenges, and describe the particular effort they will need to do this successfully. It would also be particularly useful for institutions wishing to implement measures to minimize student drop-out.
Future lines of research might use broader male samples to corroborate the results of this study and introduce other variables in the explanatory model, such as coping strategies, the perception of control and dispositional optimism/pessimism.
The results of this study are qualified by certain limitations. First, because the group comprised mainly female college students from a single school, the results cannot be generalized to other groups, even though the results are consistent with previous studies that suggest that the LOT-R can provide a robust measurement of dispositional optimism/pessimism, the bifactorial structure of the scale and its relationship with psychological well-being or distress. Secondly, the results for men should be approached with caution given the lower number of men in the sample. Finally, self-reported data is limited by the fact that it can rarely be verified independently, in addition to the fact that it contains potential sources of bias, such as answers that may be exaggerated, selective memory, or a desirability bias.
This research was supported by Research in Social Sciences and Humanities Grants 2012 B200033268 University of Barcelona.