
This study aimed to present the validation process and the psychometric properties of the Brazilian version of the Meaning in Life Questionnaire (MLQ). Participants were a nationwide sample of 3020 subjects aged 18–91 years old, from 22 different Brazilian states. Exploratory factor analysis supported a two-factor solution (presence of meaning – MLQ-P; and search for meaning – MLQ-S). Adequate reliability indexes were achieved. Confirmatory factor analyses (CFA) provided evidence that the MLQ-P and MLQ-S scales present better goodness-of-fit indexes when evaluated separately. Multiple group CFA achieved full measurement and structural invariance for gender and age (youngsters, adults and the elderly) groups. Group comparisons were conducted for evaluating gender, age and marital status differences in both MLQ-P and MLQ-S scales. The results are presented and discussed based on the literature. Our results suggest that the MLQ is a reliable measurement to evaluate presence and search for meaning in life in the Brazilian population in a wide variety of age groups.
Este estudio tuvo como objetivo presentar los procedimientos de validación y las propiedades psicométricas de la versión brasileña del Cuestionario de Sentido de Vida (CSV). La recolección de los datos fue realizada a nivel nacional, y la muestra estuvo compuesta por 3020 sujetos con edades entre los 18 y los 91 años, provenientes de diferentes estados brasileños. Un análisis factorial exploratorio dio soporte a la solución de dos factores (presencia de sentido – CSV-P; y búsqueda por sentido – CSV-B) con adecuados índices de fiabilidad. El análisis factorial confirmatorio (AFC) demostró evidencias de que las escalas CSV-P y CSV-B presentan mejores índices de ajuste cuando son evaluadas por separado. Los AFCs multigrupo demostraron invariancia de medida e invariancia estructural completas para género y edad (jóvenes, adultos y ancianos). Fueron realizadas comparaciones entre grupos para evaluar las diferencias considerando género, edad y estado civil en las escalas (CSV-P y CSV-B). Los resultados son presentados y discutidos con base en la literatura. Nuestros resultados sugieren que el CSV es una medida fiable para evaluar la presencia y búsqueda de sentido de vida en la población brasileña y puede ser usada en una amplia variedad de grupos etarios.
Meaning in life (MIL) may be defined as the extent to which people comprehend and see significance in their lives, as well as the degree wherein they perceive themselves to have a purpose or overarching aim in life (Steger, 2009). Decades of research have provided empirical evidence that MIL plays an important role in the human positive functioning. For example, MIL is positively associated with psychological and subjective well being, and quality of life (Ho, Cheung, & Cheung, 2010), self-esteem (Schlegel, Hicks, King, & Arndt, 2011), hope (Mascaro & Rosen, 2005), optimism (Ho et al., 2010); self-efficacy (DeWitz, Woolsey, & Walsh, 2009), among others.
Regarding physical and mental health, studies have, for example provided evidence that MIL is an important component in the recovery of victims of serious illness, such as cord injury (Thompson, Coker, Krause, & Henry, 2003), and that it presented a mediational role between the relation of negative reminiscence with psychological distress (depression and anxiety) among older adults with mild to moderate depressive symptoms (Korte, Cappeliez, Bohlmeijer, & Westerhof, 2012).
To the same extent that the presence of MIL has being presented as an important indicator of human positive functioning, absence of meaning also has negative consequences. Lack of MIL is related to higher levels of neuroticism (Zika & Chamberlain, 1992), perceived stress (Bauer-Wu & Farran, 2005), negative affect (Debats, van der Lubbe, & Wezeman, 1993), depression (Mascaro & Rosen, 2005), suicidal ideation (Edwards & Holden, 2001), etc. Considering this evidence, MIL is currently recognized as a formative marker of human positive functioning (Steger & Shin, 2010).
Another aspect related to meaning in life is the ‘search for meaning’ construct. In the initial psychological literature regarding meaning in life, search for meaning was considered a daily need, originated from an intrinsic human motivation, called “will to meaning” (Frankl, 1963). According to Frankl (1963, 1978), the search for meaning should be a never-ceasing motivation. Every time an individual achieves their ambitions new life goals tend to arise, leaving one always future-oriented, searching for new achievements and new meanings for the existence. Although in recent years there has been a growing interest on MIL, the construct ‘search for meaning’ was almost overlooked in the literature (Steger, Kashdan, Sullivan, & Lorentz, 2008b).
Search for meaning has been studied primarily in the context of responses to negative stressful events (Skaggs & Barron, 2006), such as HIV contamination (Bloom, 2008); changes in the work context (Guevara & Ord, 1996); neoplastic diseases (Lee, 2008); familiar loses (Chan & Chan, 2011); marital problems (Farghadani, Navabinejad, & Shafiabady, 2010), among others. These studies have provided evidence that searching (and finding or believing in) a positive meaning to a stressful situation can booster the adaptation process, thus resulting in resilient responses.
Initially, search for meaning was understood as a positive construct, regardless of whether the subject was experiencing or not a risk situation (Frankl, 1978). However, other authors have suggested that search for meaning occurred only in people who have had their needs frustrated (Baumeister, 1991). To Baumeister (1991), people search for meaning when they do not perceive meaning in their lives or when they are going through stressful life events (e.g., death of spouse) that require new adjustment and re-elaboration of their existence through the pursuit of new “structures of meaning”. On the other hand, a third approach (Reker, 2000) suggests that both possibilities are plausible, so that the construct search for meaning would be anchored by both a life-affirming and deficit-based perspective (Reker, 2000).
In cases of people who are not facing negative situations, search for meaning has proved to be mostly negative. Search for meaning presented positive correlations with fear (r=.25, p<.005), shame (r=.19, p<.05), sadness (r=.26, p<.01), neuroticism (r=.20, p<.05) and depression (r=.36, p<.005) and negative correlations with psychological well-being (environmental mastery, r=−.23, p<.05; relatedness, r=−.28, p<.001; and self-acceptance, r=−.36, p<.001). However, when considering people with a high sense of meaning in life (high levels of presence of meaning), search for meaning proved to be a positive variable, presenting positive correlations with life satisfaction and happiness, and negative correlations with depression (r values not presented; Park, Park, & Peterson, 2010).
All these empirical evidence show how important MIL and search for meaning are, and how it is necessary to have reliable instruments to assess these constructs. The Meaning in Life Questionnaire (MLQ) was developed with the aim of adequately assessing the constructs presence of meaning and search for meaning. Throughout three studies, the authors presented the development, evaluation, refinement and psychometric properties of the MLQ (Steger, Frazier, Oishi, & Kaler, 2006). The final version of the MLQ is composed of ten items, five tapping out the construct presence of meaning, and five the construct search for meaning. This 10-item version achieved acceptable fit and reliability indexes, through three independent samples (for detailed information, see Steger et al., 2006). Rather than the factor adequacy of the scale, the MLQ also presented adequate convergent and discriminant validity. In the validation study, the MLQ correlated as expected with a number of well-being, personality, and religiosity variables, and presented better discriminant validity than the PIL-Test and the LRI (for more information, see Steger et al., 2006).
The MLQ offers several improvements over current meaning in life measures, which includes no item overlap with related measures, a stable factor structure, better discriminant validity, a briefer format, and the possibility to measure the search for meaning in the same questionnaire (Steger et al., 2006). Up to now, the instrument has been validated and used in several other cultures, such as: Argentina (Góngora & Solano, 2011); China (Liu & Gan, 2010); Japan (Steger, Kawabata, Shimai, & Otake, 2008c); Spain (Steger, Frazier, & Zacchanini, 2008a). The psychometric properties of the MLQ in these studies are very similar. Exploratory factor analysis presents a two-factor solution as the most reliable to the data. Goodness-of-fit indexes present adequate fit, although RMSEA tend sometimes to be high (Góngora & Solano, 2011; Steger et al., 2006).
Current studyThe objective of this study is twofold: (1) To present the psychometric properties of the Brazilian version of the Meaning in Life Questionnaire (MLQ-Brazil), using robust analytical methods in a large nationwide Brazilian sample; and (2) to evaluate the levels of MIL in Brazil regarding some sociodemographic variables.
MethodTranslation and adaptation processes of the MLQThe translation and adaptation process of the original MLQ to the Brazilian-Portuguese included several steps, based on the International Test Commission guidelines (ITC, 2011) and on Borsa, Damásio, and Bandeira (2012). Initially, the questionnaire was translated from English to Portuguese by two independent translators who were instructed to emphasize the meaning and not literal expressions on the translations. With these two initial versions, the authors conducted a synthesis of the instrument. This synthesis was evaluated by a target-group (N=4) and by a group of three researchers, psychologists and experts in psychometric evaluation. After minor revisions of grammatical aspects, the adapted version was translated back from Portuguese to English by a third independent translator. The original and the back-translated version were evaluated by the authors and a group of researchers. By considering the versions both grammatically and semantically equivalent, the instrument was considered ready to use (Appendix A).
ParticipantsParticipants were 3020 subjects (63.9% women), aged 18–91 (M=33.92; SD=15.01), from 22 Brazilian states. From the total, 60% of the participants were single, 27.3% were married, 6.0% was divorced, 5.2% was in a steady relationship (dating, engaged, or living with a partner), and 1.5% was widowed. Invitations were sent through different sources, such as personal and media invitations, recruitment within social and occupational institutions (especially adults and the elderly), as well as the snowball technique (Patton, 1990). Inclusion criteria were: (1) being older than 18 and (2) being interested in participating in the study. 91.4% of the sample answered the questionnaires in a web-based platform, whereas the remaining 8.6% responded to the questionnaires in the paper-and-pencil form.
InstrumentsMeaning in Life Questionnaire (Steger et al., 2006). The MLQ is a 10-item instrument that encompasses two different constructs: Presence of meaning – MLQ-P (e.g., “My life has a clear sense of purpose”) and search for meaning – MLQ-S (e.g., “I am seeking a purpose or mission for my life”). Each construct is evaluated by five items. Scores range from 5 to 35, and higher scores represent higher levels of presence of meaning and search for meaning.
Subjective Happiness Scale (SHS, Lyubomirsky & Lepper, 1999, Brazilian version adapted byDamásio, Zanon, & Koller, 2014). It is a 4-item Likert-type scale (ranging from 1 to 7 points, with different anchors), which assesses subjective happiness by a single-factor solution. Scores range from 4 to 28. Higher scores represent higher levels of subjective well-being. In this study, the SHS presented excellent goodness-of-fit indexes: CFI=1.00; TLI=.99; RMSEA (90% CI)=.037 (.017–.061); SRMR=.042. Alpha reliability was .76.
Satisfaction with Life Scale (SWLS, Diener, Emmons, Larsen, & Griffin, 1985, Brazilian version adapted byGouveia, Milfont, Fonseca, & Coelho, 2009). It is a 5-item Likert-type scale (ranging from 1 – totally disagree to 5 – totally agree), which assess satisfaction with life by a single-factor solution. Scores range from 5 to 25. Higher scores represent higher levels of life satisfaction. In this study, the SWLS presented excellent goodness-of-fit indexes: CFI=1.00; TLI=.99; RMSEA (90% CI)=.034 (.021–.049); SRMR=.011. Alpha reliability was .86.
Life Orientation Test-Revised, LOT-R (Scheier, Carver, & Bridges, 1994, Brazilian version adapted byBastianello, Pacico, & Hutz, 2014). The LOT-R evaluates one's levels of optimism (e.g., “In uncertain times, I usually expect the Best”) and pessimism (e.g., “I rarely count on good things happening to me”). It is composed of ten items (4 fillers), answered in a five-point Likert scale (0=totally disagree; 4=totally agree). Each factor is composed of three items. Scores range from 0 to 12. Higher scores represent higher levels of optimism and pessimism. In this study, the expected bi-factorial solution presented excellent goodness-of-fit indexes: CFI=.98; TLI=.97; RMSEA (90% CI)=.068 (.057–.078); SRMR=.036. Alpha reliability for optimism and pessimism was .74 and .72, respectively.
Data analysisExploratory factor analysis. In order to identify the MLQ factor structure and its adequacy, the total sample was randomly split into two approximate halves. With the first half of the sample (n1=1503), an exploratory factor analysis (EFA), using the Minimum Rank Factor Analysis (MRFA) extraction method, with an oblique rotation (Promin), was conducted for both scales together (10 items). Factor retention criterion was the Hull Method (HM, Lorenzo-Seva, Timmerman, & Kiers, 2011). At the present, the HM has proved to be the most reliable factor retention method (Lorenzo-Seva et al., 2011). We expected a clear two-factor solution, in which the five items of each subscale load on different factors, with no significant cross-loadings (i.e., cross-loading > .40).
Simple and multigroup confirmatory factor analyses. Three CFAs were conducted with the second half of the sample. The first CFA tested the exploratory model, with both MLQ-P and MLQ-S factors together in the same measurement model. Two further CFAs were conducted for each subscale separately, because presence of meaning and search for meaning represent two different constructs (Steger et al., 2006). The robust maximum likelihood extraction method (i.e., with corrections to data non-normality, Satorra & Bentler, 2001) was used in the CFAs. Fit indices used were: chi-square (χ2) significant test, root mean square error of approximation (RMSEA), the standardized root mean square residual (SRMR), the comparative fit index (CFI), and the Tucker–Lewis index (TLI). According to several guidelines, the χ2 value must be non-significant, providing evidence that the observed matrix is significantly not different from the population matrix. The SRMR value must be of less than .08, and an RMSEA value must be of less than .06 or .08 (with higher-bound 90% confidence interval not exceeding .10). The CFI and TLI values should be greater than .90 (preferably greater than .95; Brown, 2006).
Multigroup confirmatory factor analyses (MGCFAs), with the total sample were performed to evaluate the measurement invariance of both MLQ subscales (MLQ-P and MLQ-S) across gender (female, n=1936; male, n=1.084) and age groups (youngsters, aged 18 to 29, n=1.622; adults, aged 30 to 59, n=1.109; and the elderly, more than 60 years old, n=289). The age groups were defined according to the Brazilian Institute of Geography and Statistics (IBGE) guidelines (IBGE, 2010).
The MGCFA tested the measurement invariance and structural invariance within five model parameters: Model 1 (unconstrained model/configural invariance) assessed whether the scale configuration (number of factors and items per factor) was acceptable for both groups (gender and age). If the model is not supported, then the instrument's factor structure cannot be considered equal for the groups evaluated. Model 2 (equal factor loadings/metric invariance) analyzed whether the items’ factor loadings were equal across groups, which can determine whether biases exist in the responses to one or more items. Model 3 (equal intercepts/scalar invariance) investigated whether the initial level of the latent variable was equal among the different groups. Model 4 (equal factor covariance/structural invariance) assessed the extent to which the variances of the latent variables were equal across groups. Finally, Model 5 (residual invariance) evaluated whether the measurement errors (item residuals) were equal among groups. The assessment levels of the models were ordered hierarchically. Each constrained model was nested within a less restricted one (Cheung & Rensvold, 2002).
The goodness-of-fit of the unconstrained model was evaluated using the chi-square/degree-of-freedom ratio (χ2/df), the standardized root mean square residual (SRMR), the comparative fit index (CFI), the Tucker–Lewis index (TLI) and the root mean square error of approximation (RMSEA). According to several guidelines, the χ2/df may be less than 2 or 3; the SRMR should be close to 0; the CFI and TLI must be higher than .90 or .95 or close to it, and RMSEA values that are less than .05 indicate a good fit, whereas those between .05 and .08 are a reasonable fit. The CFI difference test (ΔCFI) evaluated differences between the models. Measurement invariance of the constrained models was evaluated using the CFI difference test (ΔCFI, Cheung & Rensvold, 2002). Significant differences observed between the goodness-of-fit indices of the models (ΔCFI>.01) indicate that measurement invariance could not be achieved in the evaluated parameter.
Convergent and discriminant validity. Convergent validity (using Spearman's correlation) was assessed using the LOT-R (pessimism and optimism), the SWLS, and the SHS. We expect positive and low-to-moderate correlations among the MLQ-P subscale and the SHS, SWLS and LOT-R optimism, and negative correlations with LOT-R pessimism. Regarding MLQ-S subscale, we expect negative and low correlations with SWLS, SHS, LOT-R optimism, and positive correlations among MLQ-S and LOT-R pessimism.
Meaning in Life Questionnaire and sociodemographic variables. In order to evaluate the MLQ scores in the Brazilian population, we sought to examine its relation regarding some sociodemographic variables: (a) gender, (b) age, and (c) marital status. A multivariate analysis of variance (MANOVA) was performed with gender, age and marital status as independent variables (IVs). A bootstrapping procedure (1000 re-samplings, with a 99% confidence interval for the mean difference, ΔM) was employed to achieve greater reliability to the results, to correct the non-normal distribution of the sample and the difference in group sizes, and to present a confidence interval of 99% for the mean differences (Haukoos & Lewis, 2005). Effect sizes were calculated by the eta-squared (η2).
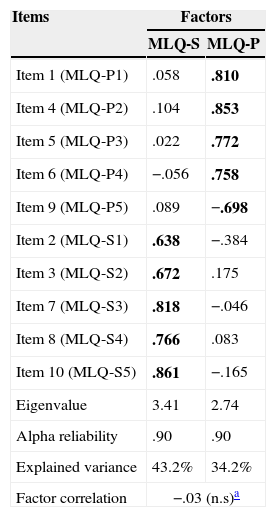
ResultsExploratory and confirmatory factor analysisAccording to the Hull Method, the two-factor solution was presented as the most adequate to the data. The EFA provided a clear two-factor solution, with the search and presence items loading satisfactorily in the expected factors (Table 1).
Exploratory factor analysis of the MLQ (n1=1503).
| Items | Factors | |
|---|---|---|
| MLQ-S | MLQ-P | |
| Item 1 (MLQ-P1) | .058 | .810 |
| Item 4 (MLQ-P2) | .104 | .853 |
| Item 5 (MLQ-P3) | .022 | .772 |
| Item 6 (MLQ-P4) | −.056 | .758 |
| Item 9 (MLQ-P5) | .089 | −.698 |
| Item 2 (MLQ-S1) | .638 | −.384 |
| Item 3 (MLQ-S2) | .672 | .175 |
| Item 7 (MLQ-S3) | .818 | −.046 |
| Item 8 (MLQ-S4) | .766 | .083 |
| Item 10 (MLQ-S5) | .861 | −.165 |
| Eigenvalue | 3.41 | 2.74 |
| Alpha reliability | .90 | .90 |
| Explained variance | 43.2% | 34.2% |
| Factor correlation | −.03 (n.s)a | |
Note: MLQ – Meaning in Life Questionnaire; MLQ search for meaning subscale; MLQ-P – MLQ presence of meaning subscale.
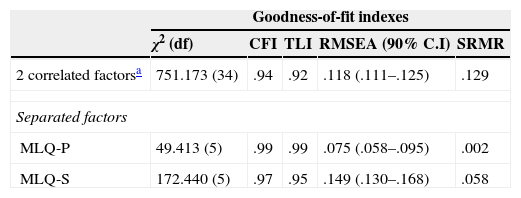
With the second half of the sample, three different CFAs evaluated the goodness-of-fit indexes of the exploratory obtained solution, and of concurrent models. For the first model, the χ2 was highly significant (p<.0001). Comparative fit indexes (CFI and TLI) were excellent. However, RMSEA and SRMR presented high levels of residuals (see Table 2).
Confirmatory factor analyses of the MLQ (n2=1.517).
| Goodness-of-fit indexes | |||||
|---|---|---|---|---|---|
| χ2 (df) | CFI | TLI | RMSEA (90% C.I) | SRMR | |
| 2 correlated factorsa | 751.173 (34) | .94 | .92 | .118 (.111–.125) | .129 |
| Separated factors | |||||
| MLQ-P | 49.413 (5) | .99 | .99 | .075 (.058–.095) | .002 |
| MLQ-S | 172.440 (5) | .97 | .95 | .149 (.130–.168) | .058 |
Note: MLQ search for meaning subscale; MLQ-P – MLQ presence of meaning subscale; χ2 – chi-square; df – degrees of freedom; CFI – comparative fit index; TLI – Tucker–Lewis Index; RMSEA – root mean square error of approximation; C.I – confidence interval; SRMR – standardized root mean-square residual.
An in-depth examination of these results using the Langrage Multiplier test (LM test) showed that many changes in model parameters were suggested in order to reduce model discrepancy, reduce the chi-square value, and, therefore, achieve adequate RMSEA and SRMR indexes (for more information on the mathematical approach behind the SRMR and RMSEA, see Brown, 2006). In the order of importance, these parameters were: F2→v2 (χ2=340.917, p<.001); F2→v10 (χ2=159.886, p<.001); F2→v9 (χ2=109.359, p<.001); F1→v6 (χ2=45.683, p<.001); F1→v9 (χ2=42.320, p<.001).
In synthesis, these modifications indexes suggest that allowing cross-loadings among MLQ-P and MLQ-S would significantly increase model fit. This result was expected since MLQ-P and MLQ-S are different, yet related constructs.
Considering these results, we evaluated the fit indexes of the MLQ subscales separately, and two further CFA were conducted. As can be seen in Table 2, the MLQ-P subscale presented excellent fit indexes. For the MLQ-S subscale, fit indexes were adequate, except the RMSEA that still presented high levels of residuals. Trying to comprehend this result, the LM test was again employed. The test showed that several error variances should be correlated in order to reduce chi-square value and improve model fit. However, since the objective of this study was not to refine the MLQ, and considering that error correlations are just methodological artifacts to improve model fit (Cole, Ciesla, & Steiger, 2007), these modifications were not employed.
Multigroup confirmatory factor analysis (MGCFA)In order to evaluate the measurement invariance of both the MLQ-P and MLQ-S subscales across gender and age groups (youngsters, adults, and the elderly), a set of MGCFA analyses were conducted.
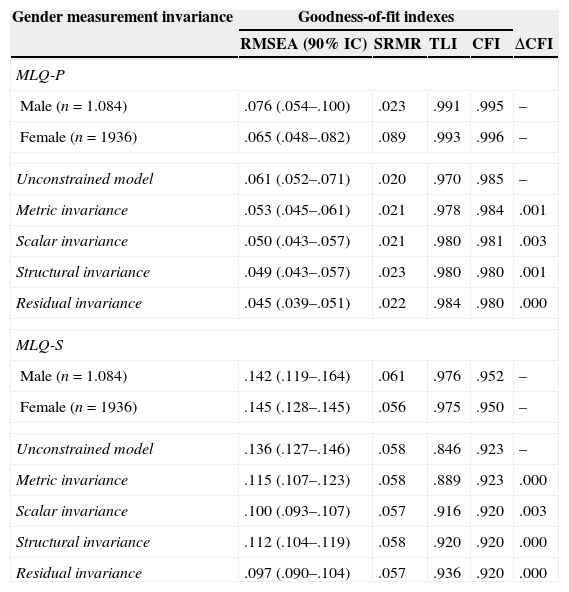
Initially, we sought to evaluate the baseline models for gender and for the different age groups. As can be seen in Tables 3 and 4, adequate fit indexes were achieved both in males and females, and youngsters, adults, and the elderly on both the MLQ-P and MLQ-S. As previously noted, however, the RMSEA values for the MLQ-S were high for all subgroups.
Fit indexes for gender MGCFA for the MLQ (N=3020).
| Gender measurement invariance | Goodness-of-fit indexes | ||||
|---|---|---|---|---|---|
| RMSEA (90% IC) | SRMR | TLI | CFI | ΔCFI | |
| MLQ-P | |||||
| Male (n=1.084) | .076 (.054–.100) | .023 | .991 | .995 | – |
| Female (n=1936) | .065 (.048–.082) | .089 | .993 | .996 | – |
| Unconstrained model | .061 (.052–.071) | .020 | .970 | .985 | – |
| Metric invariance | .053 (.045–.061) | .021 | .978 | .984 | .001 |
| Scalar invariance | .050 (.043–.057) | .021 | .980 | .981 | .003 |
| Structural invariance | .049 (.043–.057) | .023 | .980 | .980 | .001 |
| Residual invariance | .045 (.039–.051) | .022 | .984 | .980 | .000 |
| MLQ-S | |||||
| Male (n=1.084) | .142 (.119–.164) | .061 | .976 | .952 | – |
| Female (n=1936) | .145 (.128–.145) | .056 | .975 | .950 | – |
| Unconstrained model | .136 (.127–.146) | .058 | .846 | .923 | – |
| Metric invariance | .115 (.107–.123) | .058 | .889 | .923 | .000 |
| Scalar invariance | .100 (.093–.107) | .057 | .916 | .920 | .003 |
| Structural invariance | .112 (.104–.119) | .058 | .920 | .920 | .000 |
| Residual invariance | .097 (.090–.104) | .057 | .936 | .920 | .000 |
Note: MLQ search for meaning subscale; MLQ-P – MLQ presence of meaning subscale; RMSEA - root mean-square error of approximation; SRMR - standardized root mean-square residual; CFI - comparative fit index; TLI - Tucker–Lewis index.
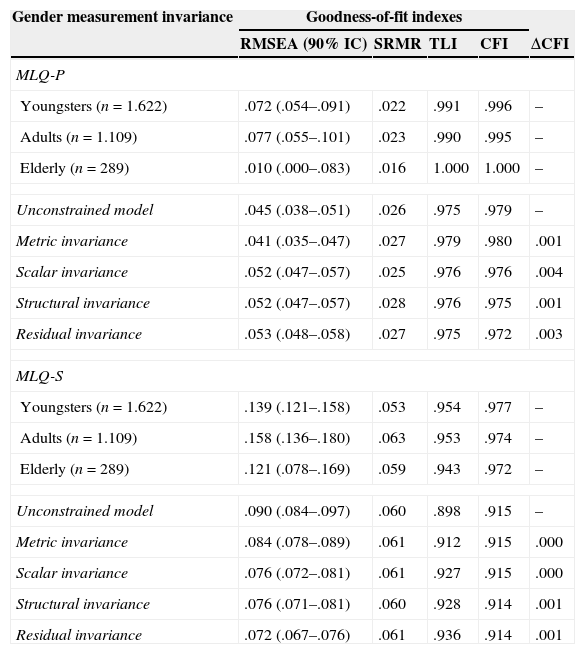
Fit indexes for age MGCFA for the MLQ (N=3020).
| Gender measurement invariance | Goodness-of-fit indexes | ||||
|---|---|---|---|---|---|
| RMSEA (90% IC) | SRMR | TLI | CFI | ΔCFI | |
| MLQ-P | |||||
| Youngsters (n=1.622) | .072 (.054–.091) | .022 | .991 | .996 | – |
| Adults (n=1.109) | .077 (.055–.101) | .023 | .990 | .995 | – |
| Elderly (n=289) | .010 (.000–.083) | .016 | 1.000 | 1.000 | – |
| Unconstrained model | .045 (.038–.051) | .026 | .975 | .979 | – |
| Metric invariance | .041 (.035–.047) | .027 | .979 | .980 | .001 |
| Scalar invariance | .052 (.047–.057) | .025 | .976 | .976 | .004 |
| Structural invariance | .052 (.047–.057) | .028 | .976 | .975 | .001 |
| Residual invariance | .053 (.048–.058) | .027 | .975 | .972 | .003 |
| MLQ-S | |||||
| Youngsters (n=1.622) | .139 (.121–.158) | .053 | .954 | .977 | – |
| Adults (n=1.109) | .158 (.136–.180) | .063 | .953 | .974 | – |
| Elderly (n=289) | .121 (.078–.169) | .059 | .943 | .972 | – |
| Unconstrained model | .090 (.084–.097) | .060 | .898 | .915 | – |
| Metric invariance | .084 (.078–.089) | .061 | .912 | .915 | .000 |
| Scalar invariance | .076 (.072–.081) | .061 | .927 | .915 | .000 |
| Structural invariance | .076 (.071–.081) | .060 | .928 | .914 | .001 |
| Residual invariance | .072 (.067–.076) | .061 | .936 | .914 | .001 |
Note: MLQ-S – MLQ search for meaning subscale; MLQ-P – MLQ presence of meaning subscale; RMSEA – root mean-square error of approximation; SRMR – standardized root mean-square residual; CFI – comparative fit index; TLI – Tucker–Lewis index.
Regarding measurement and structural invariance, full invariance was achieved for both MLQ-S and MLQ-P subscales, thus providing evidence that the MLQ-P and MLQ-S are not biased in any parameter for any of the compared groups (male and female, youngsters, adults and the elderly). The acceptable fit indexes for Model 1 (unconstrained model) demonstrate that the initial proposed model is plausible for all subgroups, fulfilling the configural invariance criteria (Brown, 2006; Cheung & Rensvold, 2002). Model 2 (metric invariance) evaluated whether the item factor loadings were equivalent across groups. There was not a significant reduction in the fit of Model 2 compared to Model 1, in the MLQ-P, or the MLQ-S. Because constraining the factor loadings to be equal across groups did not significantly reduce the fit indices, it can be concluded that the items present similar patterns of factor loadings across all tested groups. Therefore, there were no response biases for any of the items (Brown, 2006; Byrne, 2010). The fit for Model 3 (scalar invariance) showed that the intercepts of the items were equivalent for all groups in both MLQ-P and MLQ-S subscales, so that participants with the same level of the latent trait answered the questionnaire the same way. Once configural, metric and scalar invariance were achieved, group comparisons can be safely conducted, because no biases were found.
Full structural invariance was also achieved. Model 4 (structural invariance) showed that the latent variables variance were equivalent across all groups in both the MLQ-P and the MLQ-S subscales. Finally, the most restricted model (Model 5, residual invariance) presented evidence that the measurement errors for the items were also similar across all groups.
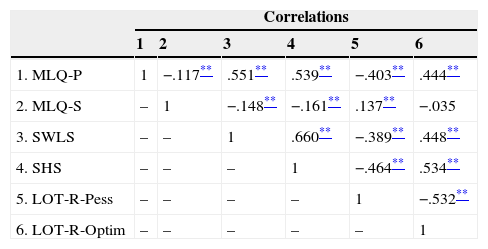
Convergent validityConvergent validity was assessed using the total sample. As expected, MLQ-P correlated positively with all subscales, except for MLQ-S and LOT-R pessimism. On the other hand, MLQ-S correlated negatively with MLQ-P, SWLS and SHS, and positively with LOT-R pessimism. However, no significant correlation was found between MLQ-S and LOT-R optimism.
Spearman's correlation of the MLQ with SWLS, SHS and LOT-R (N=3020).
| Correlations | ||||||
|---|---|---|---|---|---|---|
| 1 | 2 | 3 | 4 | 5 | 6 | |
| 1. MLQ-P | 1 | −.117** | .551** | .539** | −.403** | .444** |
| 2. MLQ-S | – | 1 | −.148** | −.161** | .137** | −.035 |
| 3. SWLS | – | – | 1 | .660** | −.389** | .448** |
| 4. SHS | – | – | – | 1 | −.464** | .534** |
| 5. LOT-R-Pess | – | – | – | – | 1 | −.532** |
| 6. LOT-R-Optim | – | – | – | – | – | 1 |
Note: MLQ-P=MLQ presence of meaning subscale; MLQ-S=MLQ search for meaning subscale; SWLS=Satisfaction with Life Scale; SHS=Subjective Happiness Scale; LOT-R-Pess=Life Orientation Test – Revised pessimism subscale; LOT-R-Optim=Life Orientation Test – Revised optimism subscale.
In order to evaluate possible differences in the magnitude of the correlation coefficients with the convergent measures, we used the Fisher r-to-z transformation test (Cohen & Cohen, 1983) for both the MLQ-P and MLQ-S separately. For both scales, no significant differences were found for any comparison. Thus, the levels of correlations between both the MLQ-P and MLQ-S with the convergent measures were statistically equivalent.
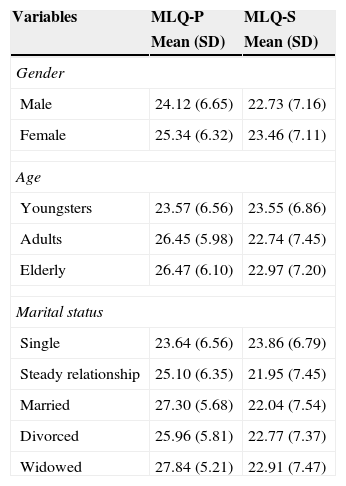
MLQ and sociodemographic variablesWe sought to examine the relation of the MLQ-P and MLQ-S with sociodemographic variables (age groups, gender and marital status). In order to easily comprehend the results, Table 6 presents descriptive statistics for all evaluated groups.
Descriptive statistics for MLQ-P and MLQ-S regarding gender, age, and marital status.
| Variables | MLQ-P | MLQ-S |
|---|---|---|
| Mean (SD) | Mean (SD) | |
| Gender | ||
| Male | 24.12 (6.65) | 22.73 (7.16) |
| Female | 25.34 (6.32) | 23.46 (7.11) |
| Age | ||
| Youngsters | 23.57 (6.56) | 23.55 (6.86) |
| Adults | 26.45 (5.98) | 22.74 (7.45) |
| Elderly | 26.47 (6.10) | 22.97 (7.20) |
| Marital status | ||
| Single | 23.64 (6.56) | 23.86 (6.79) |
| Steady relationship | 25.10 (6.35) | 21.95 (7.45) |
| Married | 27.30 (5.68) | 22.04 (7.54) |
| Divorced | 25.96 (5.81) | 22.77 (7.37) |
| Widowed | 27.84 (5.21) | 22.91 (7.47) |
Significant main effects were found for marital status [F(8, 5.928)=7.662; Wilk's Lambda=.98; p<.001; η2=.01], but not for gender [F(2, 2.963)=0.05; Wilk's Lambda=1.00; p=.995; η2=.00] or age groups [F(4, 5.928)=1.366; Wilk's Lambda=1.00; p=.243; η2=.00].
Post-hoc tests for marital status on the MLQ-P showed that single people had lower levels of meaning in life when compared to all other marital statuses (steady relationship, p<.05; married, p<.001; divorced, p<.001; and widowed, p<.001). Married people presented higher levels of meaning in life then single people (p<.001) and couples in a steady relationship (p<.001). The widowed and people in a steady relationship presented higher levels of meaning in life when compared to the single ones (p<.001). No significant differences were found among married people and the widowed (p=.95); widowed and divorced (p<.001); and divorced and steady relationship (p=.67).
Regarding MLQ-S, single people presented higher levels of search for meaning when compared to the married (p<.001) and people in a steady relationship (p<.001). Interaction effects were found only for gender x age for the MLQ-S [F(2, 2964)=3.449, p<.05]. Subsequent analyses showed that, for women, the youngsters (M=24.06; SD=6.64) presented higher levels of search for meaning when compared to the adults (M=22.80; SD=7.58; p<.001) and the elderly (M=22.67; SD=7.42; p<.05). No such differences were found for men.
DiscussionInitially, we evaluated the psychometric properties of the MLQ. The EFA found an expected two-factor solution as the most reliable to the data, with adequate factor loadings and alpha reliability. Further, three different CFAs were executed. The first CFA, which employed both the MLQ-P and MLQ-S into a single analysis, found acceptable fit indexes. Nonetheless, the RMSEA and SRMR presented high levels of residuals. These results suggest that to introduce different but related constructs into a single CFA can worsen the results.
The CFA is a technique designed to evaluate the adequacy of measurement models. Differently from EFA – in the CFA context – if the researcher does not explicitly allow cross-loadings among the items, the cross-loadings are fixed to 0 (Brown, 2006). To implement related but different constructs into a single CFA analysis, and to maintain possible cross-loadings fixed to 0 may increase the likelihood of residuals, since modifications indexes are prone to suggest that freeing some constraints would favor the model. This is exactly what happened in this case.
It is important to emphasize that in other MLQ validation studies (Góngora & Solano, 2011; Steger et al., 2006), the RMSEA values were also high. Although the authors have not discussed these results in depth, it is possible that the reasons are not different from those found in this study. Thus, we argue that future studies aiming to present CFA results for the MLQ would benefit of evaluating MLQ-P and MLQ-S separately.
Another point to take into consideration is the fact that when evaluated separately, the MLQ-S scale still presented high levels of residuals, as pointed out by the RMSEA value. The LM test provided evidence that many error variances should be correlated in order to improve model fit. As mentioned earlier, we did not implement any of the presented suggestions because to correlate error variances would just increase model fit, without improve the questionnaire itself (Cole et al., 2007).
Correlated error variances tend to suggest two possible issues: (a) Overlap content among the items, and (b) Neglected latent factors in the model that could be explaining the residual variance of the items, not explained by the search for meaning construct (Brown, 2006). A qualitative inspection of the MLQ-S items led us to believe that items were written with such a similar fashion that might be resulting in overlapping content. Although other fit indexes presented excellent results, refinement procedures (probably excluding redundant items or modifying item sentences) can improve the MLQ-S.
Regarding the MGCFA, the Brazilian MLQ presented full measurement and structural invariance in all tested groups. This result showed that the MLQ might be implemented for both male and female from all age groups (+18 years old). This represents an important quality indicator of the questionnaire, since groups comparisons can be safely conducted, without suffering from response bias. More than that, the questionnaire can be reliably used in a wide variety of ages in the Brazilian context.
Convergent validity of the Brazilian MLQ was also achieved. Expected correlations were found among the majority of the indicators. The magnitude of these correlations ranged from low to moderate. This result was also expected once the MLQ was designed to control for overlap content with other related variables (Steger et al., 2006). Regarding the magnitude of the convergent correlations, no differences were found for the MLQ-P or MLQ-S. In other words, the levels of the correlations with the convergent variables were statistically similar, influencing (or being influenced) by the MLQ factors at the same level.
A curious result was found within the MLQ-S and the LOT-R. Table 5 shows that the levels of search for meaning was positively related to pessimism, but not negatively related to optimism. Differentiation between optimism and pessimism has a long trajectory in the psychological field (e.g., Marshall et al., 1992). Authors have argued that optimism reflects anticipation of positive events, and is related with positive personality dispositions such as extraversion and positive emotional states. On the other hand, pessimism can be viewed as the disposition to expected negative events, and is related with neuroticism and negative emotional states (Marshall et al., 1992). Considering that search for meaning is generally linked to negative emotional states, such as negative affect, fear, sadness and depression (Park, Park, & Peterson, 2010; Steger et al., 2006), the relation between MLQ-S and LOT-R-Pessimism is theoretically reasonable. The optimistic in turn tend to see the world more positively, and tend to have better psychological adjustment than pessimistic people (see Carver, Scheier, & Segerstrom, 2010, for a review). Thus, the non-significant correlations among LOT-R-Optimism and MLQ-S can be comprehended on the basis that search for meaning, as a negative aspect of psychological adjustment, has no relation with optimism, but only with pessimism.
Regarding the association of presence of meaning and search for meaning with sociodemographic variables, main effects were found only for marital status. Compared to all other categories, single people presented lower levels of presence of meaning. Similarly, they presented higher levels of search for meaning when compared to married people and those in a steady relationship. These results are consistent with a large well-being literature which presents that single people are prone to have lower levels on general well-being, including both psychological and subjective well-being (Coombs, 1991; Diener, Gohm, Suh, & Oishi, 2000; Sharp & Ganong, 2011).
Married people presented higher levels of meaning in life when compared to the single ones and couples in a steady relationship. This result is equivalent with those found by Schnell (2009) in a representative German sample. According to the author, marriage can enhance a sense of belonging, thus enhancing life goals more objectively, through the aim of building a home, raising children, and the experience of significance through responsibility for children, for example (Schnell, 2009). In other worlds, marriage can still nowadays enhance a life-course perspective. Widowed and divorced people presented the same levels of meaning in life as married people. Regarding divorce, this result might be linked to the fact that although divorce is typically seen as a negative life event, well-being tends to increase after a relatively short period of time after the event (Luhmann, Hofmann, Eid, & Lucas, 2012). Regarding the widowed – because of a natural course of development – they tend to be old people. In these cases, studies have found that older people generally present adequate coping strategies when facing the challenges of a marital transition, resulting in resilient outcomes (Ong, Bergeman, Bisconti, & Wallace, 2006). According to Park (2010), although stressful life events (such as the death of a spouse) can hamper well-being levels for a while, the notion that highly stressful events shatter global meaning is minimal. This happens because people tend to adapt themselves to negative life circumstances through different meaning-making processes (for more information, see: Joseph & Linley, 2005; Park, 2010).
With regard to the MLQ-S, our results showed that single people presented higher levels of search for meaning when compared to married people and those in a steady relationship. This result seems to corroborate previous findings that having a partner (in this case, a spouse, a boyfriend, a fiancé, etc.) provides sense of belonging, direction, and future-life perspective (Schnell, 2009). This might be the explanation to the fact that people in these situations present less search for meaning.
Finally, young women presented higher levels of search for meaning when compared to adults and elderly women. Although age and search for meaning are only lowly correlated (Steger et al., 2006), this result might highlight developmental Brazilian issues. In this transition phase the youngsters in general have to face many challenges, including the choice of a career, first jobs, search for financial independence, etc. On one hand, these challenges are still more difficult for women who, for cultural reasons, have to deal with higher social charges such as marriage, motherhood and the constitution of a family, household care, etc. On the other hand, women are nowadays achieving greater social and professional recognition. Not without a high effort, they are achieving high professional positions and leadership roles in various professional fields. Because of this amount of responsibility (and above all because of their inner and social charges) they have to face mutual and sometimes conflicting goals (e.g., investing on a career and on their independence vs. investing on the constitution of a family). For these reasons, young women might present higher levels of search for meaning because of a conflicting future life perspective that, in Brazil, is more highlighted for women than for men.
Questionário de Sentido de Vida – Versão Brasileira (QSV-BR)
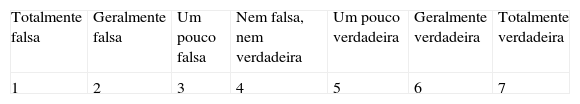
Tire um momento para pensar sobre os elementos que fazem sua vida parecer importante para você. Responda às afirmações abaixo da forma mais sincera e precisa que puder. Lembre-se que são questões muito pessoais e que não existem respostas certas ou erradas. Responda de acordo com a escala abaixo:
| 1. ____ Eu entendo o sentido da minha vida. |
| 2. ____ Estou procurando por algo que faça a minha vida ser significativa. |
| 3. ____ Eu estou sempre procurando encontrar o propósito da minha vida. |
| 4. ____ Minha vida tem um propósito claro. |
| 5. ____ Eu tenho uma clara noção do que faz a minha vida ser significativa. |
| 6. ____ Eu encontrei um propósito de vida satisfatório. |
| 7. ____ Eu estou sempre procurando por algo que faça com que a minha vida seja significativa. |
| 8. ____ Eu estou buscando um propósito ou uma missão para a minha vida. |
| 9. ____ Minha vida não tem um propósito claro. |
| 10. ____ Estou buscando sentido na minha vida. |
Sintaxe do QSV-BR para criação das escalas “Presença de sentido” e “Busca por sentido”:
Presença de sentido: Itens 1, 4, 5, 6, & 9-invertido.
Busca por sentido: Itens 2, 3, 7, 8, & 10.