

In recent decades western countries have become more open about sexuality and sexual relations, and adolescents get information about these issues mainly through the internet, TV and social networks. Often such information is incomplete, wrong or even contradicts itself. What favors them to develop myths, false beliefs and/or negative attitudes about sexuality, love, equality in relationships, or Sexually Transmitted Infections. At the same time, the presence of myths favors double standards, sexism, and a negative attitude toward toward personal, partner and/or social sexuality.
ObjectivesTo create a scale for evaluating the permanence of myths about sexuality in adolescents, and to analyze the structural reliability and validity of this scale.
MethodThe sample was formed by a pilot group (n=216) and a final group (n=661), both with adolescents from high schools in the province of Malaga, obtained by non-probability cluster sampling. The first 69 initial items were given to the pilot sample to determine the final questions making up the “Escala de Mitos sobre la Sexualidad”.
ResultAll final items have an item-total correlation over 0.29. A final questionnaire was obtained of 27 items, grouped into 6 components. The Cronbach's alpha coefficient indicated a high internal consistency of the test (0.881). Moreover, it confirms a significant difference between the sexes and between grades (cohorts).
ConclusionThe Scale has appropriate parameters for use in sex education and research. The use of this scale would help to discover adherence to the myths of adolescents, in order to eliminate them and build a solid, free and personal concept of sexuality.
En las últimas décadas se ha producido una apertura respecto a la sexualidad y las relaciones sexuales en los países occidentales. Esto ha propiciado que los adolescentes obtengan información sobre estos temas principalmente en Internet, la televisión y las redes sociales. A menudo, esta información es incompleta, no es verídica o incluso puede llegar a ser contradictoria, lo que favorece que desarrollen mitos, creencias falsas o actitudes negativas sobre la sexualidad, el amor, la igualdad en las relaciones o las infecciones de transmisión sexual. Al mismo tiempo, la existencia de mitos favorece el doble rasero, el sexismo y una actitud negativa hacia la sexualidad personal, la de la pareja o la social.
ObjetivosCrear una escala para evaluar la existencia de mitos sobre sexualidad en adolescentes y analizar la fiabilidad y la validez estructural de esta escala.
MétodoLa muestra estuvo formada por un grupo piloto (n=216) y otro final (n=661), ambos con adolescentes de institutos de la provincia de Málaga, obtenidos mediante muestreo por conglomerados no probabilísticos. Se pasaron los 69 ítems iniciales a la muestra piloto para establecer aquellos enunciados finales que compondrían la Escala de Mitos sobre la Sexualidad.
ResultadoTodos los ítems finales tienen una correlación ítem-total superior a 0,29. Se obtuvo un cuestionario final de 27 ítems, agrupados en 6 componentes. El coeficiente alfa de Cronbach indicó una elevada coherencia interna de la prueba (0,881). Además, se confirmó una diferencia importante entre sexos y entre los cursos académicos (cohortes).
ConclusiónLa Escala de Mitos sobre la Sexualidad presenta parámetros adecuados para ser utilizada en educación sexual y en investigación. El uso de esta escala ayudaría a descubrir la adhesión a los mitos de los adolescentes, para eliminarlos y construir un concepto de sexualidad sólido, libre y personal.
According to the World Health Organization (WHO),1 “Sexuality is a central aspect of being human throughout life and encompasses sex, gender identities and roles, sexual orientation, eroticism, pleasure, intimacy and reproduction. Sexuality is experienced and expressed in thoughts, fantasies, desires, beliefs, attitudes, values, behaviors, practices, roles and relationships. While sexuality can include all of these dimensions, not all of them are always experienced or expressed. Sexuality is influenced by the interaction of biological, psychological, social, economic, political, cultural, ethical, legal, historical, religious and spiritual factors.” It is an integral aspect of human beings that develops throughout their lives. It is in adolescence when the secondary sexual characteristics are developed, and when people experience many changes to obtain sexual maturity. Therefore, is a very important stage in their lives.
Just as adolescence takes place from age 10 to 19 and involves a period of physical and psychosocial changes, in which sexuality is very important, as attitudes and behavioral habits are formed at this time.2,3
In recent decades, Spanish society, and the west in general, have seen increasing openness regarding adolescent sexuality and sexual education. Nowadays, sexual education is a transversal subject in academic programs, and teaching it is left to the discretion of the educational center and/or corresponding health center.4,5 In Spain, this work is done by nurses at health centers, as in other countries,6 through educational programs such as “Forma Joven” (Young Health) in Andalusia. The nurses’ responsibilities include promoting a healthy lifestyle and preventing diseases, such as sexually transmitted infections (STIs). To do this work, it is of the utmost importance to assess the adolescents’ prior knowledge and misconceptions. Today they have a great deal of access to information of a sexual nature, through the internet, TV and social networks. This information is often incomplete, inaccurate, or even self-contradictory.7,8 However, most adolescents believe they are well-informed about sexuality,9 although this does not always lead to risk-free behavior or attitudes to sexuality.10–13 Beginning sexual relations early is not always accompanied by good education in this area,14 or the knowledge that is needed to face it in a healthy and positive way. Also, when analyzing this issue, we should take into account the preconceived ideas of adolescents about romantic love,15 the types of relationships this may entail, such as dependency relationships or gender violence, and personal and collective attitudes, positive or negative, toward sexuality expressed by this group.
As a result of all the above, adolescents are very likely to encounter myths, false beliefs and/or negative attitudes about sexuality, love, equality in relationships, and STIs.16,17 Many of these myths are the legacy of past generations, transmitted through the socialization process,18 or have been modified as an adaptation to the generational changes produced in our society, such as the existence of benevolent sexism.19 It has been demonstrated that the presence of myths favors double standards in morals, sexism, and a negative attitude toward one's own sexuality from partners and/or society.16,17,20
At present there is no English and Spanish-language measuring instrument suitable for assessing myths and false beliefs about sexuality. Therefore, this research aims to:
- 1.
Create a scale to evaluate the presence of myths about sexuality in adolescents.
- 2.
Analyze the structural reliability and validity of this scale.
- 3.
To be aware of the myths and false beliefs of adolescents in the study.
Obtaining an instrument to measure myths about sexuality enables efficient interventions starting from existing ideas in this cohort, and permits effective sex education based on the demystification of their erroneous knowledge and their false beliefs.
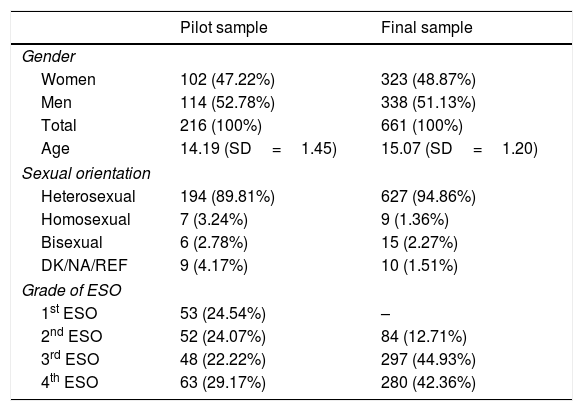
Material and methodsSubjectThis research was based on two samples, a pilot and a final sample. The pilot sample was selected from Fernando de los Ríos High School, and the final sample was selected from Alfaguara, Casabermeja, Emilio Prados and Montecillos High Schools. All the schools are located in the province of Malaga. The socio-demographic data of the two samples are presented in Table 1.
Socio-demographic data.
| Pilot sample | Final sample | |
|---|---|---|
| Gender | ||
| Women | 102 (47.22%) | 323 (48.87%) |
| Men | 114 (52.78%) | 338 (51.13%) |
| Total | 216 (100%) | 661 (100%) |
| Age | 14.19 (SD=1.45) | 15.07 (SD=1.20) |
| Sexual orientation | ||
| Heterosexual | 194 (89.81%) | 627 (94.86%) |
| Homosexual | 7 (3.24%) | 9 (1.36%) |
| Bisexual | 6 (2.78%) | 15 (2.27%) |
| DK/NA/REF | 9 (4.17%) | 10 (1.51%) |
| Grade of ESO | ||
| 1st ESO | 53 (24.54%) | – |
| 2nd ESO | 52 (24.07%) | 84 (12.71%) |
| 3rd ESO | 48 (22.22%) | 297 (44.93%) |
| 4th ESO | 63 (29.17%) | 280 (42.36%) |
Note: SD, standard deviations.
To collect the socio-demographic data and variables relating to sexuality, we created an ad hoc questionnaire. In relation to the Scale of Myths about Sexuality we developed a large number of questions based on erroneous ideas provided by adolescents in a brainstorming session21 and on the basis of studies of these myths in certain specific areas.10,15,22
Subsequently, the items produced were analyzed by a group of 23 experts (9 sexologists, 4 secondary school teachers, 4 nurses, 3 psychologists, and 3 doctors), with two goals: to clarify the wording as much as possible to make it easy for the target population of our study to understand, and to eliminate redundant items. After this process, some of the initial items were reduced or modified. To fine-tune it, we gave a copy of the questionnaire to a small number of adolescents in every grade of compulsory secondary education (Educación Secundaria Obligatoria, ESO) (6 adolescents, 2 from each grade), to ensure it was clear and understandable for this cohort. In all cases they confirmed they understood all the items in the questionnaire sufficiently well. As a result of this process, we obtained the 69 initial items that were given to the pilot sample to determine the final items making up the “Escala de Mitos sobre la Sexualidad (EMS)”.
With the goal of using these items to assess adolescents’ agreement or disagreement with the myths, the questionnaire was drafted in a 5-point Likert-type scale, where 1 indicated “strongly disagree”, 2 “disagree”, 3 “neutral”, 4 “agree” and 5 “strongly agree”. The correction is made by adding all the scores for the items. The total scores will range from 27 (less adherence to myths) to 135 (greater adherence to sexual myths), that occurs when adding each of the scores. Where at a lower score, adolescents have fewer myths and the ideas they have are more true.
ProcedureThe non-probability cluster sampling consisted of selecting high schools in the province of Malaga and asking them to participate in the study. To make the sample sufficiently broad, five schools were selected. The schools were randomly selected depending on whether they were urban or rural; if a school declined to participate in the research it was replaced by another of the same characteristics.
Data analysisThe following statistical tests were carried out both in the pilot sample and in the final sample: Cronbach's alpha was calculated for the reliability analysis, as well as the item-total correlation for the item analysis. To study the factorial structure, an exploratory factor analysis was carried out using the polychoric correlation matrix by means of the principal component extraction method and the varimax rotation, verifying previously the assumptions for this analysis, by means of the Kaiser–Meyer–Olkin test (KMO), the determinant of the matrix and Bartlett's sphericity test. To verify the assumption of normality, the Kolmogorov–Smirnov test was performed. To test the initial hypothesis, the Mann–Whitney test and the Kruskal–Wallis test were performed. The data analysis was carried out with the SPSS® v.19.
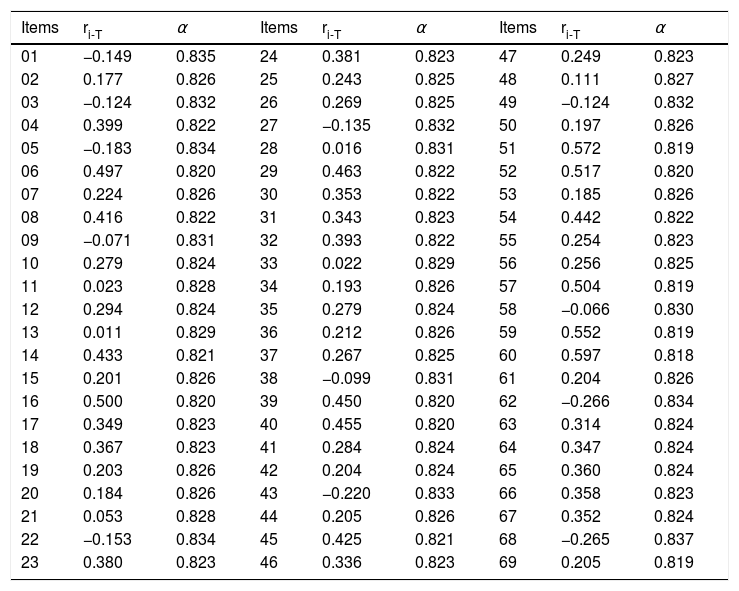
ResultsPsychometric analysis of the pilot sampleThe first step in developing the final questionnaire was the analysis of the items in the pilot sample, to discard unsuitable items and select those with a higher item-total correlation. The results are shown in Table 2.
Analysis of the items of the initial scale in the pilot sample.
| Items | ri-T | α | Items | ri-T | α | Items | ri-T | α |
|---|---|---|---|---|---|---|---|---|
| 01 | −0.149 | 0.835 | 24 | 0.381 | 0.823 | 47 | 0.249 | 0.823 |
| 02 | 0.177 | 0.826 | 25 | 0.243 | 0.825 | 48 | 0.111 | 0.827 |
| 03 | −0.124 | 0.832 | 26 | 0.269 | 0.825 | 49 | −0.124 | 0.832 |
| 04 | 0.399 | 0.822 | 27 | −0.135 | 0.832 | 50 | 0.197 | 0.826 |
| 05 | −0.183 | 0.834 | 28 | 0.016 | 0.831 | 51 | 0.572 | 0.819 |
| 06 | 0.497 | 0.820 | 29 | 0.463 | 0.822 | 52 | 0.517 | 0.820 |
| 07 | 0.224 | 0.826 | 30 | 0.353 | 0.822 | 53 | 0.185 | 0.826 |
| 08 | 0.416 | 0.822 | 31 | 0.343 | 0.823 | 54 | 0.442 | 0.822 |
| 09 | −0.071 | 0.831 | 32 | 0.393 | 0.822 | 55 | 0.254 | 0.823 |
| 10 | 0.279 | 0.824 | 33 | 0.022 | 0.829 | 56 | 0.256 | 0.825 |
| 11 | 0.023 | 0.828 | 34 | 0.193 | 0.826 | 57 | 0.504 | 0.819 |
| 12 | 0.294 | 0.824 | 35 | 0.279 | 0.824 | 58 | −0.066 | 0.830 |
| 13 | 0.011 | 0.829 | 36 | 0.212 | 0.826 | 59 | 0.552 | 0.819 |
| 14 | 0.433 | 0.821 | 37 | 0.267 | 0.825 | 60 | 0.597 | 0.818 |
| 15 | 0.201 | 0.826 | 38 | −0.099 | 0.831 | 61 | 0.204 | 0.826 |
| 16 | 0.500 | 0.820 | 39 | 0.450 | 0.820 | 62 | −0.266 | 0.834 |
| 17 | 0.349 | 0.823 | 40 | 0.455 | 0.820 | 63 | 0.314 | 0.824 |
| 18 | 0.367 | 0.823 | 41 | 0.284 | 0.824 | 64 | 0.347 | 0.824 |
| 19 | 0.203 | 0.826 | 42 | 0.204 | 0.824 | 65 | 0.360 | 0.824 |
| 20 | 0.184 | 0.826 | 43 | −0.220 | 0.833 | 66 | 0.358 | 0.823 |
| 21 | 0.053 | 0.828 | 44 | 0.205 | 0.826 | 67 | 0.352 | 0.824 |
| 22 | −0.153 | 0.834 | 45 | 0.425 | 0.821 | 68 | −0.265 | 0.837 |
| 23 | 0.380 | 0.823 | 46 | 0.336 | 0.823 | 69 | 0.205 | 0.819 |
Note: ri-T: corrected item-total correlation; α: Cronbach's α if item is deleted.
According to the indications of Ebel,23 items with an item-total correlation under 0.19 should be removed, and those between 0.20 and 0.29 should be reviewed. In this case, as it was a sample pilot with an excessive number of items, we decided to eliminate all the items with an item-total correlation under 0.29. For this reason we eliminated the following items: 1, 2, 3, 5, 7, 9, 10, 11, 12, 13, 15, 19, 20, 21, 22, 25, 26, 27, 28, 33, 34, 35, 36, 37, 38, 41, 42, 43, 44, 47, 48, 49, 50, 53, 55, 56, 58, 61, 62, 68 and 69. Likewise, and in spite of an adequate item-total correlation (0.507), we decided to delete item 57, as it had been specifically rejected by several students’ parents, and some counselors at the schools objected to it, claiming that this item could have a corrupting influence on the adolescents, as it would confront them too directly with sexuality.
This gave a final questionnaire of 27 items. We decided to keep this number of items, regarding it as sufficient. After eliminating the other items, the Cronbach's alpha of the questionnaire was 0.881.
We made the necessary calculations to determine whether to use a factorial analysis. According to the results of the determinant of the matrix (0.0002), Bartlett's Test of Sphericity (1677.6; gl=351; p=0.000), and the Kaiser–Meyer–Olkin test (KMO=0.868), a factorial analysis would be appropriate.
The factorial analysis was carried out by means of a polychoric correlation matrix, which is recommended when one assumes a level of ordinal measurement,24 in this case, Likert-type responses.25 The main components were analyzed using the varimax rotation and were 8 components were obtained, which explained 59.39% of variance.
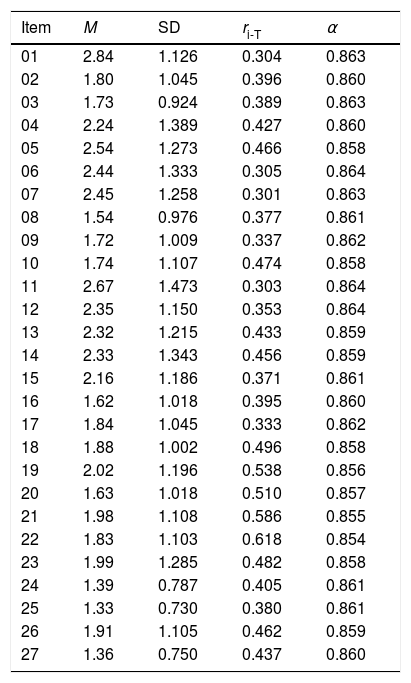
Psychometric analysis of the final sampleOnce we had the definitive questionnaire, it was given to the final sample of adolescents. To analyze the items, we again analyzed the item-total correlation. The results can be seen in Table 3.
Analysis of the items of the final scale in the final sample.
| Item | M | SD | ri-T | α |
|---|---|---|---|---|
| 01 | 2.84 | 1.126 | 0.304 | 0.863 |
| 02 | 1.80 | 1.045 | 0.396 | 0.860 |
| 03 | 1.73 | 0.924 | 0.389 | 0.863 |
| 04 | 2.24 | 1.389 | 0.427 | 0.860 |
| 05 | 2.54 | 1.273 | 0.466 | 0.858 |
| 06 | 2.44 | 1.333 | 0.305 | 0.864 |
| 07 | 2.45 | 1.258 | 0.301 | 0.863 |
| 08 | 1.54 | 0.976 | 0.377 | 0.861 |
| 09 | 1.72 | 1.009 | 0.337 | 0.862 |
| 10 | 1.74 | 1.107 | 0.474 | 0.858 |
| 11 | 2.67 | 1.473 | 0.303 | 0.864 |
| 12 | 2.35 | 1.150 | 0.353 | 0.864 |
| 13 | 2.32 | 1.215 | 0.433 | 0.859 |
| 14 | 2.33 | 1.343 | 0.456 | 0.859 |
| 15 | 2.16 | 1.186 | 0.371 | 0.861 |
| 16 | 1.62 | 1.018 | 0.395 | 0.860 |
| 17 | 1.84 | 1.045 | 0.333 | 0.862 |
| 18 | 1.88 | 1.002 | 0.496 | 0.858 |
| 19 | 2.02 | 1.196 | 0.538 | 0.856 |
| 20 | 1.63 | 1.018 | 0.510 | 0.857 |
| 21 | 1.98 | 1.108 | 0.586 | 0.855 |
| 22 | 1.83 | 1.103 | 0.618 | 0.854 |
| 23 | 1.99 | 1.285 | 0.482 | 0.858 |
| 24 | 1.39 | 0.787 | 0.405 | 0.861 |
| 25 | 1.33 | 0.730 | 0.380 | 0.861 |
| 26 | 1.91 | 1.105 | 0.462 | 0.859 |
| 27 | 1.36 | 0.750 | 0.437 | 0.860 |
Note: M: item mean; SD: item standard deviation; ri-T: corrected item-total correlation; α: Cronbach's α if item is deleted.
Reliability was estimated by the Cronbach's alpha coefficient, with a value of 0.865. Questionnaires with alpha values of 0.70 or higher are suitable for research.26 The scale presents a high degree of internal consistency.
We made the necessary calculations to determine whether to use a factorial analysis, in the same way as with the pilot sample. According to the results of the determinant of the matrix (0.003), Bartlett's Test of Sphericity (3700.489; gl=351; p=0.000), and the Kaiser–Meyer–Olkin test, (KMO=0.910), a factorial analysis would be appropriate.
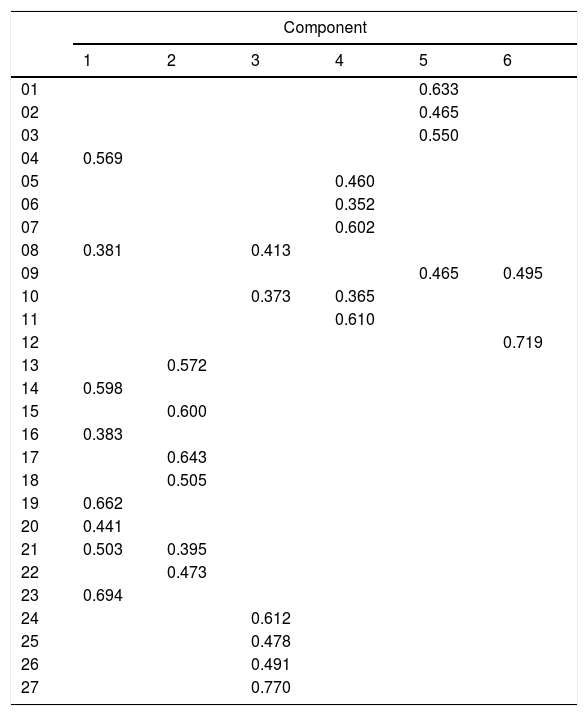
The factorial analysis was carried out using a polychoric correlation matrix. We analyzed the main components using the varimax rotation and obtained 6 components which explained 46.77% of variance. The saturating items in each component after the rotation are shown in Table 4. Saturation of 0.35 or above was established as the cut-off point for allocating items to the components.
Rotated component matrix.
| Component | ||||||
|---|---|---|---|---|---|---|
| 1 | 2 | 3 | 4 | 5 | 6 | |
| 01 | 0.633 | |||||
| 02 | 0.465 | |||||
| 03 | 0.550 | |||||
| 04 | 0.569 | |||||
| 05 | 0.460 | |||||
| 06 | 0.352 | |||||
| 07 | 0.602 | |||||
| 08 | 0.381 | 0.413 | ||||
| 09 | 0.465 | 0.495 | ||||
| 10 | 0.373 | 0.365 | ||||
| 11 | 0.610 | |||||
| 12 | 0.719 | |||||
| 13 | 0.572 | |||||
| 14 | 0.598 | |||||
| 15 | 0.600 | |||||
| 16 | 0.383 | |||||
| 17 | 0.643 | |||||
| 18 | 0.505 | |||||
| 19 | 0.662 | |||||
| 20 | 0.441 | |||||
| 21 | 0.503 | 0.395 | ||||
| 22 | 0.473 | |||||
| 23 | 0.694 | |||||
| 24 | 0.612 | |||||
| 25 | 0.478 | |||||
| 26 | 0.491 | |||||
| 27 | 0.770 | |||||
Component 1, “Intolerance”, contains items 4, 8, 14, 16, 19, 20, 21 and 23; component 2, “Romantic love”, contains items 13, 15, 17, 18, 21 and 22; component 3, “Sexist Myths”, contains items 8, 10, 24, 25, 26 and 27; component 4, “Generational Myths”, contains items 5, 6, 7, 10 and 11; component 5, “Contraception”, contains items 1, 2, 3 and 9; and component 6, “Pregnancy”, contains items 9 and 12.
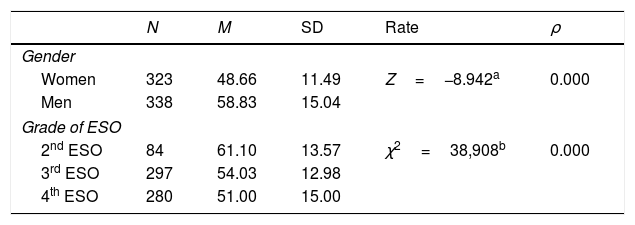
Checking the scores in the questionnaireThe Kolmogorov-Smirnov test was conducted to check the normality of the sample, and it was found that neither the distribution of men (Z=1.363, p=0.049) nor of women (Z=1.491, p=0.023) meets the criteria of normal distribution. For this reason, non-parametric tests were used to check for differences in the average scores obtained on the questionnaire by men and women and according to their grade (age group). The results are shown in Table 5.
Contrast the average scores obtained in the questionnaire on gender and grades of ESO.
| N | M | SD | Rate | ρ | |
|---|---|---|---|---|---|
| Gender | |||||
| Women | 323 | 48.66 | 11.49 | Z=−8.942a | 0.000 |
| Men | 338 | 58.83 | 15.04 | ||
| Grade of ESO | |||||
| 2nd ESO | 84 | 61.10 | 13.57 | χ2=38,908b | 0.000 |
| 3rd ESO | 297 | 54.03 | 12.98 | ||
| 4th ESO | 280 | 51.00 | 15.00 | ||
Note: a, U of Mann–Whitney; b, Kruskal–Wallis; N, number of people; M, mean; SD, Standard Deviation; ρ<0.01.
The differences in mean score depending on the grade are statistically significant (p=0.000), but they were checked with the Kruskal–Wallis test, which does not indicate the two grades where there is a difference. To do this, we used the Mann–Whitney test, taking the grades two at a time. The data indicate that there are differences between the average score in all grades, between 2nd grade and 3rd grade of ESO (Z=−4.069, p=0.000), between 2nd and 4th grades (Z=−5.949, p=0.000), and between 3rd and 4th grades (Z=−3.368, ρ=0.001).
DiscussionThe finding of this study attest to the reliability and validity of the Scale of Myths about Sexuality as an instrument for use with adolescents. The EMS scale measures six factors belonging to the area of sexuality: “Intolerance” for different sexualities; “Romantic love”, the concept of love most deeply entrenched in our society15,20; “Sexist Myths”, with double standards and ambivalent sexism still present in our population22,27; “Generational Myths”, transmitted in socialization and the education of a generation; “Contraception”, correct knowledge of contraceptive methods and the rejection of false ideas that negate safe sex, and “Pregnancy”, knowing how it really occurs and what are the risk behaviors that can lead to it. All these factors explain a high percentage of the explained variance. With regard to reliability, the alpha values are high, so that the scale shows adequate internal consistency. These data indicate that this scale has desirable psychometric characteristics for use in sex education and research, the two objectives of the present investigation.
When analyzing the averages of the variables we noted significant differences by gender, with boys generally believing more myths about sexuality than girls. There are also significant differences when comparing different school grades, with the 2nd grade of ESO having the most erroneous beliefs. These differences may be due to the fact that the 3rd and 4th grades of ESO have already received some sex education at school, from the nurses responsible for these programs.8,28
On the other hand, given the protective and myth-ridden society surrounding Spanish adolescents, it is important to give them a good sex education so that they can eradicate the myths already implanted in the older generations. Some parents and educators were led by fear and repugnance to try to prevent the progress of a research project which merely recommends education for young people, so that they can develop and can choose how to live their sexuality freely. The elimination of item 57 (“if someone sticks their finger in a guy's ass and he likes it, he is homosexual”), due to the fear it might corrupt adolescents or because parents do not want to think about the sex education of their own children, simply confirms how strongly rooted these myths, false beliefs and taboos are in a developed society like Spain.
All of this leads us to conclude that having an appropriate and valid way to measure the level of acceptance and prevalence of myths about sexuality enables us to discover the false beliefs of adolescents, so that these can be eradicated before starting to build a solid, free and personal concept of sexuality.
LimitationsThe study results must be interpreted in the light of several characteristics. The sample was not evenly distributed between rural and urban populations. Also, private and semi-private schools could not be included, and they might have different characteristics. The chosen schools may well be more aware of the importance of sex education for adolescents, since they did not reject the research project, while others did. Adolescents in the 1st grade of ESO were not included in the study because parents and school counselors ruled against it.
Implication for future researchThe presence of myths should be researched in adolescent populations with different characteristics to the sample (private and semi-private schools, marginalized areas, etc.), as well as conducting a study across all grades in order to see how prevalent these myths are among younger adolescents. As this study is transversal and we will not be able to see how the presence of these myths has changed, new research should be undertaken in the future to analyze this phenomenon.
ConclusionsThe EMS has appropriate parameters for use in sex education with adolescents and in research. Meanwhile, it confirms the presence of myths among the adolescent population and the need for early, good quality sex education in order to avoid them. The problems encountered by the research project have shown that the presence of myths tends to restrict younger generations and affects society on a larger scale.
Ethical disclosuresProtection of human and animal subjectsThe authors declare that no experiments were performed on humans or animals for this investigation.
Confidentiality of dataThe authors declare that no patient data appears in this article.
Right to privacy and informed consentThe authors declare that no patient data appears in this article.
Conflicts of interestNone declared.
The following are the supplementary data to this article: