


In recent years, research on the families of persons with Intellectual Disability (ID) has focused on the factors that contribute to the improvement of their Family Quality of Life (FQoL), such as the support they get and their partnership with professionals. However, due to the complexity of the variables related to FQoL and support needs and adequacy, measuring these constructs is difficult and multidimensional. To do this, the aim of this study is to generate new indexes through a series of instruments and assess their feasibility to improve the evaluation process and not reduce the situation to single measurements. We applied 3 instruments adapted to the Spanish population – Service Inventory, Beach Center Family-Professional Partnership Scale, and Beach Center FQOL – to a sample of 202 families of children with ID and we studied the indexes. The results show that the new indexes were designed to make FQoL measurements more easily manageable and interpretable. In fact, we found a statistical significant correlation between partial indexes (p<.001) in relation to the total score and very high sensibility of the indexes in relation to the degree of disability (p<.001). They also facilitate conducting complex analyses without having to discard any relevant measurement dimension.
En los últimos años, la investigación sobre las familias de las personas con discapacidad intelectual se ha centrado en los factores que contribuyen a la mejora de su calidad de vida familiar (CdVF), como, por ejemplo, los apoyos que estos reciben por parte de los servicios y la colaboración con los profesionales. Debido a la complejidad de estos constructos, su medición es difícil y multidimensional. El objetivo de este estudio es generar nuevos índices para una serie de instrumentos y valorar su viabilidad para mejorar el proceso de evaluación y no reducir la valoración a una única medida. Para ello, se aplicaron 3 instrumentos adaptados a la población española: el Inventario de Apoyos, la Escala de Colaboración Familias-Profesionales y la Escala de CdVF a una muestra de 202 familias de niños con discapacidad intelectual, y los índices fueron estudiados. Los resultados muestran que los índices fueron diseñados para hacer más fácil el manejo e interpretación de las medidas de CdVF. De hecho, encontramos correlaciones estadísticamente significativas entre los índices parciales (p<0,001) y la puntuación total, y una muy alta sensibilidad con el grado de discapacidad (p<0,001). Estos también facilitan la realización de análisis complejos sin tener que descartar ninguna dimensión de medida relevante.
Since the 1960s and 1970s, the interest of researchers in families of children with intellectual disability (ID) focused on the impact the disability had on the families in terms of stress and/or depression (Bailey et al., 1998; Davis & Gavidia-Payne, 2009; Turnbull, Summers, Lee, & Kyzar, 2007), thus favoring a pathological perspective of those families (Cunningham, 2000; Gallimore, Weisner, Bernheimer, Guthrie, & Nihira, 1993; Summers, Behr, & Turnbull, 1989; Turnbull, 2003).
From the 1990s and 2000s onwards, a more positive vision of the families has increasingly appeared in the literature, emphasizing the possibility of positive adaptation to their child's disability as long as the family has the necessary abilities and support. It is understood that the adaptation processes and needs of those families are not always the same (Cunningham, 2000). As a result of that evolution, research has focused less on the difficulties suffered by the families, such as stress, and increasingly has been concerned with the factors that contribute to their adaptation to their situation as successfully as possible (Shapiro, Blacher, & Lopez, 1998; Summers et al., 1989).
In that context, the interest of the scientific community, and also the professionals and the families themselves, in family quality of life (FQoL) has become a goal both for research and intervention. Bailey et al. (1998), on the one hand, suggest that “overall perception of quality of life probably represents more than the sum of the other family outcomes domains” (p. 323) such as family perceptions about support system, satisfaction with the overall program, individual services, and service providers (Bailey et al., 1998). On the other hand, Mannan, Summers, Turnbull and Poston (2006) show that the FQoL is a more global construct to reflect family well-being. That is to say, FQoL has emerged as a good outcome to define the global life situation of those families that should be explored and encouraged (Brown & Brown, 2004; Mannan et al., 2006; Schalock & Verdugo, 2002; Schalock, 2004; Turnbull et al., 2004; Turnbull et al., 2007).
Zuna, Turnbull and Summers (2009) and Zuna, Summers, Turnbull, Hu and Xu (2010) have proposed that FQoL predictors are related to the following factors: (1) family as a unit (family characteristics and dynamics), (2) the individuals who make up the family (demographic and individual characteristics, and beliefs of each family member), (3) performance (services, support, and practices), and (4) the system (the system, the policies, and the programs).
Researchers such as Brown, MacAdam-Crisp, Wang and Iarocci (2006), Davis and Gavidia-Payne (2009), Hu, Wang and Fei (2012), Summers et al. (2007), and Wang, Summers, Little, Turnbull, Poston, and Mannan (2006) have conducted research in several social and cultural contexts. In these studies, the authors attempted to measure whether the performance system, including supports (defined as services provided to family and child), and practices (defined as relationships with professionals) were meeting the family needs, and if so, whether the degree to which these needs were met predicts FQoL (Chiu, Turnbull, & Summers, 2013). This multi-level FQoL model illustrates the complexity of family dynamics. To investigate factors which may be amenable to interventions, and to determine what types of supports will have maximum results in terms of family outcome (i.e., FQoL), it is important to have efficient and effective measures of the various predictive factors.
In our case, in order to take a step forward in research on FQoL in Spain, to implement the measure to improve the practices targeted by these families, we deemed it appropriate to adapt (from previous research) three instruments to our population: the Service Inventory, the Beach Center Family-Professional Partnership Scale, and the Beach Center FQoL (Balcells-Balcells, Giné, Guàrdia-Olmos, & Summers, 2011).
The Service Inventory is an instrument that measures the degree to which supports and services that the family and child receive meet their needs. The Beach Center Family-Professional Partnership Scale is a measure to assess family perceptions about their family-professional partnerships. The Beach Center FQoL Scale is intended to identify perceptions of FQoL.
Those instruments require from the families that they assess the indicators according to two measurement dimensions.
- 1.
The Service Inventory measures: (a) family perceptions of needs for services and, (b) the degree to which those needs are met. As regards these measurement dimensions of the Service Inventory, no precedents were found in the literature contributing relevant information.
- 2.
The Beach Center Family-Professional Partnership Scale and the Beach Center FQoL assess family responses to components of each based on their ratings of: (a) importance and, (b) satisfaction. The concept of satisfaction has historically been used to measure QoL subjectively. Schalock and Verdugo (2002) point out that the subjective aspects of FQoL are linked to the importance the family gives to each quality of life dimension and the feeling of well-being they provide. According to Sainz, Verdugo and Delgado (2006), the goal to evaluate the same indicators in two different ways lies in setting a cognitive contrast between both aspects and thus establishing the perceived quality of the relationship. Córdoba, Verdugo and Gómez (2006) and Poston, Turnbull, Park, Mannan, Marquis and Wang (2003) highlight the value acquired by the importance indicator so that families can individualize their answers and choose indicators that are significant for them.
The presence of both measurement dimensions of each instrument seems to be more than justified. However, multiple dimensions of a construct also present challenges such as creating confusion for the analysis of results. Summers et al. (2007), for instance, in order to apply Structural Equation Models (SEM) with the data resulting from the three instruments of interest, used only one dimension for each measure (“the degree to which those needs are met” regarding the Service Inventory, and “satisfaction” for the Family Beach Center Family-Professional Partnership Scale and the Beach Center FQoL). Balcells-Balcells, Giné, Guàrdia-Olmos, and Summers (2011), Hoffman, Marquis, Poston, Summers and Turnbull (2006), Hu et al. (2012), and Wang et al. (2006) analyzed separately the models to measure importance and satisfaction in order to study the internal consistency of the Beach Center FQoL, thus obtaining two sets of independent values for one instrument.
As a consequence of the above mentioned, the purpose of this paper is to generate indexes for each instrument (Service Inventory, Beach Center Family-Professional Partnership Scale, and Beach Center FQoL) that assesses each indicator according to one measure in order to facilitate the work of both researchers and practitioners when using those instruments and assess their feasibility. The new proposal does not mean to replace an integral evaluation process, but to generate a simpler, faster, shorter analysis system to provide early screening information. To do so, we combined the original measurement dimensions to capture both perceptions. The way to answer the instruments does not change. However, in order to improve the measure, the scores resulting from the instruments administered are combined, thus facilitating data interpretation and the analyses derived thereof.
In short, this paper has tested whether these indexes generated for each instrument according to the psychometric requirements, can simplify the interpretation of results into only one valid, efficient measure. In other very close scientific fields, it is common practice to estimate simple indexes to represent special psychological and social variables. In general, these estimates are based in a linear combination of partial indicators (items) and a specific General Linear Model (GLM) to weight the relative importance of each of the included items or indicators. In this case, according to Trauer and Mackinnon (2001) or Wu, Chen and Tsai (2009), we generated a GLM for all the indexes with the assumption that each item is weighted for the same parameter in order to fit a general model with equal intensity for all the indicators defined.
MethodParticipantsThe sample comprised 202 families of 0–6 year olds with intellectual disability from 13 early childhood intervention centers (ECI).
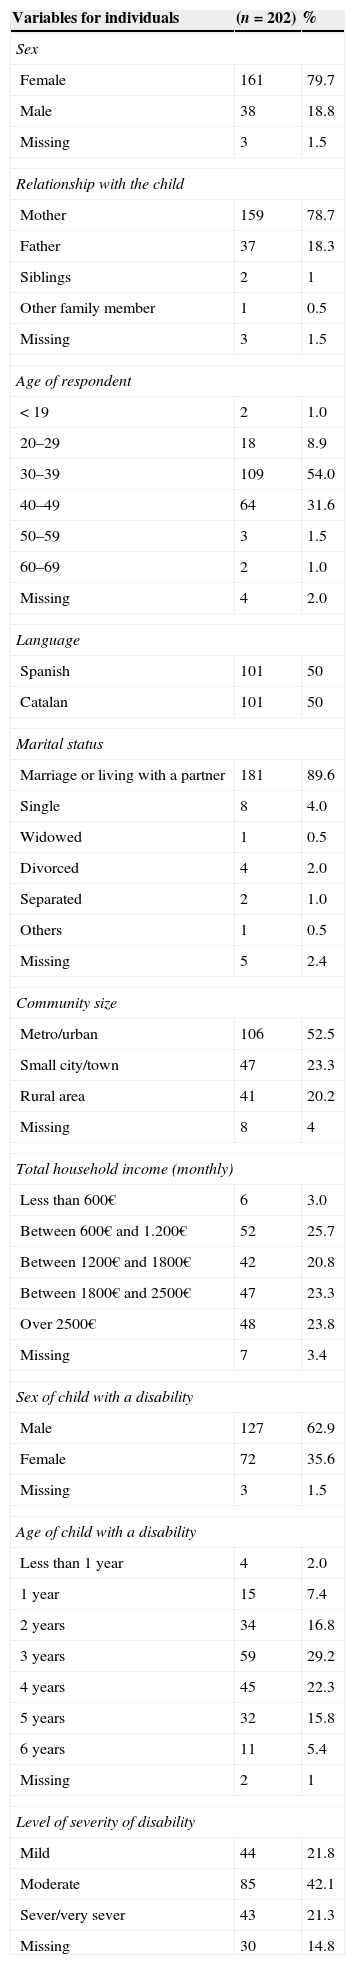
Out of the total number of participants, 79.7% were women. As regards the relation to the child, 78.7% were mothers and 18.3% were fathers. 54% of participants were 30–39 years old, and 31.6% were 40–49. The language used to answer the scales was 50% in Catalan, and 50% in Spanish. As for marital status, 89.6% were married or lived with their partner. As regards family characteristics, a little over half the sample (52.5%) lived in urban areas. Regarding family size, 43.5% consisted of 4 people and 35.1% included 3 individuals.
As for the families’ average monthly income, 25.7% had a net monthly income of 600–1200€, 20.8% of 1200–1800€, whereas 23.3% had an income of 1800–2500€, and 23.8% over 2500€. As can be seen, the sample's incomes are proportionally distributed among the four categories.
Regarding the characteristics of the children with developmental disability, 62.9% were boys. The age range was 0–6 years old, where the most common were 3- and 4-year-olds (29.2% and 22.3%, respectively). As for the degree of disability presented by the children, 42% had mild intellectual disability, 21.8% moderate, and 21.3% severe. Table 1 presents, in more detail, demographic information.
Participant family demographics.
| Variables for individuals | (n=202) | % |
|---|---|---|
| Sex | ||
| Female | 161 | 79.7 |
| Male | 38 | 18.8 |
| Missing | 3 | 1.5 |
| Relationship with the child | ||
| Mother | 159 | 78.7 |
| Father | 37 | 18.3 |
| Siblings | 2 | 1 |
| Other family member | 1 | 0.5 |
| Missing | 3 | 1.5 |
| Age of respondent | ||
| < 19 | 2 | 1.0 |
| 20–29 | 18 | 8.9 |
| 30–39 | 109 | 54.0 |
| 40–49 | 64 | 31.6 |
| 50–59 | 3 | 1.5 |
| 60–69 | 2 | 1.0 |
| Missing | 4 | 2.0 |
| Language | ||
| Spanish | 101 | 50 |
| Catalan | 101 | 50 |
| Marital status | ||
| Marriage or living with a partner | 181 | 89.6 |
| Single | 8 | 4.0 |
| Widowed | 1 | 0.5 |
| Divorced | 4 | 2.0 |
| Separated | 2 | 1.0 |
| Others | 1 | 0.5 |
| Missing | 5 | 2.4 |
| Community size | ||
| Metro/urban | 106 | 52.5 |
| Small city/town | 47 | 23.3 |
| Rural area | 41 | 20.2 |
| Missing | 8 | 4 |
| Total household income (monthly) | ||
| Less than 600€ | 6 | 3.0 |
| Between 600€ and 1.200€ | 52 | 25.7 |
| Between 1200€ and 1800€ | 42 | 20.8 |
| Between 1800€ and 2500€ | 47 | 23.3 |
| Over 2500€ | 48 | 23.8 |
| Missing | 7 | 3.4 |
| Sex of child with a disability | ||
| Male | 127 | 62.9 |
| Female | 72 | 35.6 |
| Missing | 3 | 1.5 |
| Age of child with a disability | ||
| Less than 1 year | 4 | 2.0 |
| 1 year | 15 | 7.4 |
| 2 years | 34 | 16.8 |
| 3 years | 59 | 29.2 |
| 4 years | 45 | 22.3 |
| 5 years | 32 | 15.8 |
| 6 years | 11 | 5.4 |
| Missing | 2 | 1 |
| Level of severity of disability | ||
| Mild | 44 | 21.8 |
| Moderate | 85 | 42.1 |
| Sever/very sever | 43 | 21.3 |
| Missing | 30 | 14.8 |
The instruments used were the Spanish-validated versions of the Service Inventory (Balcells-Balcells et al., 2011), the Beach Center Family-Professional Partnership Scale (Balcells-Balcells et al., 2011; Summers, Hoffman, Marquis, Turnbull, & Nelson, 2005), and the Beach Center FQoL (Authors Blinded; Hoffman, Marquis, Poston, Summers, & Turnbull, 2006; Park et al., 2003). The three instruments are originally from the University of Kansas Beach Center on Disability.
The Service Inventory was created in 2003 and was designed to find out the degree of adequacy of the support to meet the needs of children with ID and their family. The instrument is divided in two parts. The first one focuses on the supports needed by the child with a disability, and the second one on the supports needed by the family. Each part is made up by a range of aids that both recipients – the children and the family – may need. Whether each individual aid is needed by the person with a disability or by the whole family must be indicated on the questionnaire. Later on, if the respondent indicated a need for a service or support, he/she is asked to rate the degree to which the family or the child are getting the aid through a three-level Likert scale (none, some but not enough, or enough of the services they indicated they needed). The Cronbach's α of the Spanish versions scale is .97 (Balcells-Balcells et al., 2011).
The Beach Center Family-Professional Partnership Scale (Summers et al., 2005) aims to find out the families’ perception with regard to their partnership with the professionals. It consists of 18 items divided into two subscales. The first one approaches the families’ perception regarding the attention the professionals give to the child with disability, and the second one the families’ perception regarding their own partnership with the professional taking care of their child. All the items are defined in two Likert scales (1–5) of importance and satisfaction. The scale has an overall Cronbach's α of .96 in importance answers and .97 in satisfaction (Balcells-Balcells et al., 2011).
The Beach Center on Disability created, in addition, the Beach Center FQoL scale (Hoffman et al., 2006; Park et al., 2003), which consists of 25 items responding to five QoL dimensions of the families of children with intellectual disability (Family Interaction, Parenting, Emotional Well-being, Physical and Material Well-Being, Disability-related Support), all of them validated in previous research. The items in this scale have also been formulated to be answered through a 1–5 Likert scale of importance and satisfaction. The Cronbach's α of the scale is .97 in importance answers and .96 in satisfaction (Balcells-Balcells et al., 2011).
ProcedureTo recruit participants, we informed and requested the collaboration of ACAP (Associació Catalana d’Atenció Precoç – [Catalan Association for Early Intervention]) and APPS (Federació Catalana Pro Persones amb Retard Mental1 – [Catalan Federation for the Mentally Handicapped]). Later on, we requested the collaboration of the 13 centers previously selected based on their size and physical location. At each center, a meeting took place with the team of professionals, and the pack of materials for the family was supplied: (a) a letter of introduction, (b) a document with general information, (c) a questionnaire seeking demographic data, (d) the Service Inventory, (e) the Beach Center Family-Professional Partnership Scale, (f) the Beach Center FQoL Scale, and d) a letter of acknowledgment. Among those materials was also the informed consent form that had to be signed and turned in separately (from the instruments) in order to guarantee anonymity as much as possible, according to the recommendations of the University Ethics Committee. The professionals handed the materials to the families and they took the materials home to answer them and handed them back in a closed envelope at the centers within a period of 15 days to 3 weeks.
In sum, out of the 250 packs of materials handed out, 202 were handed back. Therefore, an 80.8% return rate was achieved. In 8% of the cases, the scales were applied in an interview format, given that some families considered they were incapable of doing it themselves.
Finally, the characteristics of the indexes generated were studied. All the analyses were carried out with SPSS, version 21.
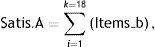
Operational definition of new indexes: supports Adequacy, Family-Professional Partnership and Family Quality of Life ScoresIn the case of the Service Inventory, two indexes were created, one for each part of the instrument. The first part (which we named part A) is intended to ask about the supports needed and received by the handicapped child, and the second one (part B) deals with the resources needed and received by the families. Given that all the indicators, both in part A and B, were evaluated in two different ways (according to whether the support is needed (Supp.Inve) and the degree to which it is received (Satis)), the solutions adopted for this instrument comprise the summations of the resources the families think their children need. The global perception of supports needed and received by the handicapped child is the sum of 18 items in part A. Highs values are associated with high level of needs.
and the degree to which they are received is estimated by the sum of the 18 items of part B as follows:
For the second part, the proposal is the same but applied to the items regarding the supports the families need and receive, and for this case with 15 items.
and
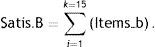
Finally, these summations were combined through a ratio estimating the fit between what is received and the user's satisfaction for each part of the questionnaire (Adeq.InveA and Adeq.InveB):
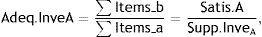
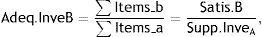
As a result, the Adeq.InveA and Adeq.InveB indexes report on the families’ satisfaction with the resources received and needed by the child in the first case, and with those received and needed by the family in the second. If Adeq.InveA and Adeq.InveB are close to 1, exist excellent fit between the perceived needed and the satisfaction with the resources received. If any of both indexes are higher than 1, the perception of satisfaction is high in relation with the needed perceived. Finally, if the index Adeq.InveA or Adeq.InveB are inferior to 1, the satisfaction level is poor in relation to perceived needs.
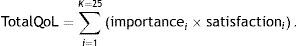
Finally, in order to obtain a global index of importance for each resource evaluated and the satisfaction, we generate another simple mathematical approach for the Beach Center Family-Professional Partnership Scale and the Beach Center FQoL. The solution chosen in both cases was to multiply the summation of every measurement dimension (importance and satisfaction) to estimate a global value for total measure of partnership (TotalPartner) and for whole FQoL (TotalFQoL) as following:
andResults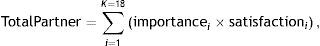
In order to explore the utility of the indexes, the scores of the instruments were analyzed according to the new indexes and their behavior was studied. Specifically, the analyses conducted for each index were the following: descriptive statistics, indexes correlations and reliability estimation, and the possible correlation with a series of external demographic and subject variables in order to estimate concurrent validity.
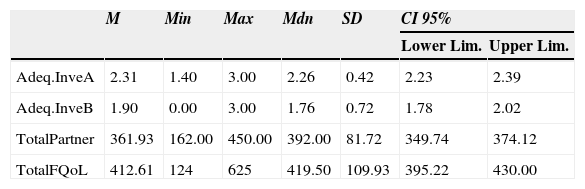
Table 2 shows the descriptive statistics of the four new indexes. The mean of the Adeq.InveA index M=2.31 (SD=0.42) is a little over the midpoint located between the index's minimum and maximum scores. As for the index of the families’ satisfaction regarding the resources directly provided to them (Adeq.InveB), the mean was M=1.90 and SD=0.72. These results show that the participating families are more satisfied with the services received and needed by the child than with those regarding the families (t=46.23, df=200; p<.01). As regards the TotalPartner and TotalFQoL indexes, the mean was notably high in the first case (M=361.93 and SD=81.72) and very high in the second (M=412.61 and SD=109.93) (t=167.12, df=200; p<.001).
Descriptive statistics of the new indexes.
| M | Min | Max | Mdn | SD | CI 95% | ||
|---|---|---|---|---|---|---|---|
| Lower Lim. | Upper Lim. | ||||||
| Adeq.InveA | 2.31 | 1.40 | 3.00 | 2.26 | 0.42 | 2.23 | 2.39 |
| Adeq.InveB | 1.90 | 0.00 | 3.00 | 1.76 | 0.72 | 1.78 | 2.02 |
| TotalPartner | 361.93 | 162.00 | 450.00 | 392.00 | 81.72 | 349.74 | 374.12 |
| TotalFQoL | 412.61 | 124 | 625 | 419.50 | 109.93 | 395.22 | 430.00 |
Note: Adeq.InveA and Adeq.InveB (adequacy supports), TotalPartner (partnership) and TotalFQoL (FQoL).
As for the observed distribution of the new indexes, only TotalFQoL was adjusted to the normal curve (ShapiroWilks=0.988, p=.228), whereas the other three yielded statistically significant results that indicate non-adjustment to normal S-W for Adeq.InveA=.962; p=.005; S-W for Adeq.InveB=.947, p<.001; S-W for TotalPartner S-W=.891, p<.001)
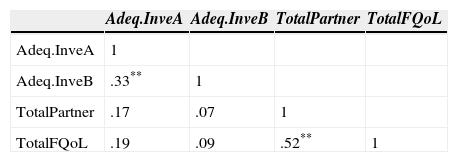
Regarding the correlations between the indexes analyzed, as shown in Table 3, the only ones to obtain statistically significant values were Adeq.InveA and Adeq.InveB with a r=.33 (p=.004), and TotalPartner and TotalFQoL with a r=.52 (p<.001). The results therefore indicate that there is positive correlation between those two pairs of indexes. The correlations estimated between both structures yield moderate determination coefficients (R2=.108 and R2=.271), so that the shared variation, though statistically significant, is moderate from an applied point of view.
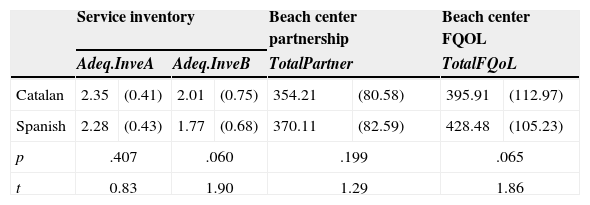
To find out whether there were significant differences between the means of the groups of a set of demographic or subject variables (language, income, and degree of disability) analyzed according to the new indexes, the following tests were applied: Student's t, Anova, and Kruskal–Wallis in case of lack of homogeneity. Variance equality between the groups of variables (assumption of homoscedasticity) was analyzed by means of Leven's test. As can be seen in Table 4, the means obtained for each index analyzed (Adeq.InveA, Adeq.InveB, TotalPartner, and TotalFQoL) in the language variable were not too different for the Spanish and Catalan groups.
Relationship between the language variable and the new indexes.
| Service inventory | Beach center partnership | Beach center FQOL | ||||||
|---|---|---|---|---|---|---|---|---|
| Adeq.InveA | Adeq.InveB | TotalPartner | TotalFQoL | |||||
| Catalan | 2.35 | (0.41) | 2.01 | (0.75) | 354.21 | (80.58) | 395.91 | (112.97) |
| Spanish | 2.28 | (0.43) | 1.77 | (0.68) | 370.11 | (82.59) | 428.48 | (105.23) |
| p | .407 | .060 | .199 | .065 | ||||
| t | 0.83 | 1.90 | 1.29 | 1.86 | ||||
Note: Each box shows the mean of the observed distribution and the standard deviation in brackets.
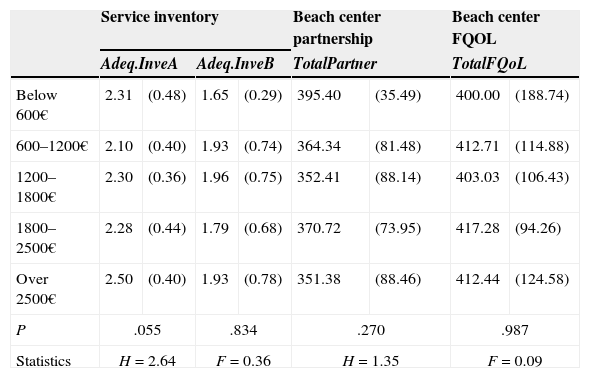
As for the income variable, as can be seen in Table 5, the means obtained for the groups did not yield differences between the groups of income.
Relationship between the income variable and the new indexes.
| Service inventory | Beach center partnership | Beach center FQOL | ||||||
|---|---|---|---|---|---|---|---|---|
| Adeq.InveA | Adeq.InveB | TotalPartner | TotalFQoL | |||||
| Below 600€ | 2.31 | (0.48) | 1.65 | (0.29) | 395.40 | (35.49) | 400.00 | (188.74) |
| 600–1200€ | 2.10 | (0.40) | 1.93 | (0.74) | 364.34 | (81.48) | 412.71 | (114.88) |
| 1200–1800€ | 2.30 | (0.36) | 1.96 | (0.75) | 352.41 | (88.14) | 403.03 | (106.43) |
| 1800–2500€ | 2.28 | (0.44) | 1.79 | (0.68) | 370.72 | (73.95) | 417.28 | (94.26) |
| Over 2500€ | 2.50 | (0.40) | 1.93 | (0.78) | 351.38 | (88.46) | 412.44 | (124.58) |
| P | .055 | .834 | .270 | .987 | ||||
| Statistics | H=2.64 | F=0.36 | H=1.35 | F=0.09 | ||||
Note: Each box shows the mean of the observed distribution and the standard deviation in brackets.
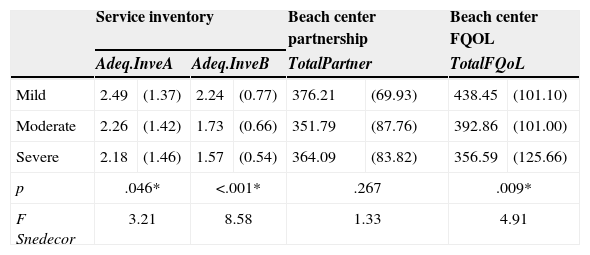
Unlike in the previous cases, the degree of disability variable did obtain different means between the groups that define it (mild, moderate, and severe) in three of the four indexes. Specifically, as shown in Table 6, the Adeq.InveA (F=3.21 and p=.046), the Adeq.InveB (F=8.58, p=.000), and the TotalFQoL indexes (F=4.91, p=.009) yielded significant results.
Relationship between the degree of disability variable and the new indexes.
| Service inventory | Beach center partnership | Beach center FQOL | ||||||
|---|---|---|---|---|---|---|---|---|
| Adeq.InveA | Adeq.InveB | TotalPartner | TotalFQoL | |||||
| Mild | 2.49 | (1.37) | 2.24 | (0.77) | 376.21 | (69.93) | 438.45 | (101.10) |
| Moderate | 2.26 | (1.42) | 1.73 | (0.66) | 351.79 | (87.76) | 392.86 | (101.00) |
| Severe | 2.18 | (1.46) | 1.57 | (0.54) | 364.09 | (83.82) | 356.59 | (125.66) |
| p | .046* | <.001* | .267 | .009* | ||||
| F Snedecor | 3.21 | 8.58 | 1.33 | 4.91 | ||||
Note: Each box shows the mean of the observed distribution and the standard deviation in brackets. *p<.05.
In Fig. 1, we can see the relationship between the degree of disability variable and the new indexes. By way of illustration, the scores of the Adeq.InveA, Adeq.InveB, and TotalFQoL indexes are related to the level of disability of the children with ID. There is a linear relationship between those indexes and the degree of disability variable. Therefore, the lower the degree of severity of disability, the higher families rate the following indexes: Adeq.InveA (satisfaction with the resources the child receives), Adeq.InveB (satisfaction with the resources the family receives), and TotalFQoL (perception of FQoL). Accordingly, the higher the degree of severity of the disability, the lower the scores of the indexes. In the case of the TotalPartner index, the degree of disability is unrelated to the perception the families have of their partnership with the professionals. Once the main effects had been analyzed, the a posteriori contrasts of those statistically significant were estimated by means of Bonferroni's test. The results showed that, in all the variables, the unilateral significance indicates that the mean values of the group of mild are higher than the mean values of the group of moderate, and that the latter present higher average values than the severe. In all the cases p<.001, so it can therefore be said that, in the variables considered, and according to the results of Bonferroni's tests, the mean values of the three groups entail the following order relationship (mild>moderate>severe).

When the scores of a scale, or an index in our case, are strongly related to an external criterion, it means it requires concurrent validity between them. In the case at hand, the results show us that the Adeq.InveA, Adeq.InveB, and TotalFQoL indexes are capable of distinguishing between different groups of people based on the child's degree of disability, given that their scores behave one way or another according to this criterion.
DiscussionThe goal of this study was to assess the feasibility of indexes generated for the instruments Service Inventory, Beach Center Family-Professional Partnership, and Beach Center FQoL that allowed us to evaluate the constructs that are proposed according to one dimension. Results showed that the indexes designed for each instruments were valid to facilitate construct evaluation-support adequacy, partnership, and FQoL-, especially because the Adeq.InveA, Adeq.InveB (Service Inventory), and TotalFQoL (Beach Center of FQOL) indexes have yielded differences between the groups that define the children's degree of disability (mild, moderate, and severe), as stated by the literature. Specifically, according to our results, the lower the degree of severity of the disability, the higher the perception of support adequacy (Adeq.InveA and Adeq.InvB) and FQoL (TotalFQoL).
These results are consistent with the theory proposed by Zuna et al. (2010) which states, on the one hand, that family characteristics and dynamics interact with the individual characteristics of each family member (i.e. the degree of disability), resulting in a specific FQoL; and on the other, that services and supports act as mediating or moderating variables over the effects that the family unit or each individual's characteristics have on FQoL.
As regards the Adeq.InveA and Adeq.InveB indexes, despite the lack of benchmarks directly studying the relationship between support adequacy and the degree of disability, we can turn to the study by Brown et al. (2006). Indeed, in that study, the satisfaction of families with persons with autism regarding the two dimensions of support (support from other people and support from disability-related services) is, once more, lower than that of families with children with Down's syndrome.
The results of the TotalFQoL index are supported by the studies by Hu et al. (2012) and Wang et al. (2006), who found that the severity of the disability was an important FQoL predictor. Similarly, Brown et al. (2006) observed that families with children with autism presented a lower FQoL level than those with children with Down's syndrome, whereas the latter reported less FQoL than those with typically developing children. Contrary to these results, Córdoba, Gómez and Verdugo (2008) reported that the FQoL scores in their study were unrelated to the degree of disability of the person with ID.
As for the relationship between the four indexes (Adeq.InveA, Adeq.InveB, TotalPartner, and TotalFQoL) with the families’ level of income, no link was observed.
Most of the work we knew of carried out in other countries such as the USA, Australia, and China on the relationship between income and FQoL show results opposed to ours. In the vast majority of them, the families’ level of income correlates to FQoL (Davis & Gavidia-Payne, 2009) or is even a strong predictor of it (Hu et al., 2012; Wang et al., 2006). Specifically, the results by Wang et al. (2006) suggest that the families’ level of income is a FQoL predictor for mothers, but not for fathers. The work by Córdoba et al. (2008) in Colombia is the only one that we have knowledge of where FQoL was insensitive to the level of income.
Shapiro et al. (1998) wrote that there are contradictory contributions among the authors and the lack of agreement may be due to the existing differences between the support systems of each country/context. To sum up, these authors speculate that the families’ socioeconomic level is a strong predictor of family results such as parental stress, family functioning, etc., in countries without a more extensive formal support infrastructure, especially to address the needs of persons with ID and their families. That may be a plausible explanation for the lack of a significant relationship between the level of income and FQoL in our research. In fact, in Spain, we have universal assistance and support to handicapped children and their families from the start. Further cross-national research might explore this question by measuring the available infrastructure in samples of families from different societies.
The high level of consistency of the results of our indexes with those from other works confirms that Adeq. InveA, Adeq.InveB, TotalPartner, and TotalFQoL are a good alternative to measure the constructs proposed. Although the indexes yield a thicker approach to the constructs, they seem to be more adequate, in order to conduct more complex analyses, than leaving out one-measurement dimensions such as Summers et al. (2007) did in the case of the Service Inventory, the Beach Center FQoL and the Beach Center Professional Partnership. They are also more adequate than obtaining two independent measures (importance and satisfaction) in the case of the Beach Center FQoL, or the Beach Center Professional Partnership, as done by Balcells-Balcells et al. (2011), Hoffman et al. (2006), Hu et al. (2012) and Wang et al. (2006).
Limitations of the studyOne of the limitations of the study, which tends to be common in this type of research, is the sample's profile (Hoffman et al., 2006; Summers et al., 2005). Since family participation was voluntary, the participants’ profile is not representative of all the families in Spain with persons with ID in terms of gender, age, cultural diversity, etc.
Another limitation that was not solved in this research, among others, is the consideration that the participants’ answers (mother, father, sibling…) respond to the perspective of all the family members. Because of the complexity of this research, we decided not to approach this matter directly, but in the instructions to the respondents we did clarify the importance of answering with the family's collective opinion in mind. In addition, the use of the concept of satisfaction to measure the subjective components of QoL or FQoL entails a few disadvantages and/or drawbacks which have already been pointed out by Schalock and Verdugo (2002) and Zuna et al. (2009). Moreover, despite being a measure that remains stable over time, it is loosely related to the objective measures of QoL and FQoL. In addition, Davis and Gavidia-Payne (2009) and Summers et al. (2007) reported very high FQoL results, which confirm the need to continue to study this construct, to explore it in depth or in combination with other more qualitative measures.
ConclusionsOnce the new indexes—Adeq.InveA, Adeq.InveB, TotalPartner, and TotalFQoL, designed by combining the original measurement dimensions—have been put to the test, we can assert that even though the results obtained with the indexes for each construct are more general, they are more easily manageable and interpretable. Having two scores for one construct helps interpret the data in more depth from a more qualitative point of view; but when the goal is to assess the phenomenon in order to study the relationship with other variables, it becomes necessary to use dimensions that assess that phenomenon with the maximum complexity, as do the indexes designed.
We agree completely with Zuna et al. (2009) on the need to have good measuring tools, and for them to be as faithful as possible to the construct they are assessing. Then, the transition from “measure” to “action” will be easier in order to encourage best practices and further significant changes in the lives of the families of persons with ID and the persons with ID themselves.
Conflict of interestThe authors declare no conflict of interest.
This research has been funded by the Ministry of Education and Science of Spain (BES-2007-14898/project SEJ2006-04773), and would not have been possible without the contribution of the 13 early childhood intervention centers and the families who agreed to be a part of this study and to whom we are deeply grateful for their availability.
