


Aflatoxin M1 (AFM1) is the main monohydroxylated derivative of aflatoxin B1 (AFB1) formed in liver and excreted into milk. Although AFM1 is less toxic than AFB1, it has been classified as a possible human carcinogen, Group 2B agent by International Agency for Research on Cancer (IARC).
ObjectivesThe objectives of this study were (i) to determine the occurrence of AFM1 in the main dairy products consumed in Catalonia region (Spain), and (ii) to assess the exposure of Catalonian population to aflatoxin M1 through deterministic and probabilistic method.
MethodsOccurrence of Aflatoxin M1 (AFM1) was determined in 72 composites of milk, 72 composites of cheese and 72 composites of yoghurt from Catalonia. AFM1 content was analysed using an Enzyme-Linked ImmunoSorbent Assay commercial kit. Three approaches to exposure assessment were conducted: one deterministic method and two probabilistic models with Monte Carlo simulations.
ResultsAFM1 was detected in 94.4% (68/72) of whole UHT milk samples, in 2.8% (2/72) of yoghurt samples and not detected in cheese. The maximum level was detected in one yoghurt sample with 51.58ng/kg, only this sample being over the legal EU limit of 50ng/kg. Milk, cheese and yoghurt mean concentrations were 9.29±2.61, <12.5 and 13.22±4.82ng/kg, respectively.
ConclusionsAccording to these values, it should be expected Catalonian population is not exposed to a significant risk from aflatoxin M1 including average and high consumers.
La aflatoxina M1 (AFM1) es el principal derivado mono-hidroxilado de la aflatoxina B1 (AFB1), formado en el hígado y excretado en la leche. A pesar de que la AFM1 es menos tóxica que la AFB1, ha sido clasificada como un posible carcinógeno para los humanos, en el Grupo 2B por la Agencia Internacional para la Investigación del Cáncer (IARC).
Objetivosi) Determinar la incidencia de AFM1 en los principales productos lácteos consumidos en Cataluña (España), y ii) evaluar la exposición de la población catalana a esta micotoxina.
MétodosLa incidencia de AFM1, se determinó en 72 composites de leche, 72 composites de queso y 72 composites de yogur procedentes de Cataluña. La concentración de AFM1 se analizó con un kit comercial de Ensayo por Inmunoabsorción Ligado a Enzimas (ELISA). En la evaluación de la exposición, se llevaron a cabo tres aproximaciones: un método determínistico y dos modelos probabilísticos mediante simulación por el método Monte Carlo.
ResultadosFinalmente, se detectó en el 94,4% (68/72) de las muestras de leche, en el 2,8 % (2/72) de las muestras de yogur, y no se detectó en las muestras de queso. Las concentraciones medias de leche, queso y yogur fueron 9,29±2,61, <12,5 and 13,22±4,82ng/kg, respectivamente.
ConclusionesSegún estos valores, no se debería esperar que la población catalana esté expuesta a niveles significativos de riesgo derivados de AFM1, incluyendo grandes consumidores.
Aflatoxins are a group of secondary metabolites produced by moulds such as Aspergillus flavus, A. parasiticus and the rare A. nomius.25 Aflatoxin M1 (AFM1) is the main monohydroxylated derivative of aflatoxin B1 (AFB1) formed in liver by means of cytochrome p450-associated enzymes. Mammals that ingest AFB1 contaminated diets excrete amounts of the principal 4-hydroxylated metabolite AFM1 into milk.23 Results of studies on heat processing and storage at low temperature of dairy products affecting the amount of AFM1 indicate that such processes do not cause an appreciable change in the amount of AFM1 in these products. Manufacture of fermented dairy products, concentration and drying of milk do not affect AFM1 recovery; however manufacture of cheese can be an enrichment factor.15,28
Aflatoxins are highly toxic, mutagenic, teratogenic and carcinogenic. Although AFM1 is less toxic than AFB1, it has been classified as a possible human carcinogen, Group 2B agent by International Agency for Research on Cancer (IARC).12 The European Commission has determined the legal limit for AFM1 in raw milk, treated milk and dairy products at 50ng/kg, except for infant formulae, infant milk and special food products, which should be under 25ng/kg.7
Occurrence of aflatoxin M1 in milk and cheese samples from Spanish market has been previously reported in several studies; however, exposure assessment of Catalonian population to this contaminant had not been performed until now.1–3,5,20,24
The current exposure assessment schemes, based on the combination of the mycotoxin occurrence data with dietary intake data of these products, are largely deterministic and uncertainty and/or variability issues are accounted for by means of cautionary measures, which are implicitly embedded in calculation schemes and rules.29 Due to the difficulties of estimating exposure from punctual data, several techniques like probabilistic modelling have been developed to overcome the sporadic nature of consumption and variability in contamination levels. Probabilistic modelling achieved through Monte Carlo simulations accounts for every possible value that each variable could take and weighs each of them by its probability of occurrence.4 Structure of a probabilistic model allows taking the variability of input data into account, which provides more realistic results than those produced by simple deterministic scenarios.30
Risk characterization is the estimation of the severity and probable occurrence or absence of known and potential adverse health effects on an exposed population.17 Evaluation of toxicological data carried out by Joint Expert Committee on Food Additives (JECFA) results commonly in the estimation of a tolerable daily intake (TDI). This hazard assessment approach does not apply for toxins where carcinogenicity is the basis for concern, as is the case with aflatoxins. In the risk management of genotoxic carcinogens, no threshold is presumed and it is recommended that levels of such substances should be as low as technologically feasible or, as JECFA recommends, as low as reasonably achievable (ALARA).6,16 Despite international expert committees8,14,15,27 not specifying a numerical TDI for aflatoxins, it was established that a level of aflatoxins <1ng/kgbw/day does not contribute to the risk of liver cancer. This value was previously used as a TDI by Leblanc et al.19 in Total Diet Study of French population.
The objectives of this study were (i) to determine the occurrence of AFM1 in the main dairy products consumed in Catalonia, and (ii) to assess the exposure of Catalonian population to aflatoxin M1 through deterministic and probabilistic method.
Material and methodsSamplesThe main dairy products consumed in Spain are milk, cheese and yoghurt .21 During the months of June and July 2008, 211 whole UHT milk samples, 216 cheese samples and 202 natural yoghurt samples were obtained in six hypermarkets and supermarkets from 12 main cities (Tortosa, Tarragona, Reus, Vilanova i la Geltrú, l’Hospitalet de Llobregat, Barcelona, Terrassa, Sabadell, Mataró, Girona, Manresa and Lleida) of Catalonia, Spain, representative of 72% of the population. From each supermarket or hypermarket, three samples (if present) of each product were randomly taken. The level of AFM1 was determined in a total of 72 composite samples obtained by pooling the three items taken from each store if available (12 cities×6 stores/city=72samples/category). However, in some cases, three items were not available in the same store. Cheese composites were formed with grated, fresh and semi-dried cheese samples. Cheese was made with different types of milk (cow, sheep, goat or mixtures of these species). In total, 36 milk brands, 70 cheese brands and 21 yoghurt brands were purchased, which can be considered the majority of market share in Catalonia of these products, as well as in the rest of the Spanish market. The samples were transported and stored under suitable conditions until analysis.
Chemical analysisAFM1 was determined in each composite sample by competitive ELISA method RIDASCREEN® Aflatoxin M1 30/15 no. R1111 (Ridascreen®, R-Biopharm AG, Darmstadt, Germany), according to the procedure described by R-Biopharm GmbH with minor modifications.
Samples preparation for analysisMilk samples were skimmed following the test procedure and used directly in the test. Concerning the solid samples, the first step was slightly modified in order to improve the limit of detection (LOD). Ten grams of triturated and homogenised composite samples of cheese or yoghurt was weighed and extracted with 40mL dichloromethane by shaking for 15min on a blender. The following steps were done as suggested by RIDASCREEN instructions.
ELISA test procedureA sufficient number of microtiter wells were inserted into the microwell holder for all standards and samples. One hundred microliters of standard solution and prepared samples were added in separate wells and incubated for 60min at room temperature (20°C) in the dark. The liquid was removed from the wells and the microwell holder was tapped upside down vigorously (three times in a row) against absorbent paper to ensure complete removal of liquid from the wells. Then the wells were washed twice with 250μL of distilled water. One hundred microliters of the diluted enzyme conjugate (peroxidase conjugated AFM1) were added and incubated for 60min at room temperature in the dark. The wells were again washed with 250μL of distilled water as described above. In the next stage 50μL of substrate (urea peroxidase) and 50μL of chromogen (tetramethylbenzidine) were added to each well and mixed thoroughly and incubated for 30min at room temperature in the dark. Then 100μL of the stop reagent (1N H2SO4) was added to each well and mixed, and the absorbance was measured at 450nm in an ELISA reader (ELX-800, Bio-Tek Instruments, Winooski, VT, USA).
AFM1 quantificationThe samples were evaluated according to the Rida Soft Win computer program prepared by R-Biopharm. The absorption is inversely proportional to the AFM1 concentration. According to the manufacturer's description, the LOD was 5ng/kg for milk and 25ng/kg for cheese and yoghurt considering the modification on sample preparation.
Dietary intake assessmentThe main problem to assess mycotoxins intake is related to few representative available dietary data regarding food bearing mycotoxins contamination. There are some methods developed to assess dietary intake overall known as market basket, 24-h dietary recall and food record methods, food-frequency methods or dietary history. Food-frequency methods should be chosen because it may be advantageous to sacrifice precise intake measurements in exchange for more crude information related to an extended period of time.31 In this study, dairy food dietary intake was assessed through a specific Food Frequency Questionnaire (FFQ) developed for Catalonian population including those foods typically consumed in the region which may be potentially contaminated with these mycotoxins. According to World Health Organization (WHO) advice, studies to assess dietary intake of chemical contaminants should show the significant intake among standard population, with all population groups that could have different dietary patterns. Therefore, four different population groups were considered for each sex: infants (4–9 years), teenagers (10–19 years), adults (20–65 years) and elders (>65). FFQ consisted of 38 items of specific foods worldwide known to be the most important food contaminated by mycotoxins studied, excluding those foods not consumed in the region. Concerning frequency of consumption, five response options ranging from never to annually were considered. Quantities were assessed by portion size with the aid of a series of colour photograph models. Finally, 70 elders, 720 adults, 236 teenagers and 68 infant parents were interviewed during 2008 in Lleida region (n=1094) by trained interviewers. The individuals were from 89 different localities of Lleida province, either cities or towns, both the rural and urban consumption profiles being represented.
Exposure assessmentThree approaches were conducted to estimate aflatoxin M1 dietary intake. On the one hand, deterministic methods were performed combining normalised milk daily intake (per body weight) with mean concentration of AFM1 in milk as follows: individual AFM1 exposure (ngAFM1/kg body weight/day)=(daily food intake/body weight)×(mean concentration of AFM1 in food), considering only consumer population. Statistics as means, standard deviation and percentiles were applied for age and sex groups. On the other hand, two probabilistic models were designed to run exposure simulations using our experimental data through the Monte Carlo method. Probabilistic models were built under the principles of the NonParametric–NonParametric (NP–NP) method and the MixedParametric–Parametric method (MP–P) proposed by Gauchi et al.9 with several modifications. Finally, the bootstrap confidence intervals of the exposure simulation outputs obtained through the simulation methods were estimated.
- •
The NP–NP method is proposed as a natural method of exposure assessment when consumption and contamination data are available. It is a completely nonparametric method where each normalised consumption profile of the survey is taken into account and consumed food is attributed a value of contamination randomly drawn from the available contamination data.9 Left censored contamination data was replaced by 0.5×LOD and 2000 iterations were conducted with Microsoft Office Excel 2003®.
- •
NP methods could lead to less reliable estimation of high percentiles limited to the available data. Therefore, it is recommended to use two methods, which validate each other, for a more reliable estimation of that high exposure estimates. Thus, after checking the histograms, we selected a second probabilistic method, essentially parametric for consumption and contamination (P–P method). The model was built following the steps described below.
- ○
Kolmogorov–Smirnov statistic was used in Goodness-of-Fit test to select the best distributions among weibull, chi-square, lognormal and gamma (Software: Statgraphics Plus 5.1®). As a result, normalised consumption and contamination datasets were fitted to distribution GAMMA.
- ○
Parameters of the Gamma probability density functions (shape and scale), from consumption and contamination for each age group, were used to generate the simulated exposure datasets. The model was built with Microsoft Office Excel 2003® using the RANDOM and GAMMA.INV functions, considering 2000 iterations.
- ○
- •
Pseudo-parametric bootstrap confidence intervals were estimated for the exposure outputs from NP–NP and P–P method, taking the empirical percentiles 2.5 and 97.5 of the final bootstrap distribution as described by Gauchi et al.9 to the Type 1 Parametric Bootstrap Confidence Intervals.
Results of the occurrence of AFM1 in dairy samples are presented in Table 1.
Occurrence of AFM1 in milk, cheese and yoghurt from Catalonian (Spain) market
AFM1 was detected in 94.4% (68/72) of whole UHT milk samples above the level of detection (5ng/kg) while this mycotoxin was not detected in cheese and only in 2 of 72 samples of yoghurt (LOD=25ng/kg). Despite the high incidence of AFM1 in milk, mean levels were 9.69±2.07ng/kg, far from EU limits (50ng/kg).
Exposure assessment of Catalonian population to AFM1Occurrence of AFM1 in milk data set shows a low percentage of left censored data within milk samples (5.6%). In cases where there are less than 60% of censored values among the data, it is recommended to replace left censored data by the corresponding LOD or LOQ divided by 2.10 On the other hand, cheese and yoghurt contamination data from our study present a large percentage of left censored data (100% and 97.2%, respectively). In these two cases, the use of these estimate values could induce important bias into exposure assessment. Thus, only milk consumption data and AFM1 occurrence in milk data were considered in the exposure assessment under the assumption that those milk samples under LOD were 0.5LOD.
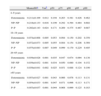
Values of exposition for consumer population through deterministic method are shown in Table 2. Infants were the group with the highest percentage of consumers (94.1%) while adults were the group with the lowest percentage of consumers (55.4%). Adults (20–65) was the age group with the lowest milk consumption and infants (4–9) was the group with the highest milk consumption. Considering our results infants was the main risk group exposed to aflatoxin M1, with statistically significant differences between sex (LSD test, p<0.05), females being the most exposed group. The highest values were found in high percentiles, for example percentile 95 of infants, who showed exposures of 0.358 and 0.434ng/kgbw/day by male and female, respectively. In any case, values were above the safe level of 1ng/kgbw/day.
Exposure assessment of Catalonian population to AFM1 through milk using deterministic method
| No. of consumers | Mean weight (kg) | Mean consumers¿ | High consumers (percentile 95) | |||
| Milk intake (kg/day) | AFM1 intake (ng/kgbw/day) | Milk intake (kg/day) | AFM1 intake (ng/kgbw/day) | |||
| Infant 4–9 | ||||||
| Male | 30 | 27.24 | 0.487±0.298 | 0.182±0.109a | 0.840 | 0.358 |
| Female | 34 | 23.45 | 0.572±0.227 | 0.236±0.103b | 0.840 | 0.434 |
| Teenager 10–19 | ||||||
| Male | 90 | 57.81 | 0.423±0.301 | 0.075±0.063c | 1.120 | 0.175 |
| Female | 119 | 51.30 | 0.390±0.344 | 0.074±0.071c | 1.120 | 0.222 |
| Adult 20–65 | ||||||
| Male | 201 | 80.83 | 0.305±0.216 | 0.036±0.027cd | 0.750 | 0.081 |
| Female | 198 | 66.42 | 0.305±0.206 | 0.043±0.029cd | 0.700 | 0.100 |
| Elderly >65 | ||||||
| Male | 24 | 74.46 | 0.355±0.161 | 0.046±0.024d | 0.560 | 0.079 |
| Female | 25 | 72.20 | 0.457±0.188 | 0.060±0.028d | 0.784 | 0.121 |
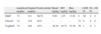
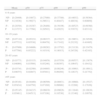
Monte Carlo simulations, either nonparametric or parametric, showed similar values as those results obtained through deterministic model (Table 3). Therefore, infant consumers, especially high consumers, were the most exposed group to AFM1.
Values of AFM1 intake by Catalonian population estimated through the deterministic and probabilistic method
| Mean±SDa | Varb | p50 | p75 | p90 | p95 | p99 | |
| 4–9 years | |||||||
| Deterministic | 0.211±0.109 | 0.012 | 0.194 | 0.263 | 0.381 | 0.426 | 0.462 |
| NP–NP | 0.218±0.133 | 0.016 | 0.199 | 0.292 | 0.394 | 0.484 | 0.602 |
| P–P | 0.202±0.143 | 0.024 | 0.171 | 0.269 | 0.375 | 0.467 | 0.687 |
| 10–19 years | |||||||
| Deterministic | 0.074±0.068 | 0.005 | 0.053 | 0.094 | 0.150 | 0.202 | 0.359 |
| NP–NP | 0.072±0.073 | 0.005 | 0.055 | 0.084 | 0.154 | 0.208 | 0.369 |
| P–P | 0.075±0.083 | 0.007 | 0.049 | 0.099 | 0.170 | 0.229 | 0.405 |
| 20–65 years | |||||||
| Deterministic | 0.039±0.028 | 0.001 | 0.035 | 0.047 | 0.074 | 0.094 | 0.138 |
| NP–NP | 0.039±0.032 | 0.001 | 0.034 | 0.050 | 0.080 | 0.104 | 0.152 |
| P–P | 0.039±0.041 | 0.002 | 0.025 | 0.051 | 0.088 | 0.124 | 0.199 |
| >65 years | |||||||
| Deterministic | 0.053±0.027 | 0.001 | 0.043 | 0.066 | 0.076 | 0.113 | 0.131 |
| NP–NP | 0.054±0.033 | 0.001 | 0.047 | 0.071 | 0.096 | 0.113 | 0.171 |
| P–P | 0.053±0.037 | 0.001 | 0.044 | 0.068 | 0.099 | 0.125 | 0.183 |
NP–NP: NonParametric–NonParametric method; P–P: Parametric–Parametric method.
The most exposed group (infant, percentile 99) showed the highest variability of the results, the values obtained by the probabilistic method being higher than those obtained through the deterministic method. This difference was less important in the other groups, probably due to the low variability in the milk intake patterns.
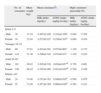
Pseudo-parametric bootstrap confidence intervals for the mean, percentile 50, 75, 90, 95 and 99 from NP–NP and P–P method are shown in Table 4.
Confidence intervals obtained from the results of the NP–NP and P–P method
| Mean | p50 | p75 | p90 | p95 | p99 | |
| 4–9 years | ||||||
| NP–NP | [0.20498; 0.21636] | [0.18672; 0.19927] | [0.27680; 0.29631] | [0.37388; 0.40447] | [0.44032; 0.48034] | [0.56364; 0.60809] |
| P–P | [0.20394; 0.21737] | [0.16387; 0.17768] | [0.26468; 0.28503] | [0.39196; 0.42925] | [0.48525; 0.53973] | [0.69360; 0.83311] |
| 10–19 years | ||||||
| NP–NP | [0.07110; 0.07733] | [0.05232; 0.05530] | [0.08337; 0.09479] | [0.15227; 0.17142] | [0.19851; 0.23232] | [0.34549; 0.41695] |
| P–P | [0.07068; 0.07768] | [0.04666; 0.05222] | [0.09282; 0.10319] | [0.15792; 0.18015] | [0.21120; 0.24529] | [0.33479; 0.42163] |
| 20–65 years | ||||||
| NP–NP | [0.03771; 0.04069] | [0.03335; 0.03569] | [0.04858; 0.05246] | [0.07559; 0.08397] | [0.09557; 0.10647] | [0.13879; 0.16432] |
| P–P | [0.03741; 0.04075] | [0.02560; 0.02847] | [0.04895; 0.05441] | [0.08246; 0.09294] | [0.10903; 0.12617] | [0.16912; 0.21752] |
| >65 years | ||||||
| NP–NP | [0.05161; 0.05434] | [0.04469; 0.04750] | [0.06599; 0.07169] | [0.08931; 0.09686] | [0.10668; 0.12288] | [0.15527; 0.17836] |
| P–P | [0.05145; 0.05481] | [0.04215; 0.04513] | [0.06630; 0.07198] | [0.09626; 0.10530] | [0.11840; 0.13340] | [0.16836; 0.19979] |
NP–NP: NonParametric–NonParametric simulation method; P–P: Parametric–Parametric simulation method.
In both cases, for NP–NP and P–P method, confidence intervals increased in the high percentiles, becoming evident in the low accuracy of these estimates. In some cases, confidence intervals did not contain the related estimate, as shown in infants (means and high percentiles).
DiscussionAn early study carried out in Spain showed low incidence of contamination of commercial milk by AFM1 with 7.3% of positive samples (LOD=20ng/kg) and a range of 20–40ng/kg3; however, a subsequent study reported higher contamination levels with a contamination range of 20–100ng/kg.2 Later studies found that 45.9–86% of samples were below 10ng/kg, and 4–6.6% among 10–20ng/kg. AFM1 mean levels reported were 10.5 and 17.3ng/kg in UHT milk samples, in the line of our study.5,13,24 The Commission of the European Union (1989–1995) also provided a Scientific Cooperation (SCOOP) report, containing data for milk analysed between 1989 and 1995 in nine Member States. 3338 out of the 8791 samples (38%) contained concentrations of aflatoxin M1 below the LOQ/LOD; 1017 samples (12%) contained concentrations below 50ng/kg; six samples (0.07%) contained 50–100ng/kg; and three samples (0.03%) contained >100ng/kg. For the European regional diet calculated weighted mean was 23ng/kg.15 Regarding cheese samples, although we did not find detectable levels, previous studies found mean levels of 105.3, 13.8 and 42.6ng/kg in ripened, semi-ripened and fresh cheese, respectively; however, other studies did not detect this mycotoxin in “manchego” and blue cheese samples from Spain.1,20 Despite the low incidence of AFM1 in yoghurt (2/72), these positive samples showed high levels of the toxin with a mean and maximum level of 38.34±18.73 and 51.58ng/kg, respectively. Concerning yoghurt, no studies carried out in Spain were found; however, a study conducted in Portugal showed levels of 43–45 and 19–68ng/kg in natural yoghurt and yoghurt with strawberries, respectively, similar to our range.22 Although our study was conducted in Catalonia, the main brands marketed in Spain have been purchased and analysed; therefore, results from our study could be extrapolated to the Spanish market.
Consumption of AFM1 was determined by JECFA in five regional diets. European regional consumption of milk and milk products was 340g/person/day and AFM1 intake was 6.8ng/day in the European diet.15 Similarly, in our study it ranged from 2.9 to 6.1ng/person/day. The French Total Diet Study showed an estimated average intake of AFM1 in the French population of 0.09 and 0.22ng/kgbw/day for adults and children mean consumers, respectively. Despite the highest values of 0.21 and 0.55ng/kgbw/day being reported for adults and children high consumers, all of them were far from the safe level of 1ng/kgbw/day. All ranges were very close to our results.19
Despite the exposure assessment methods being mainly deterministic, probabilistic models have been proposed to provide the most realistic description of exposure. This methodology permits more accurate approximation to risk characterization, considering associated variability and uncertainties. Many sources of uncertainty should be considered as well as left and right censored data of contamination or right censored data of dietary intake estimation that provide important bias to the exposure assessment process. Probabilistic methods applied to mycotoxin exposure assessment were previously reported in several cases. For example, Humphreys et al.11 performed a quantitative risk assessment for fumonisins in USA corn and Leblanc et al.18 simulated the exposure to DON of consumers of both organic and conventional wheat in cereal-based products, based on a probabilistic method. Previously cited quantitative assessment of exposure to ochratoxin A was conducted by Gauchi et al.9 providing useful methodology to build quantitative models, with application for mycotoxins and other contaminants.
To sum up, the occurrence of AFM1 in cheese and yoghurt from Catalonian market is very low. Although high occurrence in milk was observed, the contamination levels were very low, far from the safe limit established by EU. Moreover, results from all studied scenarios suggest that AFM1 exposure should not be expected to contribute to the risk of liver cancer among Catalonian population, including high consumers. Considering that the latest nutritional study conducted in Catalonia reported that 17.4% of population surveyed showed a risk calcium dietary intake, with calcium intakes below 2/3 of the Recommended Daily Intake (RDI),26 an increase in milk and dairy products consumption should be expected at long term to supply suitable amounts of calcium; thus exposure assessment to this contaminant should be considered.
FundingThe authors would like to acknowledge Exposure Assessment of Spanish Population to Fusarium Toxins Project, National Plan of Spanish Government (AGL2008-05030-C02-01), Catalonian Food Safety Agency of ‘Generalitat de Catalunya’ Health Department and University of Lleida for their financial support.
The authors would like to acknowledge Dr. J. Gómez and Dr. J.M. Llobet for their technical support.

