


To establish a renal tubular uptake rate (RTUR) model based on renal dynamic imaging (RDI) for detecting early tubular injury and to explore its clinical application value.
Materials and methodsRDI data collected from August 2020 to June 2025 were analyzed. A total of 292 eligible cases (441 kidneys) were included. Participants were categorized into: - Control group: 56 cases (112 kidneys) - Renal insufficiency group: 93 cases (186 kidneys) - Fully compensated group: 62 cases (62 kidneys) - Partially compensated group: 35 cases (35 kidneys) - Decompensated group: 46 cases (46 kidneys).
RTUR calculation formulaRTUR = (Ascent slope of renal scintigraphy/Total injected radioactive drug activity) × 105 × 100%.
Analysis contentDistribution of RTUR values across five groups; correlation between GFR and RTUR in 441 kidneys. Differences in RTUR between the control group and other four groups; diagnostic efficacy and clinical value of RTUR.
ResultsCompared with the control group, significant differences in RTUR were observed in the renal insufficiency group, fully compensated group, and decompensated group (P < .01). GFR in 441 kidneys showed a strong positive correlation with RTUR (r = 0.739, P < .001). ROC analysis indicated that RTUR ≤ 5.225% identified renal insufficiency (sensitivity 77.7%, specificity 70.4%), while RTUR ≥ 9.135% diagnosed complete renal compensation with 82.3% sensitivity.
ConclusionThe RTUR model enables stable quantitative assessment of renal tubular reabsorption rate, facilitating diagnosis of renal insufficiency and complete renal compensation. It holds promise as a novel quantitative indicator for evaluating tubular function. Renal GFR exhibits a strong correlation with RTUR.
Establecer un modelo de tasa de absorción tubular renal (RTUR) basado en imágenes dinámicas renales (RDI) para detectar lesiones tubulares tempranas y explorar su valor de aplicación clínica.
Materiales y métodosSe analizaron los datos de RDI recopilados entre agosto de 2020 y junio de 2025. Se incluyeron un total de 292 casos elegibles (441 riñones). Los participantes se clasificaron en: - Grupo de control: 56 casos (112 riñones) - Grupo con insuficiencia renal: 93 casos (186 riñones) - Grupo totalmente compensado: 62 casos (62 riñones) - Grupo parcialmente compensado: 35 casos (35 riñones) - Grupo descompensado: 46 casos (46 riñones).
Fórmula de cálculo de la RTURRTUR = (pendiente ascendente de la gammagrafía renal/actividad total del fármaco radiactivo inyectado) × 105 × 100%.
Contenido del análisisDistribución de los valores de RTUR en los cinco grupos; correlación entre la TFG y la RTUR en 441 riñones. Diferencias en la RTUR entre el grupo de control y los otros cuatro grupos; eficacia diagnóstica y valor clínico de la RTUR.
ResultadosEn comparación con el grupo de control, se observaron diferencias significativas en el RTUR en el grupo con insuficiencia renal, el grupo con compensación completa y el grupo descompensado (P < ,01). La TFG en 441 riñones mostró una fuerte correlación positiva con el RTUR (r = 0,739, P < ,001). El análisis ROC indicó que una RTUR ≤ 5,225% identificaba la insuficiencia renal (sensibilidad del 77,7%, especificidad del 70,4%), mientras que una RTUR ≥ 9,135% diagnosticaba una compensación renal completa con una sensibilidad del 82,3%.
ConclusiónEl modelo RTUR permite una evaluación cuantitativa estable de la tasa de reabsorción tubular renal, lo que facilita el diagnóstico de insuficiencia renal y compensación renal completa. Es prometedor como nuevo indicador cuantitativo para evaluar la función tubular. La TFG renal muestra una fuerte correlación con la RTUR.
The renal tubules serve as the core structures for reabsorption, secretion, and acid-base balance regulation within the kidneys. They are supplied by the postglomerular capillary network. Due to the substantial filtration of water from the glomerular capillary network, the colloid osmotic pressure within the postglomerular capillaries is exceptionally high, and blood flow is slow. The proximal tubules, the straight segments of the distal tubules, and the thin segments of the tubules are distributed within the renal medulla. The renal medullary blood flow is relatively low, the renal tubules serve as the core structures for reabsorption, secretion, and acid-base balance regulation within the kidneys. They are supplied by the postglomerular capillary network. Due to the substantial filtration of water from the glomerular capillary network, the colloid osmotic pressure within the postglomerular capillaries is exceptionally high, and blood flow is slow. The proximal tubules, the straight segments of the distal tubules, and the thin segments of the tubules are distributed within the renal medulla. The renal medullary blood flow is relatively low.1–3 Currently, clinical assessment of tubular injury primarily relies on tests such as urine specific gravity, urinary α- and β-microglobulin, urinary retinol-binding protein, serum electrolytes, and acid-base balance.4–7 These tests lack specificity and exhibit low positive rates. Additionally, renal ultrasound can detect tubular atrophy and calcification, but by this stage, tubular lesions are already severe. Achieving early detection of tubular injury and quantitative assessment of tubular function would significantly enhance early diagnosis of kidney disease, post-treatment evaluation, and understanding of its pathogenesis.
[99mTc]Tc-DTPA is a radiopharmaceutical that undergoes glomerular filtration without tubular reabsorption. The [99mTc]Tc-DTPA-RDI examination simultaneously provides information reflecting renal blood supply, renal parenchymal function, and upper urinary tract patency. Through SPECT dynamic acquisition technology, time-dependent radioactivity curves (TAC) can be obtained, including renal perfusion curves and renal cortical function curves. Analysis of the RDI renal cortical function curve (scintigram): Segment b represents a gradually ascending curve following segment a, typically peaking at 2−4 min. The slope and height of this segment reflect the rate and extent of radiopharmaceutical uptake by renal tubular epithelial cells from the postglomerular capillary bed, correlating with tubular secretory function. Due to the different radioactivity levels of [99mTc]Tc-DTPA injected during each RDI examination, the height and slope of segment b may fluctuate. To eliminate interference from radiopharmaceutical activity, this study innovatively proposes a renal tubular uptake rate calculation model and excludes cases with unsuccessful pellet injection, providing a novel approach for quantitative assessment of renal tubular function and early diagnosis of kidney diseases.
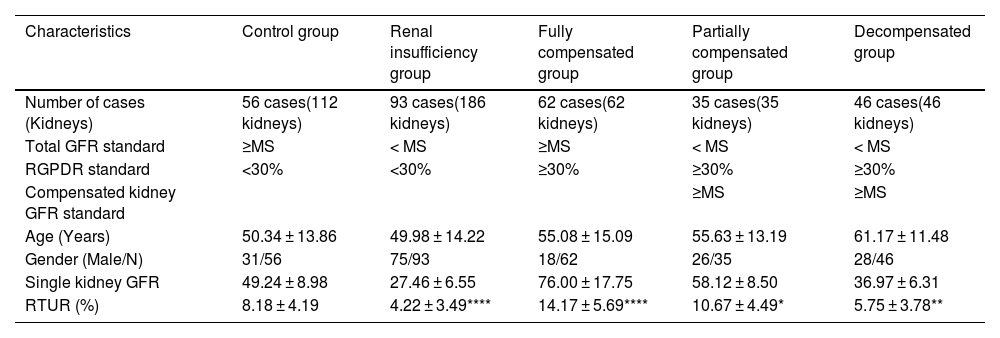
Materials and methodsStudy populationRetrospective data were collected from patients undergoing renal dynamic imaging at the Department of Nuclear Medicine, The First Affiliated Hospital of Anhui University of Science and Technology between August 2020 and June 2025. This study was approved by the hospital's ethics committee (Approval No.: 2024-KY-BY013). The research process strictly adhered to the ethical principles of the Declaration of Helsinki, exempting the informed consent procedure. Inclusion Criteria: Patients aged ≥ 18 years with complete clinical records. Exclusion Criteria: Cases of failed “bullet-style” injection (manifested as ≥15-second peak delay in renal perfusion curve, ≥10-second peak delay in aortic perfusion curve, or extravasation signs such as ‘sawtooth’ or “double-peak” patterns). Group Definition: Subjects were categorized into a control group (56 patients, 112 kidneys) and an experimental group (comprising 4 subgroups, 236 patients, 329 kidneys) based on the Minimum Standard for normal values (MS) of total renal glomerular filtration rate (GFR) or segmental GFR for the same body surface area in the SPECT database, and the Renal Graph Peak difference Rate (RGPDR). 329 kidneys (see Table 1).
Group definitions and baseline characteristics, distribution of RTUR across groups, and differences in RTUR between other groups compared to the control group.
| Characteristics | Control group | Renal insufficiency group | Fully compensated group | Partially compensated group | Decompensated group |
|---|---|---|---|---|---|
| Number of cases (Kidneys) | 56 cases(112 kidneys) | 93 cases(186 kidneys) | 62 cases(62 kidneys) | 35 cases(35 kidneys) | 46 cases(46 kidneys) |
| Total GFR standard | ≥MS | < MS | ≥MS | < MS | < MS |
| RGPDR standard | <30% | <30% | ≥30% | ≥30% | ≥30% |
| Compensated kidney GFR standard | ≥MS | ≥MS | |||
| Age (Years) | 50.34 ± 13.86 | 49.98 ± 14.22 | 55.08 ± 15.09 | 55.63 ± 13.19 | 61.17 ± 11.48 |
| Gender (Male/N) | 31/56 | 75/93 | 18/62 | 26/35 | 28/46 |
| Single kidney GFR | 49.24 ± 8.98 | 27.46 ± 6.55 | 76.00 ± 17.75 | 58.12 ± 8.50 | 36.97 ± 6.31 |
| RTUR (%) | 8.18 ± 4.19 | 4.22 ± 3.49**** | 14.17 ± 5.69**** | 10.67 ± 4.49* | 5.75 ± 3.78** |
Note:
MS: Minimum standard for normal total GFR or segmental renal GFR within the same body surface area in the SPECT database.
RGPDR = (Ratio of peak difference to average peak value in bilateral renal images of the same patient) × 100%.
GFR unit: ML/min/1.73 m².
Compared with the control group, **P < .01.
Thirty minutes prior to examination, patients were instructed to drink 500 ml of water and empty their bladders. Height and weight were then recorded. The specific procedure was as follows: (1) First, baseline counts of the radiotracer in the syringe were acquired for 30 s using a 128 × 128 matrix; (2) The patient was positioned supine on the examination table. A “bullet injection” of [99mTc]Tc-DTPA (185–740 MBq) was administered via the antecubital vein. This radiotracer [99mTc]Tc-DTPA, not reabsorbed after glomerular filtration, was used to acquire the perfusion phase (2 s/frame × 30 frames) and functional phase (1 min/frame × 25 frames). (3) Finally, the empty needle's radioactivity count is recorded again with a 30-second acquisition time and a 128 × 128 matrix.
Image analysis and parameter calculationPost-processing is performed using specialized nuclear medicine image processing software: ROI technique is applied to delineate the bilateral kidneys and abdominal aorta regions; time-activity curves are generated; renal tubular uptake rate (RTUR) is calculated. The RTUR formula is as follows:
Note:
RHC: Renography peak count rate (k counts/s);
RBC: Renography segment B start count rate (k counts/s);
I0: Pre-injection syringe count rate (k counts/m);
E0: Empty syringe count rate post-injection (k counts/min).
RRT: Renography rise time (s).
Statistical methods dataAnalysis was performed using SPSS 27.0 statistical software. Quantitative data are expressed as mean ± standard deviation (X ± S). Intergroup comparisons employed one-way analysis of variance (ANOVA). Categorical data were expressed as number (percentage) [n(%)], and intergroup comparisons were performed using the chi-square test. Pearson correlation analysis was used to evaluate the correlation between RTUR and GFR. Diagnostic performance was assessed using ROC curve analysis. Two senior nuclear medicine physicians independently evaluated the renal scintigraphy results, with a third senior physician serving as an arbitrator in case of disagreement.
ResultsBaseline characteristics and RTUR distribution across groupsComparisons of age, gender distribution, and RTUR values across groups revealed significant differences in all groups except the partially compensated group (all P < .01). The RTUR rate was significantly lower in the renal insufficiency group than in the control group (4.22% vs 8.18%, P < .01), whereas it was significantly higher in the complete compensation group than in the control group (14.17% vs 8.18%, P < .01). See Tables 2 and 3, Fig. 1.
Correlation analysis between renal GFR and RTUR in 441 cases.
| GFR | RTUR | ||
|---|---|---|---|
| GFR | Spearman correlation | 1 | 0.739** |
| Significance (two-tailed) | 0.001 | ||
| Number | 441 | 441 | |
| RTUR | Spearman correlation | 0.739** | 1 |
| Significance (two-tailed) | 0.001 | ||
| Number | 441 | 441 |
Note: **0.7 ≤ |r| < 1: Strongly correlated. A clear linear relationship exists between variables. At the 0.01 level (two-tailed), the correlation is statistically significant.
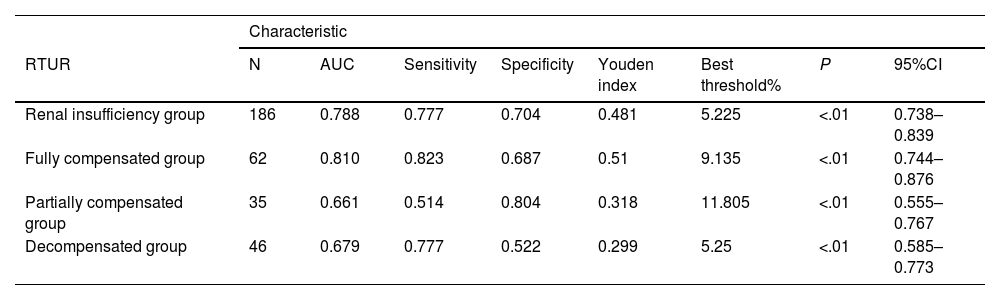
ROC curve analysis of RTUR in other groups compared with the control group.
| Characteristic | ||||||||
|---|---|---|---|---|---|---|---|---|
| RTUR | N | AUC | Sensitivity | Specificity | Youden index | Best threshold% | P | 95%CI |
| Renal insufficiency group | 186 | 0.788 | 0.777 | 0.704 | 0.481 | 5.225 | <.01 | 0.738–0.839 |
| Fully compensated group | 62 | 0.810 | 0.823 | 0.687 | 0.51 | 9.135 | <.01 | 0.744–0.876 |
| Partially compensated group | 35 | 0.661 | 0.514 | 0.804 | 0.318 | 11.805 | <.01 | 0.555–0.767 |
| Decompensated group | 46 | 0.679 | 0.777 | 0.522 | 0.299 | 5.25 | <.01 | 0.585–0.773 |

Clinical methods for assessing renal tubular function are limited. The tracers used in nuclear medicine RDI-ERPF (effective renal plasma flow) measurement are secreted by the renal tubules without being reabsorbed, thus primarily reflecting tubular secretory function. RDI-ERPF measurement plays a crucial role in the early diagnosis of tubular diseases, localization of renal lesions, therapeutic efficacy evaluation, and medical research.8–14 With advances in nuclear medicine technology, the application of additional radiolabeled agents such as [¹²³I]I-OIH, [99mTc]Tc-MAG3, and [99mTc]Tc-EC has expanded RDI-ERPF capabilities beyond ERPF measurement. These agents now enable observation of renal perfusion, calculation of GFR, and demonstrate superior biological characteristics and diagnostic value,8,15–20 providing clinicians with additional diagnostic and evaluative perspectives. This study employed [99mTc]Tc-DTPA-RDI technology to obtain information reflecting renal blood supply, cortical function, and upper urinary tract patency. Simultaneously, it attempted to derive data reflecting tubular uptake function by calculating the slope of segment B in the renogram. To eliminate interference factors such as variations in injected drug radioactivity, a ratio format was innovatively adopted. The RTUR data obtained in this study remained stable within the range of 4.22%–14.17%, with a maximum fluctuation not exceeding 5.69%.
This study found that RTUR in the 441 kidney showed a strong positive correlation with GFR (r = 0.739, P < .001), indicating a close relationship between RTUR and glomerular filtration function. This aligns with renal physiology: Tubular excretory function coordinates and supports glomerular filtration to maintain homeostasis. Notably, the RTUR of the compensating kidney in the complete compensation group was significantly higher than that in the control group, and its GFR was also significantly above normal levels. This suggests that the compensating kidney not only maintains total renal function through “high filtration” but also enhances tubular processing of primary urine via “high reabsorption.” This “dual compensation” mechanism had previously been observed only in animal studies.21 This study confirms it in humans using the RTUR model, providing clinical evidence for research on compensatory mechanisms in unilateral renal injury.
Comparative analysis revealed significant differences in RTUR values between the control group and the renal insufficiency group, fully compensated group, and non-compensated group (P < .01). This indicates that the model RTUR can sensitively detect differences in tubular reabsorption under various pathological conditions. RTUR demonstrates high diagnostic sensitivity for tubular reabsorption, enabling early detection of abnormalities, timely diagnosis, and early intervention to prevent further progression of kidney disease. This enhances our understanding of disease mechanisms and improves the evaluation of treatment efficacy aimed at reducing renal disease progression.
ROC diagnostic performance analysis revealed that RTUR ≤ 5.225% identifies renal insufficiency (sensitivity 77.7%, specificity 70.4%), while RTUR ≥ 9.135% enables early diagnosis of complete renal compensation (sensitivity 82.3%), providing reference for selecting surgical approaches for contralateral kidneys.
The [99mTc]Tc-DTPA-RDI is a widely applicable and practical nuclear medicine technique in clinical practice, offering significant value for clinical decision-making. Renal dynamic imaging technology is safe, non-invasive, low in radiation exposure, free of drug toxicity or side effects, and facilitates follow-up evaluation. This study enhances the diagnostic utility of [99mTc]Tc-DTPA-RDI by obtaining multiple parameters from a single examination. It acquires tubular function parameters without additional burden and enables analysis of the etiology and location of renal tubular impairment by integrating parameters such as segmental tubular uptake rate and GFR. This provides clinicians with a more comprehensive diagnostic perspective and offers a basis and evaluation method for early detection of renal diseases.
Study limitations: This single-center retrospective design included clinical cases without healthy controls and had a small sample size. All data derived from single examinations without validation through repeated testing. Future work requires multicenter prospective cohort validation to establish RTUR thresholds, incorporate parameters like body weight, and refine subgroup analyses. RTUR reflects only tubular uptake function and cannot distinguish between proximal and distal tubular injury sites. Subsequent studies may integrate relevant biomarkers such as urinary NAG (a proximal tubular marker) and urinary α1-microglobulin (a distal tubular marker) to construct a “site-specific” tubular function assessment system, further enhancing diagnostic accuracy.22 Comparative studies could also examine differences in sensitivity, specificity, and other diagnostic characteristics between RTUR and RDI-ERPF in tubular disease.
In summary, this study is the first to obtain quantitative parameters regarding tubular uptake function during [99mTc]Tc-DTPA-RDI examinations using the RTUR model. These parameters exhibit stable distribution, show significant RTUR differences across various disease states, demonstrate good diagnostic sensitivity and specificity, and correlate closely with renal GFR. They provide tubular function information for clinical practice and research without imposing additional burdens. It will play a crucial role in the early diagnosis of renal tubular diseases, localization of renal lesions, therapeutic efficacy assessment, and medical research.8–20
CRediT authorship contribution statementWenhao Liu is responsible for: design, data analysis and collection, writing, translation and review.
Guoling Yao is responsible for: literature guidance, literature review.
Ya Gao, Chongying Wang, is responsible for: data collection, translation and review.
Ethical statementDear revsta Española de Medicina Nuclear eImagen Molecular:
This retrospective study was conducted in accordance with the ethical principles of the Declaration of Helsinki (World Medical Association, 2022 revision) and was approved by the Ethics Committee of The first hospital of anhui university of science & technology (Approval Number: 2024-KY-BY013) prior to the initiation of data collection.
The study involved the retrospective analysis of renal dynamic imaging (RDI) data and clinical records of patients who underwent 99mTc-DTPA RDI examinations at the Department of Nuclear Medicine of the aforementioned hospital between August 2020 and June 2025. All patient data used in this study were fully anonymized: identifiers such as names, identification numbers, contact information, and medical record numbers were permanently removed from the dataset, and only de-identified clinical and imaging parameters (e.g., age, gender, serum creatinine, glomerular filtration rate [GFR], renal tubular uptake rate [RTUR]) were retained for analysis. This anonymization process ensured that the privacy, confidentiality, and rights of the participants were fully protected.
Given the retrospective nature of the study, the use of de-identified data, and the lack of direct interaction with participants, the Ethics Committee explicitly waived the requirement for obtaining written informed consent from the subjects. No additional procedures beyond routine clinical care were performed on the participants, and the study did not pose any potential risks to their physical or psychological well-being.
All authors declare that there are no conflicts of interest (e.g., financial, professional, or personal relationships) that could have influenced the design of the study, the collection, analysis, or interpretation of data, or the writing of the manuscript.
The data used in this study are stored in a password-protected database managed by the Department of Nuclear Medicine of The First Affiliated Hospital of Anhui University of Science and Technology, with access restricted to authorized researchers only, in compliance with the requirements of China’s Medical Data Security Management Measures.
Consent to participateYes.
Consent to publishYes.
FundingHuainan Science and Technology Plan Project (No.2024N013). Anhui Provincial Quality Engineering Project in 2024 (No.2024jyxm0699).
Data availabilityData are available by contacting the author.
There is no conflict of interest in this article.
