This work studies herding behaviour in a small European market, by analysing the stocks that constituted the Portuguese stock PSI-20 index, for the period between 2003 and 2011. The two different approaches used to measure herding intensity led to different results, suggesting that measurements of the herding phenomenon are sensitive to the method used. Consequently, there is a need for further research into the methodology used to test this phenomenon. Additionally, the study analyses the relationship between herd behaviour and investor sentiment, an area that has been little explored. In applying causality tests to the impact of sentiment on herd behaviour, only weak evidence is found that sentiment influences herding.
Este trabajo estudia el efecto rebaño en un mercado europeo de dimensión reducida, analizando los valores que constituyen el índice portugués PSI-20, para el período 2003-2011. Para ello, se consideran dos aproximaciones con objeto de medir la intensidad de este tipo de comportamiento, las cuales arrojan resultados diferentes, de lo que se deduce que el fenómeno manada es sensible al método de medición utilizado. Por consiguiente, existe la necesidad de promover investigaciones relacionadas con la metodología de medición asociada a este fenómeno. Este trabajo analiza, además, la relación existente entre el comportamiento de rebaño y el sentimiento del inversor, la cual no ha sido hasta la fecha suficientemente estudiada en profundidad. Aplicando tests de causalidad para evaluar el impacto del sentimiento del inversor sobre su comportamiento gregario, solo encontramos evidencias débiles de la influencia del primero sobre el segundo.
Behavioural finance has focused on the study of the rationality of investors as well as on the cognitive processes involved in the financial decisions made by investors, specifically, in their capital market investment decisions (Fromlet, 2001).
Investor behaviour can cause price changes that do not necessarily follow the arrival of new information to the market but are, rather, caused by collective phenomena (Shefrin, 2000; Thaler, 1991). This has led researchers to seek theoretical explanations and empirical evidence regarding a number of behavioural finance phenomena, one of which is herd behaviour.
Herding may be defined as a group of investors ignoring their own information and beliefs and following the decisions of other investors, imitating them.
The first theoretical studies of this subject were carried out by Banerjee (1992), Bikhchandani, Hirshleifer, and Welch (1992) and Welch (1992). According to these authors, after a significant number of investors have chosen the same type of behaviour, others begin to ignore their own information and begin imitating their predecessors, thus setting in train a sequence of similar decisions.
However, the results of empirical studies into herding are not consensual. This may be due, among other factors, to the choice of time horizon for institutional investors, which is usually quarterly. According to Radalj and McAleer (2003), long periods make the herding evidence difficult.
In this context, we analyse the herd behaviour of Portuguese investors operating in the Portuguese capital market between 2003 and 2011. First, we study herding intensity, focusing on investor behaviour. Then, we evaluate the relationship between herding intensity and investor sentiment. Portuguese investor behaviour is analysed as a whole, since we have no means to distinguish individual from institutional investors.
This paper offers several contributions to the literature on herding. First, the study is applied to a small and illiquid capital market, which might influence the herd behaviour. Second, it considers two different approaches to the measurement of herding. This allows us to compare results and discern whether different methodologies lead to dissimilar conclusions. Third, it analyses the relationship between the herd behaviour and the investor sentiment, an issue that has been little explored. Finally, it covers a sufficiently broad period of time to dilute any biases arising from one-off market fluctuations.
The results suggest that empirical measurements of herding are sensitive to the measurement method used. Moreover, we find only weak evidence that herd behaviour in the Portuguese market is influenced by sentiment.
This paper is organised as follows. Section “Literature review and hypotheses” presents the literature review and formulates the hypotheses. Section “Methodology and data” describes the methodology and the data. The following section presents the empirical results. Finally, Section “Conclusion” offers our conclusions.
Literature review and hypothesesThe field of behavioural finance arose out of criticism of classical finance by a number of authors, including Kahneman and Tversky (1979).
According to behavioural finance theory, investors are influenced by psychological factors when making their decisions. Instead of following economic models, investors allow themselves be influenced by their beliefs and emotions, thus deviating from rational choices and causing a shift in asset prices in relation to their intrinsic value. This makes it difficult to determine the underlying value of assets.
Some authors argue that the existence of irrational investors will have no influence on prices, because they are random. In addition, irrational investors behave similarly, and rational investors take arbitrage opportunities. Shiller (1984) studied the impact of irrational investor behaviour on the capital market, concluding that such investors can cause changes in the movement of prices in relation to their fair values.
Capital markets can be influenced by psychological and sociological factors, meaning that they are not necessarily efficient. Salzman and Trifan (2005), looking mainly at competitive contexts, emphasised the relevance of investor emotions and feelings in financial decision-making and the subsequent effect on the price of financial assets.
Moreover, investors deciding on investments may engage in a process of imitation, influencing each other and wanting to sell and buy the same financial assets.
Herding behaviourThere are several definitions of herding behaviour.
Banerjee (1992) suggests that herding occurs when individuals do what everyone else does, even when their private information suggests they should take a different decision. Devenow and Welch (1996) and Sciubba (2000) refer to patterns of behaviour correlated among individuals.
Chang, Cheng, and Khorana (2000) referred to this behaviour as a process by which market participants base their investment decisions on collective actions alone, suppressing their own beliefs.
Patterson and Sharma (2007, p. 4) note that “herding occurs when a group of investors trade on the same side of the market in the same securities over the same period of time or when investors ignore their own private information and act as other investors do”.
Several authors have attempted to identify possible causes for the occurrence of the herding phenomenon.
Hirshleifer, Subrahmanyam, and Titman (1994) argue that the existence of herding is based on the tendency of investors to follow the same information sources, interpreting the signals conveyed to the market in a homogenous way and, therefore, taking similar financial decisions. Consequently, when individuals have access to the same sources of information or interpret it similarly, correlated behaviour patterns occur.
Other reasons for the herding phenomenon have been suggested. These include the fact that institutional investors negotiate excessively or analyse the same group of securities and transact in the same direction. Other potential causal factors that have been cited are the desirability of similar assets, compensation schemes, the cost of reputation, the quality of the information conveyed to the market and the degree of sophistication of the market (Black, 1986; Demirer & Kutan, 2006; Patterson & Sharma, 2006; Rajan, 1994; Scharfstein & Stein, 1990; Trueman, 1988).
There are two distinct understandings regarding the rationality of this phenomenon. Some authors suggest that herding is irrational and caused by the herding instinct, through which several groups of investors face similar decisions. This makes it difficult to identify and measure the herding effect. The second approach suggests that herding can be entirely rational and that it results from the deliberate intention of investors to mimic each other. The authors arguing this position are of the opinion that there is an important relationship between rationality and emotion in the decision-making process and that psychological factors may be compatible with the optimisation of investor behaviour. Empirically, it is difficult to distinguish one form of herding from another, given the multitude of variables that can sustain investment in a specific stock at a particular time.
Lakonishok, Shleifer, and Vishny (1992) evaluated changes in the observed proportions of buyers and sellers of certain securities, focusing on institutional investors. The authors found no solid evidence of herding in 769 tax-exempt U.S. pension funds analysed for 1985–1989.
Grinblatt, Titman, and Wermers (1995) analysed 155 U.S. mutual funds between December 1974 and December 1984. In general, their results show weak evidence of herding, which is consistent with the results of Lakonishok et al. (1992). However, they found that 77% of mutual funds attracted “momentum investors”, who bought stocks that were past winners but did not sell past losers.
Patterson and Sharma (2005) analysed the intraday herding phenomenon, based on a sample of 8000 stock-days’ trade data from the New York Stock Exchange (NYSE) between 1998 and 2001, using the same methodology as Bikhchandani et al. (1992). The intraday herding hypothesis is consistent with the models put forward by Avery and Zemsky (1998) and Banerjee (1992). Overall, they found evidence for the market efficiency hypothesis but found no significant evidence of herding. However, Patterson and Sharma (2005) point out that the high volatility observed in the period under review can hide some of the herding effect. Moreover, their intraday analysis of the phenomenon may have skewed the results and they suggest that subsequent research should look at other periods.
Although there are theoretical models that explain the existence of the herding phenomenon in financial markets, the evidence supporting these is not consensual. Some authors have proposed different measures and indicators, modifying the existing measures or proposing new approaches to the analysis. This is the case of Chang et al. (2000), Christie and Huang (1995), Hwang and Salmon (2004, 2009), Lakonishok et al. (1992) and Patterson and Sharma (2007).
Christie and Huang (1995) used the cross-section absolute deviation of returns (CSAD) in order to capture herding behaviour during periods of market stress. The results are inconsistent with the presence of herding during periods of large price movements. Chang et al. (2000) extended the work of Christie and Huang (1995), proposing a new approach to detecting herding that involves examining the relationship between the dispersion of equity returns and the overall market return. Additionally, they examine the presence of herding in an international context, considering both developed and developing financial markets, including the US, Hong Kong, Japan, South Korea, and Taiwan, for the period between 1963 and 1997. In the U.S. and Hong Kong, the authors found no evidence of herding behaviour. In the Japanese market, there is partial evidence for this effect and the authors found significant evidence of herding in the emerging markets of South Korea and Taiwan.
Demirer and Kutan (2006) analysed the presence of herding in the Chinese market, using the same methodologies as Chang et al. (2000) and Christie and Huang (1995). They found no evidence for herding behaviour in a sample of daily stock returns, for 375 stocks on the Shanghai and Shenzhen Stock Exchanges, from between January 1999 and December 2002. They suggest that Chinese investors make investment decisions rationally. Consequently, the authors concluded that the results support the efficient markets hypothesis. Their conclusions agree with those of Chen, Rui, and Xu (2003), who also analysed herding behaviour in the Chinese market, accounting for the momentum trading strategy and informational effects.
Cipriani and Guarino (2008a) show that an obstruction of information can arise when agents buy or sell in a sequence of imitation strategies, due to the heterogeneity of investors. Cipriani and Guarino (2008b) tested the models used in the previous studies, analysing financial market professionals. Their results confirm the absence of information cascades in a financial market without transaction costs or taxes.
Bonfim and Kim (2012) analysed 8 years worth of data from the 500 largest banks in 43 countries, including Canada, France, Germany, Italy, the Netherlands, the Russian Federation, the UK and the USA. After controlling for endogeneity, they found evidence that herding is significant only among the largest banks. This result suggests that the regulation of financial institutions may play an important role in mitigating liquidity risk. It is possible to argue that banks do not optimise their liquidity choices individually and may take into account other banks’ choices.
Studies covering markets characterised by a low level of liquidity tend to find evidence of herd behaviour. For example, Zaharyeva (2009) investigates the presence of herd behaviour in the Ukrainian capital market, between 1998 and 2008. Her results indicate that herding behaviour is present in this market. This agrees with the results of Duasa and Kassim (2008), who analysed the Malaysian capital market, which is also illiquid.
In general, empirical studies of the Portuguese market have found evidence of herd behaviour among investors (Barros, 2009; Leite, 2011; Serra & Lobão, 2002).
Serra and Lobão (2002) considered a sample of 32 equity mutual funds over the 1998–2000 period and Barros (2009) analysed a sample of 32 Portuguese equity funds for the period between 1997 and 2007. Both studies found evidence of herding.
Herding behaviour can be influenced by the market's degree of sophistication (Demirer & Kutan, 2006; Patterson & Sharma, 2006; Rajan, 1994; Scharfstein & Stein, 1990). The Portuguese market is small in size and of low liquidity, which leads to a type of behaviour that may differ from the major world markets, such as that of the USA. The lack of liquidity can influence behaviour in the markets because, in some periods, it may not be possible to carry out the desired action, especially when it comes to not imitating other investors.
Indeed, studies carried out in markets such as the USA, China and Hong Kong found no evidence of herd behaviour (Patterson & Sharma, 2005, 2007), which suggests some evidence for the market efficiency hypothesis. On the other hand, almost all studies designed to detect herd behaviour in developing stock markets (such as South Korea and Taiwan) and in relatively small illiquid capital markets (Portugal and Spain) found evidence of herding (Barros, 2009; Blasco, Corredor, & Ferreruela, 2009; Chang et al., 2000; Chen et al., 2003; Duasa & Kassim, 2008; Hwang & Salmon, 2004; Leite, 2011; Serra & Lobão, 2002; Zaharyeva, 2009). Additionally, Zhou and Lai (2009) found evidence of herding in the Hong Kong market, but only for small stocks.
Given this, we expect to find significant evidence of herding in the Portuguese capital market, in contrast with the results found in bigger and better developed capital markets. Based on the arguments above, we formulate the following hypothesis:H1 “Investors imitate each other in a systematic way”.
According to Patterson and Sharma (2006), if investors imitate others in a systematic way, the intensity of the herding must be negative, thus, we will find evidence supporting this hypothesis if the herding intensity is negative and statistically significant.
Information cascade modelsInformation cascades are associated with decisions repeated by several individuals, based on the observation of the behaviour of others. In recent decades, a growing body of literature has highlighted the importance of information cascades in the context of economics and the social sciences.
According to Patterson and Sharma (2006), information cascades occur when trading sequences initiated by a buyer or seller are higher than those sequences that would occur if each investor made their decision on the basis of their private information alone.
Bikhchandani et al. (1992) believe that investors’ decisions are taken sequentially. According to the authors, a cascade of investment (disinvestment) will begin only if both the first and the second investors decide to invest (disinvest). Information cascades lead to rational herding when investors recognise that it is more profitable to rely on the information they inferred from the actions of other investors (Welch, 1992).
Smith and Sorensen (2000) emphasised that an information cascade occurs when an infinite sequence of individuals ignore their private information in the decision-making process, while herd behaviour occurs when an infinite sequence of individuals make an identical decision, not necessarily ignoring their private information. Thus, a cascade implies herding, but herding is not necessarily the result of a cascade.
Cipriani and Guarino (2008c) concluded that informational cascades impair the process of information aggregation and may create a misalignment between the price of an asset and its fundamental value. However, they found that the presence of a transaction cost does not significantly affect the convergence of the price to the fundamental value, maybe because transaction costs reduce the frequency with which agents irrationally trade against their private information. Bikhchandani and Sharma (2001) emphasised that adjusting for changes in fundamentals is not easy, given the difficulty of adequately capturing both the intensity and direction of herding in a particular asset or market.
Investor sentimentAccording to the psychology literature, individuals’ sentiments affect their judgments about future events, influencing their decision-making process. In general, evidence from psychology shows that people with positive sentiment make optimistic choices and people with negative sentiment make pessimistic choices (Arkes, Herren, & Isen, 1988; Bower, 1981; Wright & Bower, 1992).
Market sentiment is the general prevailing attitude of investors as to anticipated price development in a market. It is the accumulation of a variety of fundamental and technical factors, including price history, economic reports, seasonal factors and national and world events.
Since the sentiment measures the emotional state of the capital market, we might expect it to influence herd behaviour.
Different authors have used different proxies for sentiment. Among the most common of these are those suggested by Baker and Wurgler (2006), who constructed a sentiment proxy based on a number of factors. Their variables included closed-end fund discounts, NYSE share turnover, the number of IPOs, the equity share in new issues, and the dividend premium and the Consumer Confidence Index from the University of Michigan. Various authors, such as Schmelling (2009), have used these proxies.
More recently, Ben-Rephael, Kandel, and Wohl (2012) applied two tools to measure investor sentiment in mutual fund flows. The first was the survey-based Consumer Sentiment Index from the University of Michigan Survey Centre, also used by Lemmon and Portniaguina (2006). The second was Baker and Wurgler's (2006) measure, which is based on six indirect measures of investor sentiment: the trading volume measured by NYSE turnover, the closed-end fund discount, the dividend premium, the number of IPO and first-day returns on IPOs and, finally, the equity share in new issues. Baker, Wurgler, and Yuan (2012) constructed an investor sentiment index for six major stock markets (Canada, France, Germany, Japan, UK and the US), using three different approaches.
Long, Shleifer, and Waldmann (1990) argued that investors are influenced by sentiment, this being related to the confidence they feel concerning future cash flows. According to Shleifer and Vishny (1997), it can be expensive and risky to compete with sentimental investors, since their decisions affect the market price of securities. Eichengreen and Mody (1998) suggested that a change in a set of asset prices can change investor sentiment and result in a contagion effect, especially in the short-term. Regarding the timeframe, Baek and Bandopadhyaya (2005) concluded that changes in sentiment can explain short-term movements in asset prices, better than any other set of fundamental factors.
A growing number of empirical studies have found evidence of a significant relationship between investor sentiment and market returns (Baker & Wurgler, 2006, 2007; Brown & Cliff, 2005; Lee, Jiang, & Indro, 2002). The results show that individual investors are easily influenced by sentiment, and that sentiment influences the investors’ decision-making process. Consequently, stock prices and market returns are affected.
The results obtained by Lee et al. (2002), based on the Investors’ Intelligence Sentiment index, indicated that changes in sentiment are negatively correlated with market volatility. Volatility increases (decreases) when investors become more optimistic (pessimistic). Brown and Cliff (2005) found evidence that sentiment affects asset valuation, based on a sample of 456 observations between January 1963 and December 2000. As a group, investors tend to overvalue (undervalue) assets during times of extreme optimism (pessimism) or high (low) sentiment. When investors are optimistic (pessimistic), the market valuation is higher (lower) than the intrinsic value. Consequently, the authors suggest that asset-pricing models should consider the role of investor sentiment.
There is empirical evidence suggesting both that investor sentiment has a significant influence in the stocks market returns (e.g., Baker & Wurgler, 2006, 2007) and that the capital market is positively related to investor sentiment (Lee et al., 2002; Wang, Keswani, & Taylor, 2006).
Despite the growing interest in this issue and the large number of studies that focus on the analysis of the relationship between investor sentiment and market returns, there are very few studies analysing the impact of sentiment on herd behaviour.
Consequently, further work needs to be done on the relationship between herding intensity and investor sentiment. We expect to find that if sentiment is low (high), many (few) investors imitate the actions of other investors whom they assume to have more reliable information about the market. Based on this argument, we formulate our second hypothesis regarding the influence of sentiment on herding:H2 “Sentiment influences herding behaviour”.
In this section, we describe the methodology used to test the hypotheses and present the resulting data.
Herding intensityTo measure herding intensity in the market, we consider two different approaches, since the evidence shows that different methods can lead to different conclusions.
First, we follow the methodology proposed by Patterson and Sharma (2006), applied to a Portuguese sample. This method captures intraday order sequences, generally considered to offer the ideal frequency for testing the presence of herding behaviour. When news is conveyed to the market on an intraday basis, investors may not have time to apply analytical models to interpret the news and, consequently, to predict future price movements. Thus, their decisions may not be compatible with rational thought, so investors will tend to follow the attitudes of other market participants (Orléan, 1995).
Patterson and Sharma (2006) suggested that an information cascade can be observed in the presence of sequences of negotiation initiated by buyers or sellers that are higher than sequences observed if every investor decided only on the basis of the available information.
We consider this measure appropriate to our study for three main reasons. First, an intraday measure, being a daily indicator, is a suitable tool for testing the presence of this kind of behaviour. Second, it does not assume that herding varies with extreme market conditions. Finally, it takes into account all investors rather than only the institutional ones.
To construct the herding intensity measure, we start by identifying all trades carried out during each trading day in the sample period, measuring the number of sequences that occurred in the same day, in every stock.
The Patterson and Sharma (2006) statistic that measures herding intensity in terms of the number of runs is a random variable that can be expressed as follows:
where ri is the number of runs from type i (up, down or zero); n, total number of trades executed on stock j on day t; 1/2 is the parameter to adjust for discontinuity; pi is the probability of finding a run from type i.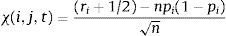
Under asymptotic conditions, the statistic χ(i,j,t) has a normal distribution with zero mean and variance equal to the result of the following expression:

To determine herding intensity in the capital market, we identified the type of day for each stock sequence belonging to the respective market index. Thus, we determined the daily return of each security, assuming that this is a sequence of the type a (up), b (down) or n (zero), when the return of the stock is positive, negative or zero, respectively. The daily return of stock j on day t is determined arithmetic as follows:
where CPj,t is the closing price of stock j on day t; CPj,t−1 is the closing price of stock j on day t−1.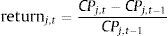
This analysis results in the daily series of stocks traded as up, down or zero types. All transactions are ordered, to measure the number of sequences that occurred in each day. We then calculated statistic based on Patterson and Sharma (2006).
The herding intensity statistic is as follows:
where i takes one of three different values according to whether the trade is buyer-initiated (up), seller-initiated (down), or zero tick (zero).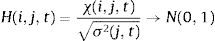
If investors engage systematically in herding, the indicator value should be negative and statistically significant, because the actual number of initiated sequences (runs) will be lower than expected (Patterson & Sharma, 2006). Consequently, the more negative the indicator, the greater is the probability of herding.
According to Patterson and Sharma (2007), a trade is classified as buyer-initiated (seller-initiated) if the current trade price is higher (lower) than the previous trade price. If there is no change in the current trade price with respect to the previous trade price, it is a zero-tick. Consequently, we have three series of H statistics:
Ha=series of statistic values for up runs (buyer)
Hb=series of statistic values for down runs (seller)
Hn=series of statistic values for runs with no price changes (zero)
According to the model, it is assumed that for large samples, H(i, j, t) follows a normal distribution with mean zero and variance of one.
One possible problem in the application of this methodology is missing values. On checking for missing values, expected given the characteristics of the Portuguese capital market, such as low liquidity, these are filled with the last price, as recommended by Duque and Razina (1998) and Soares (1994).
We apply a second measure of herding, based on the methodology used in Chang et al. (2000) and Christie and Huang (1995). Cross-sectional standard deviations (CSSD) are used as a measure of return dispersion as follows:
where Rj,t is the stock return of firm j at day t; Rm is the cross-sectional average of the n returns in the portfolio for day t; n is the number of firms.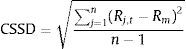
This methodology is based on the assumption that the presence of herd behaviour would mean stock returns did not deviate far from the overall market return, suggesting that the presence of herding is most likely to occur during periods of extreme market movements. Therefore, we estimate the following regression model:
where DtL=1 if the market return on day t lies at the extreme lower tail of the distribution and zero otherwise; DtU=1 if the market return on day t lies at the extreme upper tail of the distribution and zero otherwise.
According to the authors, the dummy variables capture the differences in investor behaviour in extreme up or down versus relatively normal markets. If coefficients are negative and statistically significant, it suggests herd behaviour. We use 1 and 5% criteria to restrict the variables DtL (DtU) to 1 and 5% of the lower (upper) tail of the market return distribution.
Relationship between sentiment and herdingIn order to measure investor sentiment, we follow Schmeling (2009) and Vieira (2011), relying on the European Economic Sentiment Indicator (ESI), published by the European Commission and obtained from the DG ECFIN database. The ESI index is a composite indicator made up of five confidence indicators with different weights: industrial confidence indicator, services confidence indicator, consumer confidence indicator, construction confidence indicator and retail trade confidence indicator. The confidence indicators are based on surveys carried out in all member states of the European Union that cover fifteen sentiment components, including industrial production, commercial activity, consumption and savings. The ESI is calculated as an index with a mean value of 100 and standard deviation of 10. Therefore, ESI values higher (lower) than 100 are usually expected in bull markets (bear markets). There are two aggregated ESI values: Euro area (17 countries) and EU (27 countries), and one for each country. We use the ESI Portugal to proxy for Portuguese investors’ sentiment.
Given that sentiment may explain the synchronised behaviour of groups of investors, we may detect the phenomenon of herding behaviour when the dimension of the respective groups is significant.
Thus, we want to analyse the impact of investor sentiment on the herding effect.
To analyse the relationship between investor sentiment and herding behaviour and test H2, we estimate the following regression, based on the ordinary least squares model:
where α and β represent the model parameters, ESIl is a proxy for lagged Portuguese investor sentiment, Hi,j,t−1 has already been cited and ¿t is the regression residuals. We consider the lagged herding variable to control for the influence of previous period herding on the herding behaviour in the subsequent period. For model (7), we run three regressions, considering the three types of i sequences (up, down and zero). We expect β2 to be negative, reflecting a negative relationship between sentiment and herd behaviour.
We then use the Granger causality test to find out the nature of causality between herding and sentiment, i.e., to see if it is sentiment that causes herding or if it is herding that causes sentiment, using the regressions relating herding and sentiment as follows:
andwhere (8) postulates that current herding is related to past values of itself as well as that of sentiment and (9) postulates a similar behaviour for sentiment. In regression (9) we control for previous sentiment.Data

To apply the methodology, we need to obtain the prices from a representative index of the market as well as the price series of its component stocks.
We focus on the Portuguese stock exchange's benchmark index, the PSI-20. This tracks the 20 most traded stocks and we consider it to be representative of the market as a whole, because it is composed of the twenty companies in the Portuguese capital market with the highest market capitalisation, which, in turn, is directly related to liquidity, size and economic situation of the market. Data on PSI-20 prices, as well as the constituent securities were collected from NYSE Euronext Lisbon for the period between January 2003 and December 2011. This corresponds to 2308 daily closing prices. Data are considered on a daily bases, together with the daily opening, closing, maximum and minimum price series for the period.
The missing values in this market are replaced with the last price formed, in accordance with Duque and Razina (1998) and Soares (1994).
ResultsThis section presents and discusses the empirical results. We first analyse herding intensity, as measured for the different sequence types (up, down and zero). After this, we test the relationship between sentiment and herding.
Herding intensityFor the statistical analysis of herding intensity, we start by calculating the returns of the PSI-20 index listed stocks, according to expression (3). Subsequently, we determine the average transverse series, and the series of mean values. Finally, we determine the statistical series H according to expression (4), considering the three kinds of possible sequences, i.e., considering the Ha, Hb and Hc statistics for each day for all PSI-20 listed stocks. This gives us the Ha, Hb and Hc statistic series.
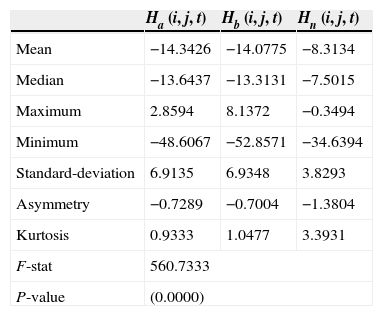
Table 1 reports the main results regarding herding intensity, for the period between January 2003 and December 2011, plus the F-statistics and their associated probability for the null hypothesis of equality of means between runs.
Herding intensity across up, down and zero runs.
| Ha (i, j, t) | Hb (i, j, t) | Hn (i, j, t) | |
|---|---|---|---|
| Mean | −14.3426 | −14.0775 | −8.3134 |
| Median | −13.6437 | −13.3131 | −7.5015 |
| Maximum | 2.8594 | 8.1372 | −0.3494 |
| Minimum | −48.6067 | −52.8571 | −34.6394 |
| Standard-deviation | 6.9135 | 6.9348 | 3.8293 |
| Asymmetry | −0.7289 | −0.7004 | −1.3804 |
| Kurtosis | 0.9333 | 1.0477 | 3.3931 |
| F-stat | 560.7333 | ||
| P-value | (0.0000) | ||
Based on the statistical evidence, it is possible to reject the null hypothesis of equal means at the 1% level, concluding that the average time series Ha, Hb and Hn differ among the sequences of herding intensity. Thus, the results show that on average, herding intensity is negative and significant across all types of run (up, down and zero), suggesting evidence for herding behaviour in the three types of sequences. However, there is an important difference between the up and down runs (−14.3426 and −14.0775, respectively) and the zero run (−8.3134), with much higher herding intensity levels evident when there are price changes (up runs and down runs) than when there is no price change (zero runs).
The results show that, on average, the herding intensity is negative and significant for all three sequences. Thus, evidence from the first measure of herding behaviour supports the hypothesis that investors imitate each other in a systematic way (H1). This conclusion is in accordance with Blasco, Corredor, and Ferreruela (2012).
Kurtosis measures the concentration of the returns distribution. Since the value is always positive, the distribution is leptokurtic, indicating that some sample values are far more removed from the average than others are. This implies a higher probability of positive and negative returns than in a normal distribution. A leptokurtic distribution has fat tails. It is likely that the economic and financial time series are characterised by this type of distribution (Peters, 1996). According to this author, one of the most common explanations for the existence of these tails is the fact that the information appears in a grouped form, and not in a continuous and linear way. Thus, as information distribution is leptokurtic, the returns also have this type of distribution. In fact, a significant number of empirical studies of finance have shown that the returns distribution on financial assets on a daily, weekly or monthly basis does not behave like a normal distribution.
Since rational investors always prefer more to less, they will choose an asset with a low kurtosis, as this is associated with returns that are more predictable. This is the case in our study, where the sequence is initiated by buyers.
The assumption of an efficient market, where stock returns follow a normal distribution, are independent and identically distributed, has been criticised by several authors (Afonso & Teixeira, 1999; Godinho, 1999; Soares, 1994, 1997).
In the Portuguese context, Soares (1997) found that the PSI-20 returns presented a leptokurtic distribution, characterised by high levels of kurtosis, analogous to empirical studies conducted internationally. In general, the authors state that this behaviour derives from the existence of non-linear dependence, since linear models are unable to explain the distributions of stock and index returns. On testing, the authors found significant evidence for non-linear dependence.
Asymmetry measures the extent to which the distribution is not symmetric around the mean. We observe a negative asymmetry in all the series, indicating that returns are negative. Consequently, there is a higher probability of losses than gains, regardless of the attitude taken by the investor (buyer, seller or neutral). One possible reason for the asymmetrical results might be the influence of the recession period on the sample period and the consequent negative returns.
Since the absolute value is higher for neutral sequences, the probability of getting negative returns is greater when investors mimic each other in neutral sequences.
Given the standard deviation values, we can see that there is volatility in trading a particular stock, on a specific day during the considered period.
Observing the maximum values of the series, we can see that the highest value belongs to the low sequence type (about 8.14). Investors show significant herding behaviour for PSI-20 listed stocks for almost every day of the study period, especially in seller-initiated sequences.
One possible reason for the weak evidence of herding behaviour in some empirical studies (e.g., Patterson & Sharma, 2005, 2007) might be associated with four main factors: the sample used, which is normally institutional investors only, the data frequency, the characteristics of the capital market and the methodology applied.
For robustness reasons, and because we are considering a period of time which is characterised by different economic cycles, we divide the sample into two sub-periods. The first period runs from 2003 to 2006, and the second from 2007 to 2011. In both sub-periods, we reject the null hypothesis of equal means, concluding that the average time series Ha, Hb and Hn differ among the sequences of herding intensity.1 The results show that, on average, herding intensity is negative and significant across all types of run (up, down and zero), suggesting evidence for herding behaviour in the three types of sequences. The results for Ha, Hb and Hn do not differ significantly from the global period (2003–2011), so our main conclusions about the evidence of herding do not change. Given these results, we continue to analyse the global period.
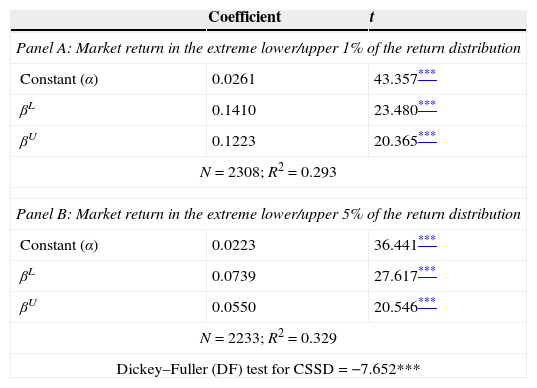
Table 2 provides the regression estimates for the regression (6) considering the 1 (Panel A) and 5% (Panel B) criteria to restrict the variables DtL (DtU) to 1 and 5% of the lower (upper) tail of the market return distribution.
Regression results for the CSSD coefficients CSSDt=α+βLDtL+βUDtU+εt.
| Coefficient | t | |
|---|---|---|
| Panel A: Market return in the extreme lower/upper 1% of the return distribution | ||
| Constant (α) | 0.0261 | 43.357*** |
| βL | 0.1410 | 23.480*** |
| βU | 0.1223 | 20.365*** |
| N=2308; R2=0.293 | ||
| Panel B: Market return in the extreme lower/upper 5% of the return distribution | ||
| Constant (α) | 0.0223 | 36.441*** |
| βL | 0.0739 | 27.617*** |
| βU | 0.0550 | 20.546*** |
| N=2233; R2=0.329 | ||
| Dickey–Fuller (DF) test for CSSD=−7.652*** | ||
The results do not show any evidence in favour of herd formation during periods of significant change in market returns. This is consistent with a number of studies, such as those of Chang et al. (2000), Demirer and Kutan (2006), Grinblatt et al. (1995), Lakonishok et al. (1992) and Patterson and Sharma (2005, 2007). Indeed, the regressions show positive and statistically significant β coefficients. All the coefficients are significantly positive, indicating that stock return dispersions increase during periods of large price changes. Additionally, the unit root (Dickey–Fuller) test indicates that the CSSD time series is stationary. Consequently, we can use the usual (Student's) t test (Gujarati, 2009).
This finding supports the hypothesis of rational asset pricing models that predict that periods of market stress lead to increased levels of dispersion as the sensitivity of individual returns differs from the market return (Demirer & Kutan, 2006).
Comparing these results with those from Table 1, we see that they are contradictory, suggesting that the evidence for herding behaviour is influenced by the measures used. Consequently, we cannot support the hypothesis that investors imitate each other in a systematic way.
Several reasons might explain the differences between the results from the two models. Missing values might be a problem for the first methodology. However, to obviate this problem, we have followed the recommendation of Duque and Razina (1998) and Soares (1994), as already explained. The second approach suggests that herding is more likely to occur during periods of extreme market movements. In addition, the Christie and Huang (1995) model requires a high magnitude of non-linearity in the return dispersion and mean return relationship for evidence of herding (Chang et al., 2000). The Patterson and Sharma (2006) approach has the advantages of being constructed from intraday data, considering the market as a whole instead of a few institutional investors and of not assuming herding to differ under extreme market conditions (Blasco et al., 2012). Given these considerations, as well as the previous evidence of herding on the Portuguese market (Barros, 2009; Leite, 2011; Serra & Lobão, 2002), we believe that the results of expression (4) may be more reliable.
Relation between sentiment and herding behaviourSentiments like optimism, pessimism, hope and fear might influence investors’ financial decision-making.
Lakonishok et al. (1992) and Liao, Huang, and Wu (2010) concluded that sentiment can be a determinant of investor decisions. Studies in psychology have confirmed the importance of sentiment in the decision-making of individuals. Schwarz (2002), for example, suggested that the individuals making decision process will be influenced by emotional and sentiment factors.
Hwang and Salmon (2004, 2009) found a significant relationship between market sentiment and herding. In this context, we will analyse the effect of investor sentiment on herding.
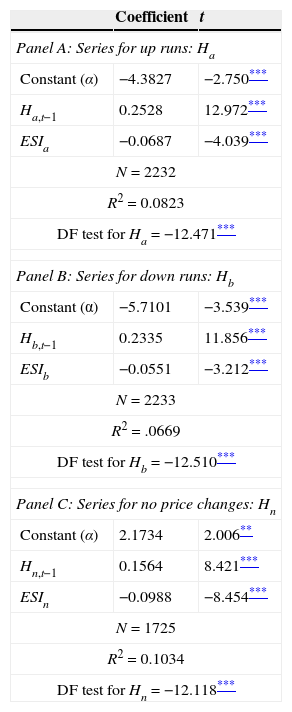
We begin by examining the relationship between investor sentiment and herding, applying the regression model (7), in which the dependent variable is herding intensity and the independent variables are sentiment and previous herding intensity. The model is regressed for the three types of sequences (up, down and zero).
Table 3 shows the results for the high sequences (Panel A), the low sequences (Panel B) and the neutral positions or zero-tick (Panel C), respectively.
Regression results for the relationship between sentiment and herding Hi,t=α+β1Hi,j,t-1+β2ESIt+εt.
| Coefficient | t | |
|---|---|---|
| Panel A: Series for up runs: Ha | ||
| Constant (α) | −4.3827 | −2.750*** |
| Ha,t−1 | 0.2528 | 12.972*** |
| ESIa | −0.0687 | −4.039*** |
| N=2232 | ||
| R2=0.0823 | ||
| DF test for Ha=−12.471*** | ||
| Panel B: Series for down runs: Hb | ||
| Constant (α) | −5.7101 | −3.539*** |
| Hb,t−1 | 0.2335 | 11.856*** |
| ESIb | −0.0551 | −3.212*** |
| N=2233 | ||
| R2=.0669 | ||
| DF test for Hb=−12.510*** | ||
| Panel C: Series for no price changes: Hn | ||
| Constant (α) | 2.1734 | 2.006** |
| Hn,t−1 | 0.1564 | 8.421*** |
| ESIn | −0.0988 | −8.454*** |
| N=1725 | ||
| R2=0.1034 | ||
| DF test for Hn=−12.118*** | ||
As can be seen, the coefficient of sentiment is negative and statistically significant for all three types of sequence, allowing us to conclude that sentiment negatively influences herding. The negative relationship between investor sentiment and herding in all the types of series suggests that the higher the sentiment, the lower the herding. This appears consistent, since it shows that when sentiment is high, investors do not feel the need to imitate other investors and are more likely to take independent decisions. On the other hand, when sentiment is low, investors are more likely to follow the decisions of other investors. Consequently, we found evidence through regression model (7) that supports the second hypothesis (H2). Blasco et al. (2012) also show evidence for causality between sentiment and herding intensity in the short term.
Regarding the relationship between current and previous herding, we found that the herding coefficient is positive and statistically significant for all types of sequences. This suggests that the higher the herding in a given period, the higher the herding effect in the subsequent period. Additionally, the unit root (Dickey–Fuller) test indicates that the herding time series is stationary for all the three measures (Ha, Hb and Hn), so can consider the usual (Student's) t test (Gujarati, 2009).
Despite our previous conclusions, the R2 values show that herding intensity is explained by sentiment and by previous herding behaviour by about 8%, 7% and 10% of high, low and neutral sequences, respectively. The low R2 values are an indication that herding intensity might be explained by factors other than those considered in the regression model. Consequently, one challenge for future research would be to find additional variables that can explain herding intensity.
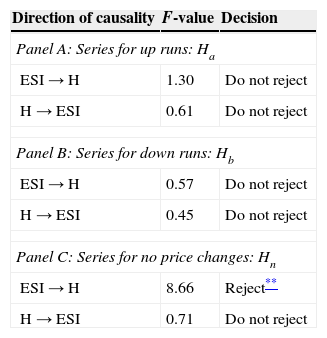
Table 4 shows the F test that results from the implementation of the Granger causality test (Gujarati, 2009) for the high sequences (Panel A), the low sequences (Panel B) and the neutral positions or zero-tick (Panel C), respectively, using four lags of each variable.
Granger causality test for the causality between sentiment and herding.
| Direction of causality | F-value | Decision |
|---|---|---|
| Panel A: Series for up runs: Ha | ||
| ESI→H | 1.30 | Do not reject |
| H→ESI | 0.61 | Do not reject |
| Panel B: Series for down runs: Hb | ||
| ESI→H | 0.57 | Do not reject |
| H→ESI | 0.45 | Do not reject |
| Panel C: Series for no price changes: Hn | ||
| ESI→H | 8.66 | Reject** |
| H→ESI | 0.71 | Do not reject |
The results suggest that the direction of causality is from sentiment to herding, and not from herding to sentiment, and only in the neutral positions, since this is the only situation in which the estimated F is statistically significant. There is no other causality relation, since all the other F values are statistically insignificant. Consequently, when sentiment is high, herding is lower for situations in which prices do not change (neutral positions). This result might be related with the evidence that herding intensity is higher for sequences of price changes (Ha and Hb) than for no price changes (Hn). Concluding, we can only support H2 for zero-tick observations.
ConclusionIn this study, we have analysed the herding behaviour among investors in the Portuguese capital market, by looking at all PSI-20 stocks listed between 2003 and 2011. We based our study on the assumption that investors would be more likely to go with the market consensus and ignore their private information.
We started by calculating herding intensity, using two different approaches to measure herd behaviour.
First, we adopted the measure of herding intensity proposed by Patterson and Sharma (2006), based on the information cascades of Bikhchandani et al. (1992), which measures herding intensity in sequences initiated by buyers and sellers. The results show that herding intensity is negative and statistically significant, which allows us to conclude that investors mimic each other in a systematic way.
However, when we follow the methodology used in Chang et al. (2000) and Christie and Huang (1995), we find no evidence of herd behaviour, which suggests some evidence for the market efficiency hypothesis. These results are consistent with Chang et al. (2000), Demirer and Kutan (2006) and Patterson and Sharma (2005, 2007), among others, whose findings support rational asset pricing models.
These different findings have an important empirical implication, since it suggests that different herding measures lead to different conclusions about the existence of herd behaviour.
We then analysed the relationship between market sentiment and herding intensity. This analysis was based on the assumption that investors are subject to the effect of sentiment, which influences their decision-making process allowing it to be driven by the decisions of other investors.
Using a regression model, the results suggest that sentiment negatively influences herding behaviour. However, the results of applying the Granger causality test to determine the nature of causality between herding and sentiment suggest that the direction of causality is from sentiment to herding, but only in the neutral positions. Thus, globally, we do not support the hypothesis that sentiment influences herding behaviour (H2), which is consistent with the results of Leite (2011).
We believe that this study contributes to the empirical literature on herding by suggesting that the evidence for herding behaviour is dependent on the approaches used to measure this phenomenon and that there is a need for a methodological rethink.
In future research, we would like to see if other herding measures lead to different results. Moreover, we would like to study whether the herding behaviour differs between periods of stability and economic recession. In addition, we would like to analyse different sentiment measures and study whether herding is influenced by other factors apart from sentiment. Finally, herding behaviour has been studied in specific markets, without analysing the factor of contagion between different markets. Thus, we believe it would be relevant to analyse contagion at an international level.
Conflict of interestThe authors declare no conflict of interest.