


In this paper, a model is proposed that allows us to obtain a portfolio made up of sustainable and socially responsible (SR) investment funds. This portfolio tracks the one that investors might have chosen if they had not taken into account social, ethical and ecological (SEE) issues in their investment decisions. Therefore, in the first stage, reference portfolio exclusively made up of conventional funds is obtained. For the construction of the conventional portfolio the Prospect Theory has been used: net profits as the financial objective and error function as the utility function. In the second stage, a portfolio consisting exclusively of SR-funds is built. To do so, the reference portfolio is used as an ideal point, with the objectives of the SR-investor being the relative wealth with respect to the reference portfolio and the SEE quality of the portfolio. The relative wealth will be manipulated by a downside-risk measure, the Conditional Value at Risk (CVaR), and the periodic values of the portfolio. The second objective is the SR Quality of the portfolio, taking into account the personal values of a particular investor. This is built using Fuzzy Set Theory tools. We are faced with a multi-objective problem which is solved by using Goal Programming methodology. The estimation of both conventional and SR markets has been carried out by a semi-parametric approach by using the Copula Theory for modeling the dependence structure of the assets’ returns. The approach has been applied to a set of 38 conventional and 12 ethical funds domiciled in Spain.
El modelo que se propone permite obtener una cartera formada por fondos de inversión sostenibles y socialmente responsables (SR). Esta cartera sigue (tracking) a la cartera que hubiese elegido el inversor si no tuviera en cuenta valores sociales, éticos y ecológicos (SEE) en sus decisiones de inversión. Por tanto, la primera etapa del modelo consiste en obtener la cartera de referencia formada exclusivamente por fondos convencionales. Para la construcción de esta cartera se utiliza la Teoría de la Prospección: beneficios netos como objetivo financiero y la función de error como función de utilidad. En la segunda etapa, se construye una cartera formada exclusivamente fondos SR. Para ello, se utiliza la cartera de referencia como un punto ideal siendo los objetivos del inversor socialmente responsable la riqueza relativa respecto de la cartera de referencia y la calidad SEE de la cartera. Por tanto, se tiene un objetivo aleatorio –la riqueza relativa– que será manipulado mediante su Valor en Riesgo Condicional (CVaR) que es una medida de riesgo inferior, es decir, tiene en cuenta las peores pérdidas de la cartera, y los valores periódicos de la cartera. El segundo objetivo está referido a la calidad SR de la cartera atendiendo las creencias y valores personales de un inversor específico; se construye aplicando herramientas de la teoría de subconjuntos borrosos. Nos enfrentamos a un problema multi-objetivo que se resuelve mediante la Programación por Metas. La estimación de los mercados, convencional y SR, ha sido llevada a cabo mediante un enfoque semi-paramétrico utilizando la Teoría de Cópulas para modelar la estructura de dependencia de las rentabilidades de los activos. El modelo se ha implementado utilizando como mercado 38 fondos de inversión convencionales y 12 fondos éticos españoles.
In a portfolio selection process, an investor seeks the combination of assets that best meets her needs in conditions of uncertainty. Therefore, in order to determine the optimum portfolio the investor needs to model, estimate, evaluate and manage such uncertainty. Under certain hypotheses, it is possible to estimate the parameters of the market which are necessary for the model, and afterwards to solve the optimization problem. In general, the investor focuses on a function of the portfolio value at the end of the holding period. The return and the profit-and-loss of the portfolio are examples of such functions.
The most popular approach for the selection of portfolios is the mean-variance model suggested by Markowitz (1952, 1959), where the investor tries to maximize her expected return for a fixed level of variance and within a set of investment constraints.
Modern Portfolio Theory (MPT) considers that investors can benefit from diversification by investing in financial assets with lower correlations. In MPT it is assumed that the financial returns follow a multivariate normal distribution. Therefore, the dependence between financial returns is described by the linear correlation coefficient and efficient portfolios are given by the traditional mean variance optimization program. However the variance has been criticized because it is a symmetric measure and treats downside risk and upside risk in the same way while the investors assign greater importance to downside risk than to upside risk (Ang, Chen, & Xing, 2006; Post & van Vliet, 2004).
Recently, there is a growing interest for the use of risk measures which taking into account the worst losses. Value at Risk (VaR)1 and Conditional Value at Risk (CVaR)2 have emerged as pertinent risk measures in finance and have found supporters in the financial community (Kaminski, Czupryna, & Szapiro, 2009; Krokhmal, Palmquist, & Uryasev, 2002; Meucci, 2007). The Basel Committee on Banking Supervision (Basel Committee on Banking Supervision, 2001, 2011) validated these new tools and enforced its use among financial institutions to monitor the riskiness of their investment policies. In addition, VaR has been criticized for not being a coherent risk measure (for more details, see Artzner, Delbaen, Eber, & Heath, 1999; Gilboa, 2009; McNeil, Frey, & Embrechts, 2005). For this reason, we use the CVaR as downside risk measure instead of the VaR.
For solving the portfolio selection problem, it is necessary to carry out three tasks. Firstly, to model the market, that is, to determine a random model to generate the asset prices at the investment horizon. In order to address this point we have used Copula Theory. It was introduced by Sklar (1959) but was not applied in finance until 1999 (for a deep description of the mathematical and statistical foundations of copulas, see Joe, 1997; Nelsen, 1999, and for a host of empirical applications of them, see Cherubini, Luciano, & Vecchiato, 2004; Jondeau, Poon, & Rockinger, 2007; McNeil et al., 2005). Sklar's theorem states that any multivariate distribution can be factored into the marginal cumulative distributions and a copula function describing the dependence between the components. An important advantage of copula lies in separating marginal distributions and dependence structure from joint distribution. Another good feature of copula functions is that they allow for different degrees of tail dependence: the upper tail dependence exists when there is a positive probability of positive outliers occurring jointly while the lower tail dependence is a negative probability of negative outliers occurring jointly. In particular, we consider t-copulas for their easy handling for simulation.
Secondly, to define optimality taking into consideration the investor's profile. This question reveals the difficulty in interpreting optimality under uncertainty. For this, it is necessary to use suitable surrogates on the real line of the investor's objectives, called “risk measures” in the context of cost or loss. Then, the question of which properties should verify the risk measures appears. These properties are known in the literature as “risk measure coherence” (Artzner et al., 1999). Lastly, to calculate an optimum portfolio, that is, to determine exactly or with a good approximation a portfolio which best fits the investor's profile. In most situations exact solutions are unattainable because analytical solutions do not exist due to numerical problems associated with the non-convexity of the problem; therefore, it is necessary to appeal to approximations.
In recent years business increasingly has been viewed as a major cause of social, environmental and economic problems. The instances of corporate scams and scandals have made that the investors bear in mind the quality of governance of companies and responsibility of their conduct (Gupta, Mehlawat, & Saxena, 2013). In this way, the investors are becoming conscious of the desirability of sustainable and responsible evaluation of the financial assets. Sustainable and Responsible Investing (SRI) refers to an investment process that, along with the traditional financial analysis, integrates the analysis of a company's social responsibility in pursuit of enhanced long-term returns. SRI provides a comprehensive way to assess a company's real value by including both corporate responsibility and sustainability measures in a company's valuation (EUROSIF, 2012).
This investment approach attracts an important number of people who wish their investments to be in accordance with their morality. SRI includes one or more of the following strategies in the search for, selection and follow-up of a portfolio: the exclusion of companies or “harmful” sectors (such as armaments, tobacco, alcohol etc.) to society (negative screening), positive filters in order to identify companies who enjoy a good reputation for issues such as the environmental protection, fair labor practices, quality of products, and worthy relationships regarding their presence in other countries (positive screening), investment in best in class companies in environmental and social performance, and communication and interaction with companies about their environmental, social and corporate governance actions by means of the exercise of political rights inherent in the ownership of enterprises (constructive engagement or ethical overlay) (Renneboog, Ter Horst, & Zhang, 2008a). There is increasing demand for business transparency; so companies should measure, report, and improve their social, environmental, and economic performance. However, determining how social and financial performances are connected is complicated due to the lack of consensus of measurement methodology concerning to corporate social responsibility. There are a lot of researches focused on the analysis of companies for their environmental, social or governance performance and their relationship with the financial performance, but the results obtained have not been conclusive. For example, Bello (2005) compares the performance of sustainable and conventional funds and shows that there is no significant under or overperformance of sustainable funds. Kempf and Osthoff (2007) do not observe statistical significant outperformance of high-rated companies over low-rated companies for the diversity, human rights, and product screen. Galema, Plantinga, and Scholtens (2008) consider the impact of SRI on stock returns and conclude that SRI has a significant impact on the stock returns. Derwall and Koedijk (2009) evaluate the performance of socially responsible bond and balanced funds relative to matched samples of conventional funds, over the period 1987–2003. Using multi-index performance evaluation models, they show that the average SRI bond fund performed similar to conventional funds. Statman and Glushkov (2009) used the same dataset as Kempf and Osthoff (2007) and found that stocks with high social responsibility ratings performed generally better than stocks with low social responsibility ratings. However, none of the results were statistically significant except for the employee screen. Hong and Kacperczyk (2009) studied the performance of sin stocks on the American market over the period 1965–2003. They found that sin stocks perform better than non-sin stocks in their sample. However, the difference in return is not statistically significant. Biehl, Dumke, Hoepner, and Wilson (2010) consider UK SRI funds and show that the portfolios with the highest social ratings underperform significantly, while the portfolios with the lowest social ratings do not significantly underperform the market. Charlo Molina and Moya Clemente (2010) analyze financial performance of Spanish SR companies and they highlighted that stocks of companies that are SR earn returns on excess over systematic risk, making them investment-attractive and they have a higher systematic risk. Basso and Funari (2014) evaluate the performance of European SRI funds relying on data envelopment analysis (DEA). Their empirical study suggests that it is possible to invest in a socially responsible manner without having to renounce financial reward. Miralles Marcelo, Miralles Quirós, and Miralles Quirós (2012) analyze the return performance of sustainable firms quoted on the Spanish stock market over the 2001–2010 period and they compare risk exposure for sustainable and conventional firms. They indicate that investing in SR companies provides a risk adjusted return negative. However, they also note that in economic crisis SR investment turns out to be safer. Finally, Capelle-Blancard and Monjon (2014) measure the financial performance of a sample of 116 French SRI mutual funds over the period 2004–2007. They results show that SRI funds do not outperform the market, whatever the performance measure considered.
Recently, several studies (see for example, Humphrey & Lee, 2011; Lee, Humphrey, Benson, & Ahn, 2010; Renneboog, Ter Horst, & Zhang, 2008b; Renneboog, Ter Horst, & Zhang, 2011) have proposed not to compare the performance of SRI funds with those of conventional funds, but to consider the relative performance between SRI funds. By doing this, they provide an in-depth analysis of the relationship between the selection process of SRI funds and their financial performances. The findings of these studies show there is a relationship between the screening intensity and SRI financial performance. In general, depending on parameters such as product category, time period, geographical market, benchmark and performance measure, studies may conclude different results about SRI. In addition, SRI is not a standard concept (Sandberg, Juravle, Hedesström, & Hamilton, 2009).
Quantitative modelisation of the goals of a SR investor is complicated and nowadays it is an open problem. In this sense, Hallerbach, Ning, Soppe, and Spronk (2004) have considered the difficulty of measuring the degree of SR of individual investments, given that a welfare function which includes all social aspects is not available. On the other hand, the UK Social Investment Forum website (UKSIF) indicates that though the majority of people agree with what are the ethical issues, each individual must decide if a specific investment meets her criteria: “different people have different views as to what is acceptable and how important a set issue is for them”. However, the UKSIF identifies what characterizes good SRI: “What they have in common is that they clearly state views on SEE issues. The key is to deliver and use information on the investments in such a way that those who invest may decide whether such investments are suitable for their clients and their pension funds” (UK Social Investment Forum, http://www.uksif.org/). Therefore, the design of SR portfolios requires information about the compliance with SR criteria by companies and investment fund management. Also, it is necessary information about individual or collective perception as to what is ethical or profitable for the Society (Cabello, Ruiz, Pérez-Gladish, & Méndez-Rodríguez, 2014). Both inputs have imprecision and so our proposal is to construct an objective that measures the SR Quality of a portfolio based on linguistic labels and a quantitative treatment using fuzzy aggregation operators.
The variety of financial instruments and opportunities for the SR investors are increasing constantly; SR funds are collective investment institutions whose object is to channel savings toward those companies or organizations which, in agreement with the ethical report of the fund, meet the criteria therein reflected. These financial products make up, currently, the main instrument of socially responsible investment.
The model we propose in this paper allows us to obtain a portfolio made up of SR funds which replicates or tracks the portfolio that an investor would have chosen if she did not take into account SEE considerations in her investment decisions. Because the financial sacrifice, as a consequence of limiting the financial assets to those that have been qualified as SR, is a major concern of this particular investment market, we consider it should be useful to have a tool that evaluates this possible financial loss and tries to minimize it, for the increasing demand by investors that make their investment decisions based on their ethical principles.
Several works close to ours are commented below. A pioneering research is carried out by Hallerbach et al. (2004) which give a practical approach for portfolio selection utilizing multi-attributive preference functions. Bilbao-Terol, Arenas-Parra, Cañal-Fernández, and Bilbao-Terol (2013) use the Hedonic Price Method in order to obtain an evaluation of SRI criteria that is integrated into a multi-objective mathematical programming model. Ballestero, Bravo, Perez-Gladish, Arenas-Parra, and Pla-Santamaria (2012) provide a financial–ethical bi-criteria model especially for SRI portfolio selection. Furthermore, studies like Abdelaziz, Aouni, and el Fayedh (2007) and Steuer, Qi, and Hirschberger (2007) argue that portfolio selection is a multi-objective problem. All of the mentioned papers also use multi-criteria methodologies like us but with different aims to that of the present work.
Drut (2010a) investigates the penalty for responsible investing. Social ratings are introduced in mean-variance optimization through linear constraints to explore the implications of considering a social responsibility (SR) threshold in the traditional Markowitz (1952) portfolio selection setting. Therefore, there are two main differences with our work: the portfolio minimizing the distance to its conventional peer is not searched and the SR Quality of the portfolio is not taking into account as an objective through the selection process. Dorfleitner and Utz (2012), expand the methodological spectrum of socially responsible investing. They introduce stochastic sustainability returns into safety first models (introduced by Roy, 1952) for portfolio choice. They propose as objective function a convex linear combination of the expected financial return and the expected social return and constraints of probability for controlling the risk. Therefore, Dorfleitner and Utz proposal shares with the current paper the use of downside risk measures and the inclusion of a sustainability objective into the modeling. However, our sustainability returns are fuzzy, i.e. have imprecision no probabilistic, instead of stochastic one, and beside their model does not look for minimizing the financial loss.
Our model runs in two stages. In the first one it is necessary to obtain the reference portfolio, made up exclusively of conventional funds. For the construction of the conventional portfolio the Prospect Theory (Kahneman & Tversky, 1979) has been used (net profits as the financial objective and error function as the utility function). We use an approach in two steps: calculate the efficient frontier with respect to two criteria, the expected value at the end (EVE) and the CVaR. On this efficient frontier we obtain the most preferred portfolio by the investor using the certainty-equivalent in the case of the error function utility.
In the second stage a portfolio is obtained made up exclusively by SR funds using the reference portfolio from the first stage as a level of aspiration or ideal point with respect to the financial performance of the preferred SR portfolio.
As a consequence the investor will have objectives as the relative wealth with respect to the reference portfolio and the SR-value of the portfolio. The relative wealth will be manipulated by means of its CVaR and the periodic values of the portfolio. The second objective is constructed in agreement with the social, environmental and ethical preferences of the investor. For this point we have used the Fuzzy Set Theory (Zadeh, 1965) to treat the imprecise assessments of the investor with respect to her preferences, motivations and/or social concerns. Bellman and Zadeh (1970) set the basic principles of decision making in fuzzy environments. When constructing a portfolio where ethical features are addressed, two problems arise: to represent uncertain knowledge about a certain parameter, and to represent a degree of satisfaction for the investor with regard to his/her social preference structure. Both problems have been handled by Fuzzy Decision Making in Multiobjective Programming models (see Bilbao, Arenas, Rodríguez, & Antomil, 2007; Bilbao-Terol, Arenas-Parra, & Cañal-Fernández, 2012; Gupta, Mehlawat, & Saxena, 2008; Huang, 2007; Kaya & Kahramana, 2010; Merigó & Gil-Fuente, 2010; Wu & Tsai, 2014; Zhang, Wang, Chen, & Nie, 2007).
There are many economic problems such as the selection of portfolios, where the choice of the best decision should be made taking into account several criteria. Multi-objective programming is a mathematical technique used to solve these types of problems. This approach involves acknowledging that the decision maker is responding to multiple objectives. Generally, objectives are conflicting; therefore, not all objectives can simultaneously reach their optimal values. Zopounidis and Doumpos (2013) present a detailed discussion and up-to-date review on two important areas of financial decision support, namely portfolio selection and corporate performance evaluation. Besides, they are also given to highlight how different multicriteria modeling approaches complement and enhance existing techniques from the areas of finance and operations research. There are a broad range of multi-objective methods such as Weighted Programming, Constraint Programming, Compromise Programming, Composite Programming, Reference Point Method and Goal Programming (GP). The latest was first introduced by Charnes, Cooper, and Ferguson (1955) and Charnes and Cooper (1961). Over the years, the GP model has become the most widely used approach in the field of multiple criteria decision making, particularly for portfolio selection problem. The major advantage of the GP is its inherent flexibility in handling decision-making problems with numerous conflicting objectives and incomplete or imprecise information (Caballero, Luque, Jolina, & Ruiz, 2005; Caballero, Gómez, & Ruiz, 2009; Chang, 2007; Romero, 1991, 2004). A detailed analysis of GP models and their applications can be found in the book of Jones and Tamiz (2010). Many decision makers prefer to seek solutions that are “good enough” or “close enough” rather than optimal. GP allows multiple objectives to be handled under a “satisficing philosophy”, developed by Simon (1956), expressed by means of the concept of goal. Designing a GP model involves the Decision Maker sets “aspiration levels” a priori for the objectives of his decision. Such targets, together with the objectives, constitute the “goals” of the problem. The pioneering applications of GP for portfolio selection are due to Lee and Lerro (1973). More recently, many other applications in this field have appeared in the literature (Abdelaziz et al., 2007; Arenas Parra, Bilbao Terol, & Rodriguez Uría, 2001; Bilbao et al., 2007; Hsin-Hung, 2008; Kaminski et al., 2009; Trenado, Romero, Cuadrado, & Romero, 2014). For an updated literature review on application of GP models to financial portfolio management from the 1970s to nowadays see Aouni, Colapino, and La Torre (2014).
In the last stage of our modeling process, a multi-objective model associated to the SR portfolio selection arises. Its objectives are the CVaR concerning to the relative loss with respect to the reference portfolio, the values of the portfolio on each scenario and the SR Quality of the portfolio. This multi-objective model is tackled by using the Goal Programming methodology. We have implemented the model using as a market 38 conventional and 12 SR investment funds domiciled in Spain. We have worked with the weekly price data from March 10, 2006 to December 31, 2009.
This paper is organized as follows. After this introduction, in Section 2 a brief review of the Copula Theory is presented. Section 3 is devoted to the constructing of the reference portfolio. From this, the following section shows the SR-portfolio selection process including the modeling of the SR-objective. Results are shown in Section 5 and the conclusions finish this paper.
2Copula TheoryEmpirical studies find that the assumption of normality of financial returns distribution is not hold. The non-normality has been examined using the skewness and the kurtosis. Some studies obtain evidence of negative skewness and excess kurtosis. Specifically, negative skewness indicates a higher probability of negative returns, that is, the market gives higher probability to decreases than increases in asset pricing while excess kurtosis makes extreme observations more likely than in the normal case, which means that the market gives higher probability to extreme observations than in normal distribution. Consequently, the linear correlation coefficient is no longer suitable and can largely lead to misleading results (Boubaker & Sghaier, 2013; Embrechts, McNeil, & Straumann, 1999; Embrechts, McNeil, & Straumann, 2002; Forbes & Rigobon, 2000). Furthermore, several researchers find evidence of asymmetry in the dependence between stock market returns (Ang & Bekaert, 2002; Ang & Chen, 2002; Das & Uppal, 2004; Hong, Tu, & Zhou, 2007; Patton, 2004) and between exchange rate returns (Beine, 2004; Li, 2011). In particular, stock market returns exhibit greater dependence during market downturns than market upturns and exchange rate returns seem to be more correlated in periods of depreciation that in periods of appreciation which increase the downside risk.
In order to reproduce the asymmetric dependence between financial returns, some studies propose to work with the concept of exceedance correlation (Ang & Chen, 2002) and the extreme value theory (Beine, Cosma, & Vermeulen, 2010; Hartmann, Straeman, & de Vries, 2004; Poon, Rockinger, & Tawn, 2004). A drawback of these methods, is that they are subject to the trouble of choosing the appropriate threshold and the use of the extreme value distribution such as Pareto distribution.
Other authors consider multivariate Generalized AutoRegressive Conditional Heteroskedasticity (GARCH) model with skewness (Harvey & Siddique, 1999) and/or kurtosis (Jondeau & Rockinger, 2003; Brooks, Burke, Heravi, & Persand, 2005). Also, several researches are based on regime-switching models (Ang & Bekaert, 2002; Ang & Chen, 2002). Although these models allow for time-varying conditional correlations, they cannot reproduce asymmetries in asymptotic tail dependence (Boubaker & Sghaier, 2013).
For the above reasons we use a semi-parametric approach based on a statistical tool: Copula Theory now being applied in Finance and Insurance (see, for example Boubaker & Sghaier, 2013; Bouyé, Durrleman, Nikeghbali, Riboulet & Roncalli, 2001; Cherubini et al., 2004; Cintas del Río, 2007; Dias & Embrechts, 2004; Embrechts, Lindskog, & McNeil, 2001; Keel, 2006; Meucci, 2006; Rank, 2002; Rivas & Cuesta, 2006; Romano, 2002) in order to carry out the market estimation. Nelsen (1999) is a standard reference on the subject of copulas. In this paper, we model multivariate distribution of invariants – in our market these are the weekly log returns on the funds – by means of a very general specification: each of the invariants is fitted independently of the different univariate distributions and the dependence of these invariants is modeled in terms of a multivariate copula.
The copulas are a suitable instrument with which to represent dependence relations among random variables across a joint probability distribution. In fact, the joint cumulative distribution function of random variables can be expressed as a copula function applied to the marginal distributions of each one of them. If the marginal distributions are continuous the copula is unique. This result known as Sklar's theorem (Sklar, 1959) is the most important one in the Copula Theory with a broad practical application given that it provides a tool for generating multivariate distributions with marginal distributions fixed in a way that the marginal univariate functions can have a separate structure from the structure of the copula.
Essentially, a copula is a multivariate distribution function defined over the hyper-cube unit with the marginals distributed uniformly.
2.1Definition of copulaA copula n-dimensional is a function C with the following properties:
From this definition, if F1, …, Fn are continuous univariate distribution functions then
is a multivariate distribution function with the marginals distributed uniformly because ui=Fi(xi) is a uniform random variable.2.2Sklar's theorem
Let F be an n-dimensional distribution function with the marginals F1(x1), …, Fn(xn) then there exists a copula C such that C(u)=F(F1−1(u1), …, Fn−1(un)). Furthermore, if C is an n-dimensional copula it is verified F(x)=C(F1(x1), …, Fn(un)).
Copula functions are important because they allow to decouple statistical inference into two parts: inference of the marginals and inference of the dependence. The modeling process in the copula framework has, therefore, two levels, one relative to the modeling of the marginals and the other relative to the modeling of the dependence of such marginals, that is, to choose the appropriate copula. For both levels it is possible to use parametric or nonparametric models.
In this paper we use the Student t copula (t-copula), a class of elliptic copula, widely accepted in financial literature; there are other types of copulas used in Finance and Insurance such as Archimedean copulas, extreme value copulas or Marshall-Okin copulas, which we have not considered here.
Elliptic distributions play an important role in Finance due to the fact that they constitute a source of multivariate distributions that have many of the good properties of multivariate normal distributions and facilitate obtaining multivariate models for extremes and other forms of non-normal dependency. Elliptic copulas are simply the copulas of elliptic distributions. Simulation using these type of distributions is simple and, as a consequence of Sklar's theorem so it is too with elliptic copulas. Furthermore, they allow to easily calculate range correlation and tail dependence coefficients. The concept of tail dependence describes the dependence of extreme values. In an approximate way, tail dependence is the probability of having a high (low) extreme value for Y given that one has a high (low) extreme value for X. We differentiate between superior and inferior tail dependence. For elliptic distributions, these two measurements are the same. In Finance, what is of interest is, above all, inferior tail dependence since it implies extreme concurrent losses.
According to the above mentioned, the t-copula corresponds to the distribution of the same name. Therefore, the multivariate t-copula is defined by:
where tv,R is the standardized Student t distribution with v degrees of freedom and shape matrix R, and tv denotes the standardized univariate Student t distribution with v degrees of freedom, that is, the margins of tv,R.
Demarta and McNeil (2005) study the properties of this copula and others related to it. Furthermore, Malevergne and Sornette (2003) and Dias and Embrechts (2004) obtain good results for this class of copula in comparison to the Archimedean. Romano (2002) proves that the use of a copula function different to the Gaussian captures extreme events more effectively. He studied a portfolio of 10 Italian shares using a t-copula, which improved the results of a normal copula in the estimation of risk measurement. Rank (2002) and Keel (2006), among others, obtained similar results on the use of the t-copula.
The performance of t-copulas utilized in this paper, both for modeling the conventional and the SR market, will be shown in the two following sections.
3Obtaining the reference portfolioThe aim is to find the portfolio with the financial characteristics desired by the SR investor when she neglects her SR concerns and behaves like a conventional investor.
3.1The marketOur market is made up of 38 conventional Spanish investment funds, therefore, N=38. We have weekly data of prices from March 10, 2006 to December 31, 2009. In total we have 995 observations. We have set an estimation interval of 1 week (5 days of trading) and a starting point from 3 years and 9 months and 20 days, the moment of investment is T=198. The investment horizon for the specific investor, h, has been set at one month (4 weeks). The names of the funds and their investment policy (according to memo 1/2009 of Feb 4 of the National Securities Market Commission, CNMV) i.e. the regulatory body of the Spanish Stock Market on the categories of collective investment institutions according to their investment policy) appear in Tables A1 and A2 of the Appendix.
3.1.1Estimation of the market invariantsAs market invariants we have chosen the non-overlapping weekly log returns on the funds:
being Pit the price of the fund i in the week t. In order to test the hypothesis of stationary a graphical test (see Fig. 1) and also the KPSS test (Kwiatkowski, Phillips, Schmidt, & Shin, 1992) have been applied. The KPS statistics for 37 funds are less than its critical value (0.347 for significance at the 10 percent); therefore, it is not possible to reject the hypothesis of stationarity at 10% for all series least one and for the series with a statistic value greater than 0.347 it is not possible to reject the hypothesis at 1%.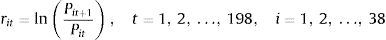
.")
We have chosen log returns instead of total returns or linear ones for two reasons. Firstly, combined returns are easy to project on any investment horizon unlike total and linear ones (Meucci, 2007). Secondly, distribution of both total returns and linear ones will not be symmetric. However, distribution of log returns is approximately symmetric. Also it is possible to model the joint distribution of the log returns of a set of funds by means of a distribution of elliptic type.
In this paper we model the marginal distributions of weekly log returns by means of a nonparametric approach using the empirical distribution smoothed by means of a Gaussian kernel. The modeling of the dependence structure is carried out by means of a t-copula applying the method of maximum likelihood in order to determine its parameters.
3.1.2Estimating the marginals: smoothing with Gaussian kernelThe main advantage of the empirical marginal distribution is that it is calculated easily for any real x from the sample {x1, …xT}:
being I the usual indicator function.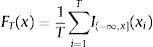
The main deficiency of the empirical marginal distributions is that the tails might not reflect the true tails of the underlying distribution.
It is possible to remedy this problem using kernel estimators for the densities:
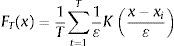
Being K the Gaussian kernel3 and ¿ the bandwidth. Following the conditions of Silverman (1986), the latter can be taken following an automatic criterion of the type: ¿=0.9T−1/5min(R/1.34, s), R and s being, respectively, the sample interquartile range and the sample standard deviation. Alternatively, the bandwidth can be found by using the least square cross-section validation. In this work we have used Gaussian kernel estimators for the marginal densities with automatic bandwidth.
In Figs. 2–5 a graphic description is shown of the weekly log returns of the first fund (Banif Estructurado FI) of our database. The histogram reflects a leptokurtic distribution (observe, also the kernel density adjusted in the bottom image); and the corresponding box-plot presents a series of high frequency in tails, which coincides with the information provided by the QQ plot that sets the empirical quantiles against those of a normal one, in which can be appreciated both the more fat tails of the empirical distribution than those which correspond to a normal distribution. Similar characteristics can be appreciated in the rest of the funds.


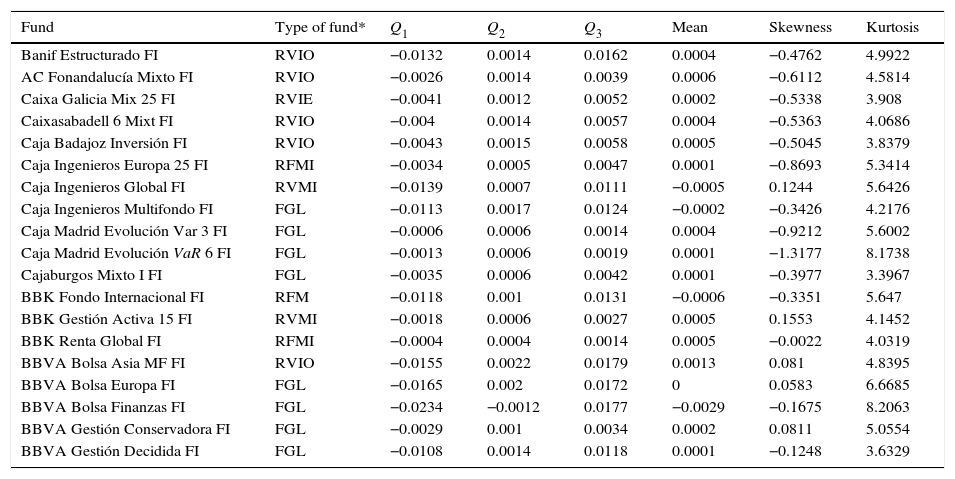
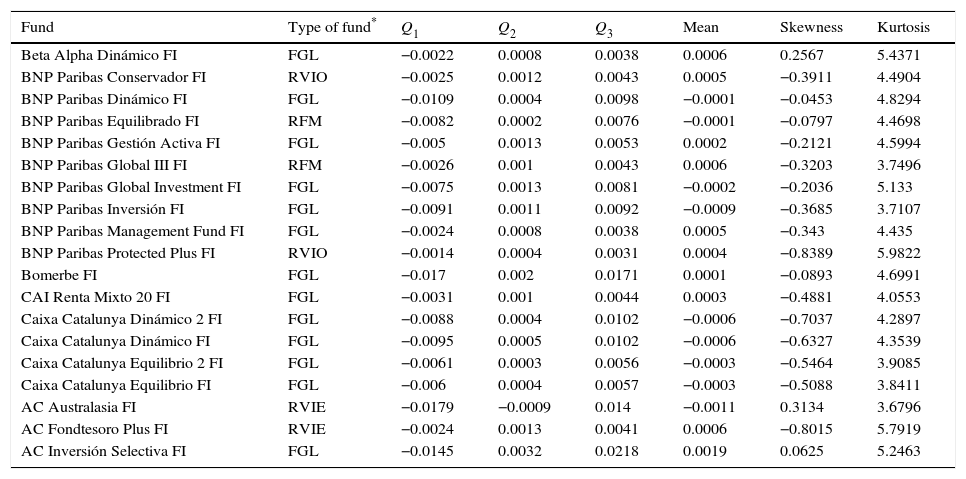
The numerical characteristics corresponding to each series of weekly log returns appear in Tables A1 and A2 in the Appendix, where Qi represents the ith quartile of the invariant distribution.
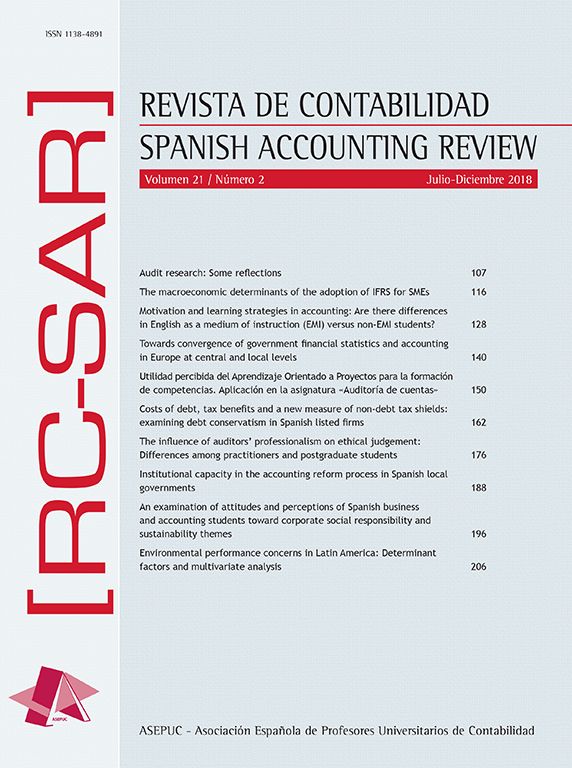
3.1.3Modeling the dependence structure: Student t copulasAs we have said, the modeling process in the copula framework has two levels, one relative to the modeling of the marginals and the other relative to the copula function linking such marginals. The modeling of the dependence structure of the univariate distributions is carried out by means of a t-copula applying the method of maximum likelihood (ML) in order to determine the parameters of the same. A summary of the results obtained follows (Table 1).
The low number of freedom degrees shows high tail dependence (Keel, 2006; Meucci, 2006). In summary, the estimations of the invariants, on the two levels, have been carried out according to:
- 1)
The marginal distributions by using Gaussian kernel densities. Also we find the quantiles of the smoothed marginals: Qs(u)=Fs−1(u)=inf{x/Fs(x)≤u} where Fs is the smoothed distribution function of the marginal s.
- 2)
The t-copula for the dependence structure.
We are now able to simulate the joint distribution of the weekly log returns of the funds in the following way in the following way:
- •
Simulate a random sample of the t-copula determined on Step 2: tSample with size equals to J=5000 scenarios.
- •
Apply the sample values into copula: Ft-Student(tSample)=U=(U1, ..., UN).
- •
Apply the quantiles, Qs, of the marginals into U: Qs(Us), then, the joint distribution of Qs(Us) follows the same distribution than the original data.
In Fig. 6 the smoothed, simulated and historical distributions appear for the first fund of the database. In this, one can appreciate the goodness of the fit. We have also applied the K-S test to the simulated and historical distributions. The result obtained allows us not to reject the hypothesis that the simulated and historical distributions come from the same distribution at a 95% confidence level. We have graphed the corresponding QQ plot to compare the quantiles of the distributions (Fig. 7).


Before going into the calculation of the reference portfolio, it is necessary to apply the distributions of the invariants to the fund prices. This involves, firstly, projecting the invariants onto the investment horizon (applying the square root rule). In our case, the projection factor is equal to four given that we pass from a weekly estimation horizon to a monthly investment horizon. Based on simulated weekly log returns, rit, it is possible to get a simulation of the fund prices according to the relation: Pij=PiTe∑i=14rit, j=1, ..., J.
3.2Portfolio optimalityIn this paper maximization of net profits (the difference between the final value of the portfolio and the amount invested) has been set as the financial objective of the investor. This objective is a consequence of the descriptive theory on decision making – Prospect Theory – developed by Kahneman and Tversky (1979).
In their theory they expressly emphasize that “ordinary people” have a structured perceptive model in order to recognize changes and differences rather than to appreciate absolute dimensions. Kahneman and Tversky point out that value is given as a result of the changes in economic states and not through states themselves. The experimental studies carried out by them allow us to conclude that individuals are adverse to risk when they are in situations of gain but, however, seek risk when they are in situations of loss (Kahneman, 2000; Kahneman, Knetsch, & Thaler, 1990; Tversky & Kahneman, 1992).
This is observed in the classic S-shaped graph (Fig. 8) set out by the authors. It shows that to earn 200 monetary units produces a pleasure, a utility of 25 units. If one looks at the lower lefthand quadrant one sees that to lose 200 monetary units produces a negative disutility of more than 50 units.
.")
The value function.
Source: Kahneman (2002).
Prospect Theory (Fung, 2006; Mason, Jason Shogren, & List, 2005; Nevins, 2004; Ricciardi, 2008; Shiller & Thaler, 2007; Shiller, 2006; Wakker, Timmermans, & Machielse, 2007) is empirically based and aspires to reflect how people behave in reality, not how they ought to behave if they were rational. It is not, then, a normative theory but empirical and positive. Its essential differences with respect to the Expected Utility Theory refer to three important questions: the definition of the alternatives upon which are human decisions are based; the value we give them; and the weighting we attribute to them in the light of their probability. Prospect Theory assumes that limited human intellectual capacity obliges us “to edit” or simplify the problems of decision-making that we are confronted with and we do this by following certain heuristic rules. The first and most important one is that when we judge alternatives we do not compare absolute values (this is the assumption of the Expected Utility Theory) but variations or changes with respect to a certain level that we take as a reference point. Thus, alternatives are assessed in terms of gains or losses with respect to a certain level of reference. This level of reference is usually that of the status quo but it might be a psychological level to which we aspire or even an arbitrary one. This behavior is, therefore, the basis for using net profits as the investor's objective.
The net profits random variable is represented on the real number line by means of the expected value at the end EVE and the CVaR associated with net profits at a certain confidence level, α.
In order to select the optimum portfolio under both criteria we proceed in two steps:
- 1.
Obtain an approximation of the efficient frontier CVaR-EVE.
- 2.
On the efficient frontier calculate the portfolio with maximum certainty-equivalent with utility associated with the objective of net profits. In order to do this an error function is used with an S-shaped according to that prescribed in Prospect Theory.
Let P=(P1, ..., PN) be the random vector of the prices of the financial instruments N at the end of the investment period T+h; x=x1,...,xN the portfolio to determine being xi the shares invested in the instrument i and C0 the initial available capital. The net loss variable for the period is the difference between the initial value and the final value of the portfolio: L(x, P;C0)=C0−P′x.
We have simulated J scenarios for the fund prices according to that set out above. By Pij we denote the price of the fund i in the scenario j and we suppose that the scenarios are equally probable. The minimization of the CVaR is carried out following the model proposed by Rockafellar and Uryasev (2000). Next we shall set out the algorithm to be applied and the results obtained.
Step 1. Approximate the efficient frontier CVaR-EVE.
Firstly, we calculate the EVE of the portfolio with minimum CVaRα solving the following linear problem:
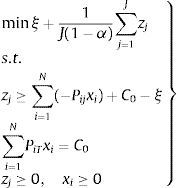
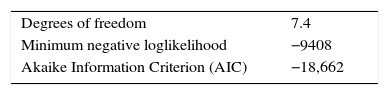
The efficient frontier is generated by solving the collection of problems where the CVaRα is minimized subject to the constraints that the EVE is greater than or equal to the values equally spaced between the EVE corresponding to the minimum CVaRα portfolio and the EVE obtained with the portfolio composed by the fund which has the greatest expected price per monetary unit invested, that is to say, we apply the ¿-constraint method, proposed by Haimes, Lasdon, and Wismer (1971), to the following bi-objective problem:
where E[Pi] is the price of the i asset. The solution for problem (8) allows us to obtain the efficient frontier (see Table 2).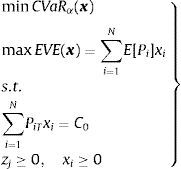
The efficient values CVaR and EVE (conventional funds).
| Portfolio | CVaR | EVE | Portfolio | CVaR | EVE |
|---|---|---|---|---|---|
| 1 | 0.9703 | 100.2124 | 21 | 12.2165 | 101.1426 |
| 2 | 1.0975 | 100.2589 | 22 | 12.8479 | 101.1892 |
| 3 | 1.4193 | 100.3054 | 23 | 13.4793 | 101.2357 |
| 4 | 1.8826 | 100.3519 | 24 | 14.1108 | 101.2822 |
| 5 | 2.4079 | 100.3984 | 25 | 14.7424 | 101.3287 |
| 6 | 2.9625 | 100.4449 | 26 | 15.3742 | 101.3752 |
| 7 | 3.5398 | 100.4915 | 27 | 16.0063 | 101.4217 |
| 8 | 4.1356 | 100.538 | 28 | 16.639 | 101.4682 |
| 9 | 4.7368 | 100.5845 | 29 | 17.2719 | 101.5147 |
| 10 | 5.345 | 100.631 | 30 | 17.9049 | 101.5613 |
| 11 | 5.9585 | 100.6775 | 31 | 18.5381 | 101.6078 |
| 12 | 6.5758 | 100.724 | 32 | 19.1714 | 101.6543 |
| 13 | 7.1956 | 100.7705 | 33 | 19.8046 | 101.7008 |
| 14 | 7.8182 | 100.817 | 34 | 20.4379 | 101.7473 |
| 15 | 8.4428 | 100.8636 | 35 | 21.072 | 101.7938 |
| 16 | 9.0693 | 100.9101 | 36 | 21.7075 | 101.8403 |
| 17 | 9.6965 | 100.9566 | 37 | 22.3438 | 101.8869 |
| 18 | 10.3252 | 101.0031 | 38 | 22.9822 | 101.9334 |
| 19 | 10.9547 | 101.0496 | 39 | 23.7095 | 101.9799 |
| 20 | 11.5851 | 101.0961 | 40 | 24.6455 | 102.0264 |
Step 2. Obtain the maximum certainty-equivalent portfolio on the efficient frontier. The investor's objective is the difference between the final value of the portfolio and the amount invested (net profits):
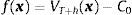
We use the error function to model the investor's utility – with S-shaped according to Prospect Theory (Kahneman & Tversky, 1979) – being η a positive parameter which we have set equal to 0.5 (Meucci, 2007):
where er(x)=2π∫0xe−u2du. The domain of er(x) is the whole real axis; therefore, this function describes the attitude toward risk in the case of gains: positive values of the objective and in the case of losses, i.e., negative values of the objective. The expression for the Arrow–Pratt's coefficient of risk aversion corresponding to the error function reads:therefore, assuming η>0, when the investor faces net gains, i.e. f(x)>0, the Arrow–Pratt's coefficient is positive and thus the investor is risk averse. On the contrary, if the objective is negative, i.e. there is a net losses situation, then, the Arrow–Pratt's coefficient is negative, so, the investor is risk prone and is willing to pay a premium to invest in risky assets.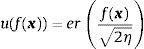

We calculate the utility of each efficient portfolio using sample prices of the funds – according to what we have set out in the previous section- and from this, its certainty-equivalent (CE), that is, the risk-free amount of money that would make the investor as satisfied as the risky portfolio. The CE is calculated as the inverse of the utility on the expected utility. In our case the CE reads:
where U¯ is the expected utility (the average of utilities).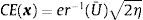
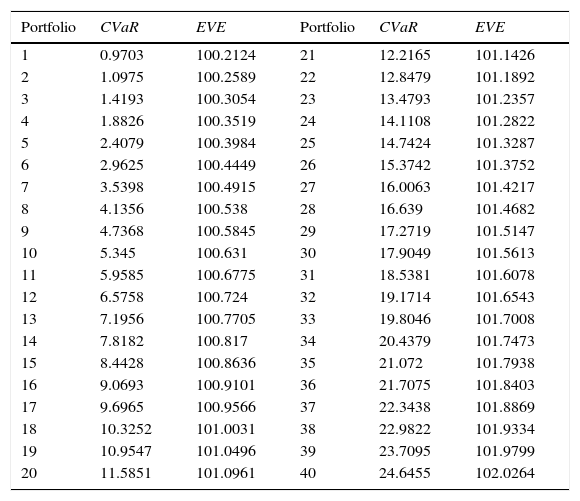
The maximum CE on efficient portfolios determines the reference portfolio x*, which in this case study turns out to be the efficient portfolio number 3, whose composition and characteristics are included in Table 3:
Composition and characteristics of the reference portfolio.
| Composition: | |
| BBK Renta Global FI | 90.7152 € |
| BBVA Bolsa Asia MF FI | 1.8498 € |
| Beta Alpha Dinámico FI | 4.6692 € |
| AC Inversión Selectiva FI | 2.7659 € |
| Characteristics: | |
| EVE | 100.3054 |
| CVaR | 1.4193 |
| VaR | 0.9481 |
| Performance (EVE/CVaR) | 70.6724 |
5th percentile values of the distribution=99.0519=100−VaR.
Frequency of portfolio under 100−VaR=249/5000=0.0498≤1−α.
Therefore, the probability that the monetary value of the portfolio is less than 99.0519 is less than 0.05 and the EVE of the portfolio conditional on the value is less than 100-VaR is equal to 98.5789. Fig. 9 shows the results of the steps that allow us to determine the reference portfolio.
4Obtaining the socially responsible portfolio
In the second stage a portfolio is obtained made up exclusively by SR funds using the reference portfolio from the first stage as a level of aspiration or ideal point with respect to the financial performance of the preferred SR portfolio.
As a consequence the investor will have as objectives the relative wealth with respect to the reference portfolio and the SR-value of the portfolio. The relative wealth will be manipulated by means of its CVaR and the periodic values of the portfolio. The second objective is constructed in agreement with the social, environmental and ethical preferences of the investor.
4.1The marketIn this stage the market is composed of 12 socially responsible funds together with the reference portfolio constructed previously. The historical series go from the period already indicated (March 10, 2006 to December 31, 2009) and have been dealt with in the same way as in the previous stage; therefore here also we have worked with weekly log returns which we have checked to be market invariants (the KPSS statistics for all funds are less than its critical value, 0.347, for significance at the 10 percent).
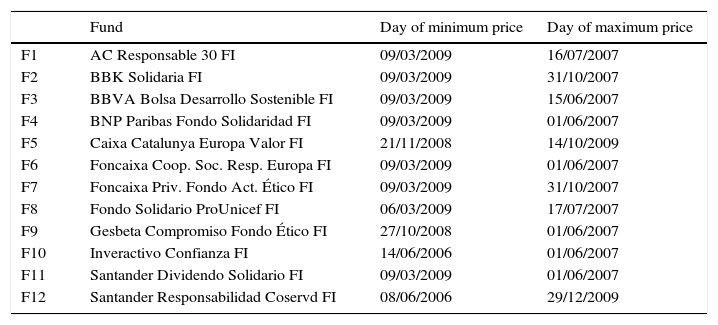
The study of our SR mutual funds database shows the sharp drop in the last quarter of 2008 (coinciding with the global financial crisis) and early 2009. However, the subsequent behavior of the funds is unalike; for example, some of them have recovered dramatically better as in the case of Santander Responsabilidad Coservd FI or Caixa Catalunya Europa Valor FI, at the same time that others such as Gesbeta Compromiso Fondo Ético FI or Foncaixa Coop. Soc. Resp. Europa FI have failed to recover their previous levels.
The graphs of the time series of funds and dates where the minimum and maximum prices occurred have been included in the Appendix (Figs. A1–A12 and Table A3).
4.1.1Estimation of the market invariantsIn order to carry out this task we follow the same steps as those already commented upon in stage 1, that is, we apply the t-copula fitting where the marginal distributions are modeled as Gaussian kernel smoothed distributions. We have made a study of the marginals parallel to that done for the case of conventional funds.
For the first SR fund, the histogram (Fig. 10) reflects a leptokurtic distribution and the corresponding box-plot presents a series of high frequency in tails, which coincides with the information showed in the QQ-plot (Fig. 11), a plot of the quantiles of the empirical distribution against those of a normal one, in which the tails of our empirical distribution are fatter than the tails of the normal distribution. Similar characteristics can be appreciated for the rest of the funds.


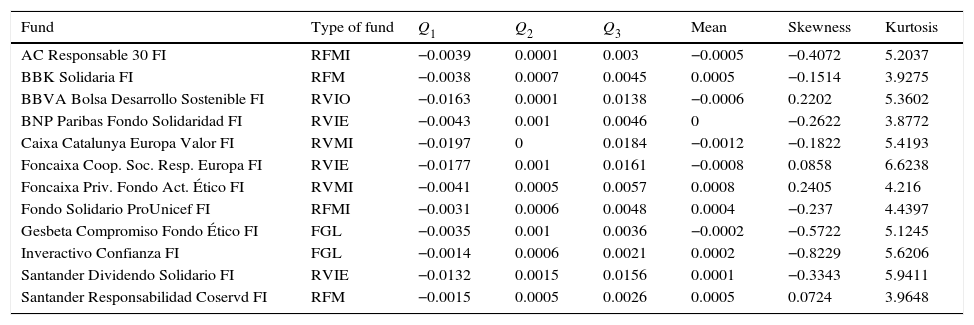
The numerical characteristics corresponding to each series of weekly log returns appear in Table 4, where Qi represents the ith quartile of the distribution of the invariant.
The numerical characteristics to each series of weekly log returns.
| Fund | Type of fund | Q1 | Q2 | Q3 | Mean | Skewness | Kurtosis |
|---|---|---|---|---|---|---|---|
| AC Responsable 30 FI | RFMI | −0.0039 | 0.0001 | 0.003 | −0.0005 | −0.4072 | 5.2037 |
| BBK Solidaria FI | RFM | −0.0038 | 0.0007 | 0.0045 | 0.0005 | −0.1514 | 3.9275 |
| BBVA Bolsa Desarrollo Sostenible FI | RVIO | −0.0163 | 0.0001 | 0.0138 | −0.0006 | 0.2202 | 5.3602 |
| BNP Paribas Fondo Solidaridad FI | RVIE | −0.0043 | 0.001 | 0.0046 | 0 | −0.2622 | 3.8772 |
| Caixa Catalunya Europa Valor FI | RVMI | −0.0197 | 0 | 0.0184 | −0.0012 | −0.1822 | 5.4193 |
| Foncaixa Coop. Soc. Resp. Europa FI | RVIE | −0.0177 | 0.001 | 0.0161 | −0.0008 | 0.0858 | 6.6238 |
| Foncaixa Priv. Fondo Act. Ético FI | RVMI | −0.0041 | 0.0005 | 0.0057 | 0.0008 | 0.2405 | 4.216 |
| Fondo Solidario ProUnicef FI | RFMI | −0.0031 | 0.0006 | 0.0048 | 0.0004 | −0.237 | 4.4397 |
| Gesbeta Compromiso Fondo Ético FI | FGL | −0.0035 | 0.001 | 0.0036 | −0.0002 | −0.5722 | 5.1245 |
| Inveractivo Confianza FI | FGL | −0.0014 | 0.0006 | 0.0021 | 0.0002 | −0.8229 | 5.6206 |
| Santander Dividendo Solidario FI | RVIE | −0.0132 | 0.0015 | 0.0156 | 0.0001 | −0.3343 | 5.9411 |
| Santander Responsabilidad Coservd FI | RFM | −0.0015 | 0.0005 | 0.0026 | 0.0005 | 0.0724 | 3.9648 |
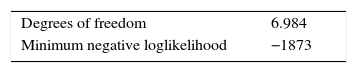
In the second level of the invariant modeling, the copula has been obtained (Table 5). Again, the low number of degrees of freedom of the t-copula shows high tail dependence.
4.2Optimality of the SR portfolio4.2.1Financial objectiveGiven that we are attempting “to track” the reference portfolio, the financial objective of the investor is the relative wealth with respect to this portfolio. Therefore the objective is the difference between the value at the end of the investment horizon of the SR portfolio, x, made up exclusively of SR funds and the value of the reference portfolio, x*. As surrogates on the real line of this random objective we consider:
- •
the CVaR concerning the relative loss with respect to the reference portfolio:
- •
the values of the relative wealth on each scenario:
Aside from the financial objective, substituted by its real surrogates, we have considered an objective relative to the ethical quality of the portfolio in relation to the interests of the investor. We have tackled the treatment of this objective from a subjective perspective for a specific investor.
The methodology used has been Fuzzy Logic. Thus we propose to evaluate the ethical quality of an investment fund by means of an indicator we have called SR Quality and which evaluates in a aggregated way, while attending the preferences of the investor, the SR characteristics of investment funds. According to Barracchini (2007), the SR Quality of each fund is a subjective measure, referring to the qualitative characteristics of the fund and whose value is referred to the ethical preferences of the investor.
The method uses a scale of seven linguistic labels that allow the investor to express the importance she gives to each characteristic considered in the evaluation of the funds and, in a similar way, the degree to which these funds meet each of these characteristics.
A fuzzy score is obtained for each fund aggregating by means of fuzzy arithmetic the weights and the compliance with the characteristics. Thus what we shall call the fuzzy SR Quality of the fund is determined. With the purpose of obtaining a real number comprised between 0 and 1 in order to represent the ethical quality of the fund we construct a satisfaction set and the fuzzy SR Quality of the fund is evaluated on this.
The construction of the SR Quality indicator of a fund consists of five steps that we shall now describe:
- 1.
Select the characteristics of social responsibility in order to evaluate the universe of funds (see Table A4). These characteristics which we have taken as reference are set out in the EIRIS Green and Ethical Funds Directory and are the ones which are most often included in the investment policies of this type of funds (see Bilbao-Terol et al., 2012).
- 2.
Determine a weight, w˜j, for each characteristic in accordance with the considerations of the investor about the importance of same with respect to the social responsibility profile of the portfolio. We represent these weights by means of a linguistic scale (see Fig. 12) comprising seven labels: null, very low, low, medium, high, very high and total. These labels are defined by means of seven fuzzy triangular numbers whose support is the interval [0,10].
- 3.
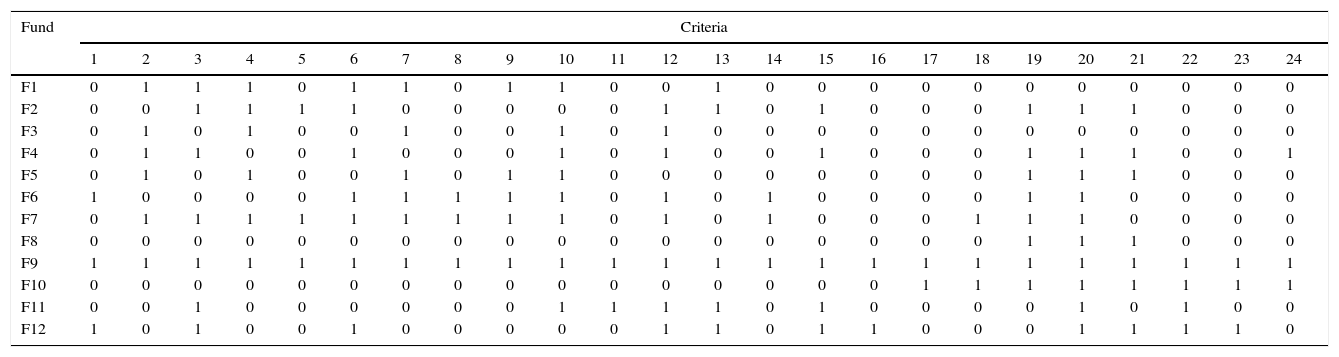
Evaluate compliance, c˜ij, of the fund i with each of the characteristics j selected in the first step. Therefore, c˜ij is a binary variable. An expert can undertake this evaluation using data provided by specialized organizations (e.g. Social Investment Forum (SIF), VIGEO and Morningstar Ltd.) and by means of the information contained in the fund reports (Table A5).
- 4.
Determine the total fuzzy weighted score for each fund i.e. the fuzzy SR Quality of the fund. To do this we use fuzzy arithmetic: adding up for all the characteristics the weighted evaluations of the fund. Thus we obtain the fuzzy number a˜i with extremes ai1, ai3 and kernel ai2. The support of a˜i will be contained in the interval [0, No. of characteristics×10].
- 5.
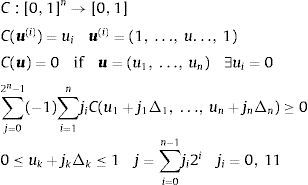
Determine the SR Quality of the fund i. In order to define this crisp score we shall take into account the interests of the investor represented by a fuzzy goal and the value of the SR Quality fuzzy of ith fund: V(a˜i) (Delgado, Vila, & Voxman, 1998).


In order to construct a fuzzy goal it is necessary that the investor establishes the values of two parameters: g0 and g1. The first registers the minimum ethical quality below which the investor will obtain no satisfaction, on the opposite extreme, g1 registers the threshold upon which the investor expresses total satisfaction with the ethical quality of the fund. Therefore the following inequality must be verified: 0≤g0≤g1≤(No. of characteristics×10).
The parameters g0 and g1 are determined by the level of exigency on the part of the investor regarding the social responsibility of the funds and also with regard to the characteristics in which she is interested – those with a no null weight. In this paper we have fixed the following values for both parameters (where NW represents the characteristics with null weight):
that is, the investor will obtain a greater satisfaction than 0 provided that the fund achieves an aggregated score equal to the number of characteristics in which she is interested in, i.e. a mean of 1 in such characteristics and will feel totally satisfied if a mean of 8 as minimum is reached in such characteristics. Finally SR Quality of the fund i, ai, is obtained as the membership degree of V(a˜i) in the fuzzy goal (Fig. 13). Therefore, the SR Quality of fund i is a number between 0 and 1.

Properties of the SR Quality
Here we display some of the properties of the proposed indicator which guarantee a modeling that is coherent with the preferences of the investor:
- -
The fuzzy SR Quality of the fund i increases with the weights and with the evaluation of compliance.
- -
The value of the fuzzy SR Quality of the fund i increases with movements of the support and the kernel toward the right (see Antomil Ibias, 2005).
- -
Set the parameters g0 and g1, the membership degree, ai, is no decreasing with V(a˜i).
- -
The movements toward the right of g0 and g1 (increases the investor's exigency level) give a decreasing (no strict) of the SR Quality of the fund i.
We assume that the SR Quality is additive. Consequently, the SR Quality of portfolio x is given by aggregating the SR Quality of the component funds:
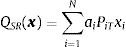
This linearity hypothesis (see Barracchini, 2007; Scholtens, 2009; Drut, 2010a, 2010b) is often used by practitioners to SR-rate financial indices.
The two objectives (financial and ethical ones) are incorporated in a GP model, that will be formulated following.
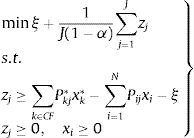
4.2.3GP model for SR-portfolio selectionIn order to use a GP approach for a multi-objective problem it is necessary that the DM establishes aspiration levels for each goal (Ignizio, 1976; Tamiz, Jones, & Romero, 1998). For the portfolio values on each scenario these levels are the corresponding values of the reference portfolio; for the CVaR the level of aspiration (ALCVaR) can be fixed as the CVaR of a portfolio which follows that of the reference one but without taking into account its ethical quality. It is also possible that this level of aspiration could have been proposed by the investor herself.
In order to fix the level of aspiration of the goal associated with the ethical quality of the portfolio, we propose to interact with the investor in two points. Firstly, we construct a “smooth” satisfaction function in function of the maximum and minimum values of the SR Quality in the universe of the funds (see Fig. 14): ia0≥minai×C0 and ia1≤maxai×C0.

The second interaction with the investor consists in her fixing a degree of satisfaction β by means of which the aspiration level (AL) for SR Quality goal is obtained in the following way: AL is the value in interval ia0,ia1 such that its membership degree to fuzzy goal is equal to β (see Fig. 14).
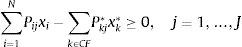
Once defined the goals and the constraints included in the set X we propose the following GP model in order to obtain the SR portfolio tracking the reference one.
5Results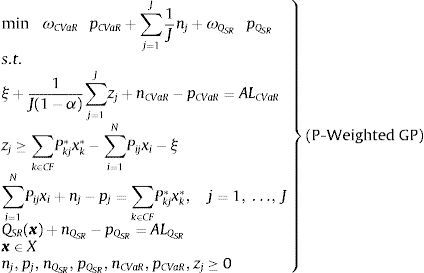
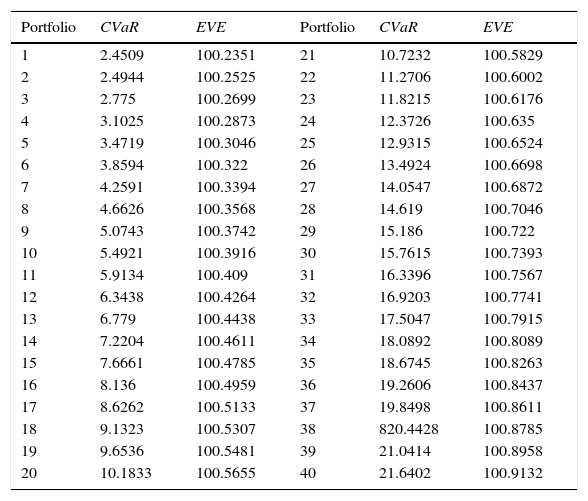
We present in Fig. 15 the efficient frontier respect to the two financial objectives, CVaR (relative to the net profits) and VFE.

The efficient values CVaR and EVE appear collected in Table 6. The outperformance of the conventional funds relative to the SR funds is noticed. The conventional efficient frontier is above that SR one (by comparison of Table 2 with Table 6).
The efficient values CVaR and EVE (SR funds).
| Portfolio | CVaR | EVE | Portfolio | CVaR | EVE |
|---|---|---|---|---|---|
| 1 | 2.4509 | 100.2351 | 21 | 10.7232 | 100.5829 |
| 2 | 2.4944 | 100.2525 | 22 | 11.2706 | 100.6002 |
| 3 | 2.775 | 100.2699 | 23 | 11.8215 | 100.6176 |
| 4 | 3.1025 | 100.2873 | 24 | 12.3726 | 100.635 |
| 5 | 3.4719 | 100.3046 | 25 | 12.9315 | 100.6524 |
| 6 | 3.8594 | 100.322 | 26 | 13.4924 | 100.6698 |
| 7 | 4.2591 | 100.3394 | 27 | 14.0547 | 100.6872 |
| 8 | 4.6626 | 100.3568 | 28 | 14.619 | 100.7046 |
| 9 | 5.0743 | 100.3742 | 29 | 15.186 | 100.722 |
| 10 | 5.4921 | 100.3916 | 30 | 15.7615 | 100.7393 |
| 11 | 5.9134 | 100.409 | 31 | 16.3396 | 100.7567 |
| 12 | 6.3438 | 100.4264 | 32 | 16.9203 | 100.7741 |
| 13 | 6.779 | 100.4438 | 33 | 17.5047 | 100.7915 |
| 14 | 7.2204 | 100.4611 | 34 | 18.0892 | 100.8089 |
| 15 | 7.6661 | 100.4785 | 35 | 18.6745 | 100.8263 |
| 16 | 8.136 | 100.4959 | 36 | 19.2606 | 100.8437 |
| 17 | 8.6262 | 100.5133 | 37 | 19.8498 | 100.8611 |
| 18 | 9.1323 | 100.5307 | 38 | 820.4428 | 100.8785 |
| 19 | 9.6536 | 100.5481 | 39 | 21.0414 | 100.8958 |
| 20 | 10.1833 | 100.5655 | 40 | 21.6402 | 100.9132 |
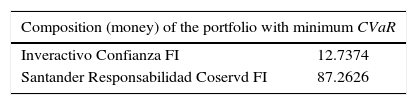
The composition of the first portfolio of the efficient frontier is given in Table 7, which shows the most similar financial parameters to the reference portfolio.
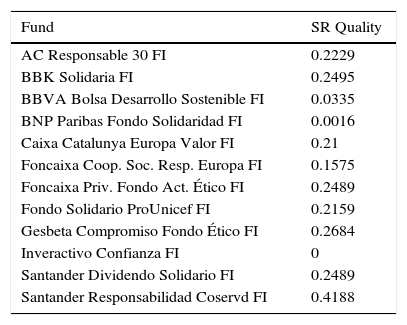
The SR Quality of each fund (with the parameters set by the investor) has been gathered in Table 8.
SR Quality of each fund.
| Fund | SR Quality |
|---|---|
| AC Responsable 30 FI | 0.2229 |
| BBK Solidaria FI | 0.2495 |
| BBVA Bolsa Desarrollo Sostenible FI | 0.0335 |
| BNP Paribas Fondo Solidaridad FI | 0.0016 |
| Caixa Catalunya Europa Valor FI | 0.21 |
| Foncaixa Coop. Soc. Resp. Europa FI | 0.1575 |
| Foncaixa Priv. Fondo Act. Ético FI | 0.2489 |
| Fondo Solidario ProUnicef FI | 0.2159 |
| Gesbeta Compromiso Fondo Ético FI | 0.2684 |
| Inveractivo Confianza FI | 0 |
| Santander Dividendo Solidario FI | 0.2489 |
| Santander Responsabilidad Coservd FI | 0.4188 |
The parameters ia0 and ia1, which determine the function of satisfaction of the SR Quality have been set in the following way: ia0=a6×C0=15.7468, ia1=maxai×C0=41.8831.
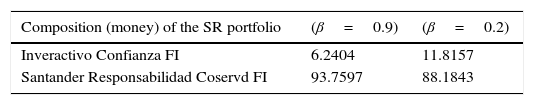
We present, in first place, the results when we take β=0.9, that is, the investor wishes to reach at least one degree of satisfaction of 0.9 in the SR Quality of her portfolio. This portfolio does not reach the level of aspiration relative to the CVaR but does with respect to the SR Quality; in 125 scenarios the SR Portfolio Value is less than the value of the reference portfolio minus the VaR and the Expected Value of the SR Portfolio in this situation is equal to 98.2688. As can be observed, the obtained portfolio is resembled the first portfolio of the financial efficient frontier (minimum CVaR), which is the most similar to the reference portfolio (see Table 7). If we consider β=0.2, the investor is less exigent in ethical quality and the financial results draw closer to those of the first portfolio of the efficient frontier (Tables 9 and 10). The low SR score of Inveractivo Confianza FI fund is balanced by the high SR score of the Santander Responsabilidad Coservd FI fund and the combination of these funds gives the financial values desired by the investor.
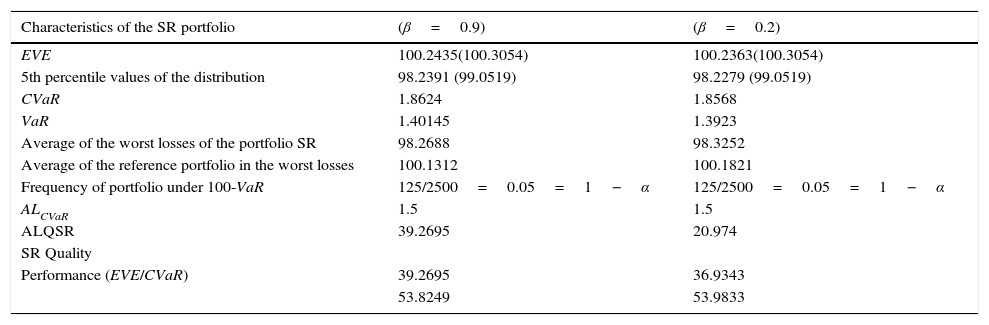
The characteristics of the SR portfolios.
| Characteristics of the SR portfolio | (β=0.9) | (β=0.2) |
|---|---|---|
| EVE | 100.2435(100.3054) | 100.2363(100.3054) |
| 5th percentile values of the distribution | 98.2391 (99.0519) | 98.2279 (99.0519) |
| CVaR | 1.8624 | 1.8568 |
| VaR | 1.40145 | 1.3923 |
| Average of the worst losses of the portfolio SR | 98.2688 | 98.3252 |
| Average of the reference portfolio in the worst losses | 100.1312 | 100.1821 |
| Frequency of portfolio under 100-VaR | 125/2500=0.05=1−α | 125/2500=0.05=1−α |
| ALCVaR | 1.5 | 1.5 |
| ALQSR | 39.2695 | 20.974 |
| SR Quality | ||
| Performance (EVE/CVaR) | 39.2695 | 36.9343 |
| 53.8249 | 53.9833 |
The values of the reference portfolio appear in brackets.
The values of the SR portfolio and the reference portfolio can be observed in Figs. 16 and 17.
.")
.")
Table 10 shows the financial cost of investing in SR funds. Both financial objectives, CVaR and EVE, are worse in the SR portfolio. However, the proposed modeling does its job: it finds the SR portfolio, the most similar to the preferred financial portfolio. The investor can now choose between investing in SR market attending to her SEE concerns or in conventional market with better economic reward and less risk. A possible decision framework where the investor separates her investment budget in two Mental Accounts (Thaler, 1999), one conventional and other SR, could also be addressed with this proposal.
As was aforementioned, it has not been proved the underperformance of SR market anywhere, anytime; therefore the financial sacrifice found in this study is not extrapolated to any market. However, the usefulness of the proposed tool remains in any case of performance of the SR market with respect to the conventional one.
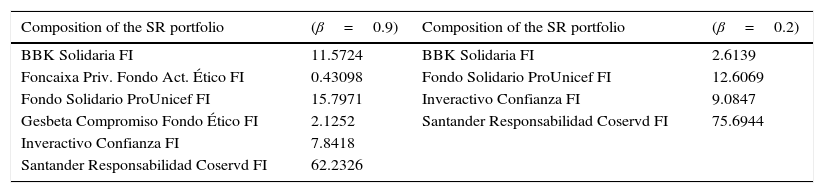
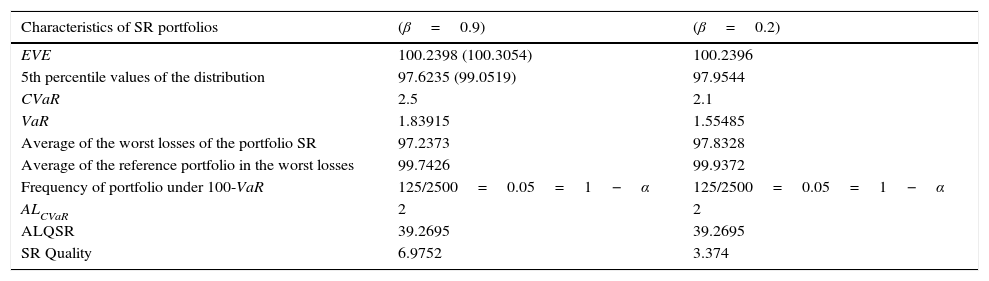
5.1Sensitivity analysisWe make a sensitivity analysis supposing that the Santander Responsabilidad Coservd FI fund – which is the one with the higher SR Quality and figures in large proportion in all the portfolios because, furthermore, it is low risk – had a SR Quality equal to 0. We show below the portfolios obtained for β=0.9andβ=0.2 (Tables 11 and 12).
The composition of the SR portfolios.
| Composition of the SR portfolio | (β=0.9) | Composition of the SR portfolio | (β=0.2) |
|---|---|---|---|
| BBK Solidaria FI | 11.5724 | BBK Solidaria FI | 2.6139 |
| Foncaixa Priv. Fondo Act. Ético FI | 0.43098 | Fondo Solidario ProUnicef FI | 12.6069 |
| Fondo Solidario ProUnicef FI | 15.7971 | Inveractivo Confianza FI | 9.0847 |
| Gesbeta Compromiso Fondo Ético FI | 2.1252 | Santander Responsabilidad Coservd FI | 75.6944 |
| Inveractivo Confianza FI | 7.8418 | ||
| Santander Responsabilidad Coservd FI | 62.2326 |
The characteristics of the SR portfolios.
| Characteristics of SR portfolios | (β=0.9) | (β=0.2) |
|---|---|---|
| EVE | 100.2398 (100.3054) | 100.2396 |
| 5th percentile values of the distribution | 97.6235 (99.0519) | 97.9544 |
| CVaR | 2.5 | 2.1 |
| VaR | 1.83915 | 1.55485 |
| Average of the worst losses of the portfolio SR | 97.2373 | 97.8328 |
| Average of the reference portfolio in the worst losses | 99.7426 | 99.9372 |
| Frequency of portfolio under 100-VaR | 125/2500=0.05=1−α | 125/2500=0.05=1−α |
| ALCVaR | 2 | 2 |
| ALQSR | 39.2695 | 39.2695 |
| SR Quality | 6.9752 | 3.374 |
The values of the reference portfolio appear in brackets.
As can be appreciated, the change to the SR rating in the Santander Responsabilidad Coservd FI fund, modifies the portfolios in the sense that its weight in the portfolio diminishes where the investor is very exigent regarding the SR profile (β=0.9) and increases when such exigency is lowered, that is, in this case, the investor chooses between low risk and high SR Quality. The results obtained in this work show several features of the SR Spanish market. Our SRI financial market did not have the high levels of development seen in other European financial markets, such as France, Italy or the Netherlands, where interest in SRI began during 1999 (EUROSIF, 2012). Spain is one of the European countries with the lowest volume of capital invested in SRI mutual funds. One of the most limiting factors that may explain the underdevelopment of SRI market is that Spanish SRI financial market does not take into account the investor preferences (Bilbao-Terol and Cañal-Fernández, 2014).
6ConclusionsThe new approach of investing, the SRI, attracts to a great number of investors and this fact should be taken into account by researches in financial fields in order to propose new methodologies for supporting to this class of investors. Investors in SRI funds pursue two types of goals: the economic rational goal of wealth-maximization and social responsibility. SRI investors are socially conscious and derive non-financial utility by holding assets consistent with their ethical and social values.
In this contribution, we present a model in the framework of SRI. Our proposal for selecting portfolios of SRI mutual funds uses copula functions in order to model the dependence structure of the fund returns. Furthermore, the modeling evaluates the ethical degree of the obtained portfolio. The financial performance of the SR portfolio is assessed against a portfolio made up of conventional mutual funds.
Our proposal is based on the most recent methodologies that have burst into the financial research as well as the practitioners. Behavioral Finance is a new paradigm in Decision Theory. Downside risk measures are institutionally supported by Basel Accords and by financial practice, such as private banking and financial and risk management. Copula Theory is a useful tool for multivariate modeling in financial markets. Using Fuzzy Set Theory could be more surprising into a financial framework; we have taken advantage of this methodology in order to model the imprecise preferences of the SR investors with respect to the different characteristics encompassed in the SR concept.
The good results obtained through the application of the Copula Theory for the estimation of the joint distribution of assets allow us to conclude that this theory is very useful for solving the portfolio selection even without very small number of assets. A convenient property of the model proposed is that it is not necessary to work with the same class of distribution for the marginals. Copula Theory gives a flexible tool that models the tail dependence that is present in the financial markets.
The emergence of the Behavioral Finance has been attended by the design of a portfolio selection model. Thus, Prospect Theory has been used in order to define the optimality of the reference portfolio: a utility function with S-shaped and setting the reference point as the capital that is invested at the beginning of the holding period and a downside risk measure, the CVaR relative to net profits.
With our model the investor knows the financial sacrifice she takes on by investing in funds classified as socially responsible and we proved that financial loss is associated with the trio returns, risk and ethical quality. The occurrence and valuation of this financial loss are a major concern of the SR investment market; therefore, we consider it useful to have a tool that evaluates this possible cost and tries to minimize it. The joint use of the CVaR associated with the loss relative to the reference portfolio and the comparison of two portfolios on each scenario allows us to model the problem of tracking.
In managing the ethical preferences of the investor, which are usually expressed in linguistic terms, the Fuzzy Set Theory has been shown to be especially useful. Notice that there is not a standard profile for this class of investors; therefore an analysis of their particular attention to the ethical values is necessary. Then they can be more comfortable evaluating the SR issues by linguistic labels and flexible graduations. The Fuzzy Set Theory has shown its power in these situations where imprecise judgments should be tackled. Due to this Fuzzy Technology has been used in a broad field of applications. Goal Programming has allowed a joint treatment of all the objectives of the investor. This methodology allows the interaction of the investor in two aspects of the problem: setting the aspiration levels – in this model for the ethical quality and for the CVaR – and weighing the objectives.
The results obtained in this work should lead to a reflection about the SR Spanish market. It likes more inefficient than those of its neighbors. Spanish SRI financial market had not the high levels of development seen in other European financial markets, such as France, Italy or the Netherlands, where interest in SRI began during 1999. Spain is one of the European countries with the lowest volume of capital invested in SRI mutual funds. The constraint facing this research is the small number of SRI funds in Spain. In this sense, our objective in future researches is to work with European SRI funds (Eurozone, UK), where the SR investment universe is much broader; to extend the time period and to study the performance of SRI during the financial crisis. Moreover, the studied Spanish SRI funds have a strong religious component. It would be interesting to analyze whether the Spanish SRI funds today have expanded their range of social concerns.
Some of the limitations and extensions of this study which could be included in future research are commented below.
In order to reduce the computational burden, the obtaining of the reference portfolio could be replaced either the use of only one conventional market index or by the obtaining of a portfolio composed by several conventional market indexes. The conventional market indexes could behave as proxies for the reference portfolio. In this case, the construction is easier either because it would not be necessary to run the Stage 1, or the number of assets is drastically reduced in it.
It would be possible to use GARCH models to solve heteroskedasticity problems, jointly with Copula Theory. We try to estimate the suitable copula for modeling the dependence structure between the corresponding filtered returns. In addition, the performance of Arquimedean copulas could be analyzed as an alternative to t-copulas utilized in the current study.
Regarding the modeling of social preferences of investors, it would be interesting to consider other aggregators – different from the sum, and other functions of satisfaction in the design of the SR Quality of each fund. Aggregation by weighted sum of the sustainable characteristics fulfilled by the Funds involves a compensation between them in order to investors with very intransigent ethical principles may not be appropriate. In this case, modeling ethical preferences of the investor would be more complicated. In this article, we have worked with binary variables to represent the fulfillment of the ethical characteristics of the funds. It would be also possible to use a graduated scale for such compliance.
The extension of the model to stock markets and domestic and foreign public debt would lead, in the first case, the search for information on compliance with sustainability criteria by companies. To do so, we would resort to their CSR reports. In the case of sovereign debt, the sustainable development indexes (ANS, EPI, HDI, ECF, Corruption Index, etc.) would be used.
Conflict of interestThe authors declare no conflict of interest.
We would like to thank the anonymous referees for their valuable comments and suggestions. The authors wish to gratefully acknowledge the financial support from the Spanish Ministry of Education, Project ECO2011-26499.


Fund name and investment policy (Spanish Association of Investment and Pension Funds, INVERCO).
| Fund | Type of fund* | Q1 | Q2 | Q3 | Mean | Skewness | Kurtosis |
|---|---|---|---|---|---|---|---|
| Banif Estructurado FI | RVIO | −0.0132 | 0.0014 | 0.0162 | 0.0004 | −0.4762 | 4.9922 |
| AC Fonandalucía Mixto FI | RVIO | −0.0026 | 0.0014 | 0.0039 | 0.0006 | −0.6112 | 4.5814 |
| Caixa Galicia Mix 25 FI | RVIE | −0.0041 | 0.0012 | 0.0052 | 0.0002 | −0.5338 | 3.908 |
| Caixasabadell 6 Mixt FI | RVIO | −0.004 | 0.0014 | 0.0057 | 0.0004 | −0.5363 | 4.0686 |
| Caja Badajoz Inversión FI | RVIO | −0.0043 | 0.0015 | 0.0058 | 0.0005 | −0.5045 | 3.8379 |
| Caja Ingenieros Europa 25 FI | RFMI | −0.0034 | 0.0005 | 0.0047 | 0.0001 | −0.8693 | 5.3414 |
| Caja Ingenieros Global FI | RVMI | −0.0139 | 0.0007 | 0.0111 | −0.0005 | 0.1244 | 5.6426 |
| Caja Ingenieros Multifondo FI | FGL | −0.0113 | 0.0017 | 0.0124 | −0.0002 | −0.3426 | 4.2176 |
| Caja Madrid Evolución Var 3 FI | FGL | −0.0006 | 0.0006 | 0.0014 | 0.0004 | −0.9212 | 5.6002 |
| Caja Madrid Evolución VaR 6 FI | FGL | −0.0013 | 0.0006 | 0.0019 | 0.0001 | −1.3177 | 8.1738 |
| Cajaburgos Mixto I FI | FGL | −0.0035 | 0.0006 | 0.0042 | 0.0001 | −0.3977 | 3.3967 |
| BBK Fondo Internacional FI | RFM | −0.0118 | 0.001 | 0.0131 | −0.0006 | −0.3351 | 5.647 |
| BBK Gestión Activa 15 FI | RVMI | −0.0018 | 0.0006 | 0.0027 | 0.0005 | 0.1553 | 4.1452 |
| BBK Renta Global FI | RFMI | −0.0004 | 0.0004 | 0.0014 | 0.0005 | −0.0022 | 4.0319 |
| BBVA Bolsa Asia MF FI | RVIO | −0.0155 | 0.0022 | 0.0179 | 0.0013 | 0.081 | 4.8395 |
| BBVA Bolsa Europa FI | FGL | −0.0165 | 0.002 | 0.0172 | 0 | 0.0583 | 6.6685 |
| BBVA Bolsa Finanzas FI | FGL | −0.0234 | −0.0012 | 0.0177 | −0.0029 | −0.1675 | 8.2063 |
| BBVA Gestión Conservadora FI | FGL | −0.0029 | 0.001 | 0.0034 | 0.0002 | 0.0811 | 5.0554 |
| BBVA Gestión Decidida FI | FGL | −0.0108 | 0.0014 | 0.0118 | 0.0001 | −0.1248 | 3.6329 |
Fund name and investment policy (CNMV).
| Fund | Type of fund* | Q1 | Q2 | Q3 | Mean | Skewness | Kurtosis |
|---|---|---|---|---|---|---|---|
| Beta Alpha Dinámico FI | FGL | −0.0022 | 0.0008 | 0.0038 | 0.0006 | 0.2567 | 5.4371 |
| BNP Paribas Conservador FI | RVIO | −0.0025 | 0.0012 | 0.0043 | 0.0005 | −0.3911 | 4.4904 |
| BNP Paribas Dinámico FI | FGL | −0.0109 | 0.0004 | 0.0098 | −0.0001 | −0.0453 | 4.8294 |
| BNP Paribas Equilibrado FI | RFM | −0.0082 | 0.0002 | 0.0076 | −0.0001 | −0.0797 | 4.4698 |
| BNP Paribas Gestión Activa FI | FGL | −0.005 | 0.0013 | 0.0053 | 0.0002 | −0.2121 | 4.5994 |
| BNP Paribas Global III FI | RFM | −0.0026 | 0.001 | 0.0043 | 0.0006 | −0.3203 | 3.7496 |
| BNP Paribas Global Investment FI | FGL | −0.0075 | 0.0013 | 0.0081 | −0.0002 | −0.2036 | 5.133 |
| BNP Paribas Inversión FI | FGL | −0.0091 | 0.0011 | 0.0092 | −0.0009 | −0.3685 | 3.7107 |
| BNP Paribas Management Fund FI | FGL | −0.0024 | 0.0008 | 0.0038 | 0.0005 | −0.343 | 4.435 |
| BNP Paribas Protected Plus FI | RVIO | −0.0014 | 0.0004 | 0.0031 | 0.0004 | −0.8389 | 5.9822 |
| Bomerbe FI | FGL | −0.017 | 0.002 | 0.0171 | 0.0001 | −0.0893 | 4.6991 |
| CAI Renta Mixto 20 FI | FGL | −0.0031 | 0.001 | 0.0044 | 0.0003 | −0.4881 | 4.0553 |
| Caixa Catalunya Dinámico 2 FI | FGL | −0.0088 | 0.0004 | 0.0102 | −0.0006 | −0.7037 | 4.2897 |
| Caixa Catalunya Dinámico FI | FGL | −0.0095 | 0.0005 | 0.0102 | −0.0006 | −0.6327 | 4.3539 |
| Caixa Catalunya Equilibrio 2 FI | FGL | −0.0061 | 0.0003 | 0.0056 | −0.0003 | −0.5464 | 3.9085 |
| Caixa Catalunya Equilibrio FI | FGL | −0.006 | 0.0004 | 0.0057 | −0.0003 | −0.5088 | 3.8411 |
| AC Australasia FI | RVIE | −0.0179 | −0.0009 | 0.014 | −0.0011 | 0.3134 | 3.6796 |
| AC Fondtesoro Plus FI | RVIE | −0.0024 | 0.0013 | 0.0041 | 0.0006 | −0.8015 | 5.7919 |
| AC Inversión Selectiva FI | FGL | −0.0145 | 0.0032 | 0.0218 | 0.0019 | 0.0625 | 5.2463 |
Dates of minimum and maximum price of the SR fund.
| Fund | Day of minimum price | Day of maximum price | |
|---|---|---|---|
| F1 | AC Responsable 30 FI | 09/03/2009 | 16/07/2007 |
| F2 | BBK Solidaria FI | 09/03/2009 | 31/10/2007 |
| F3 | BBVA Bolsa Desarrollo Sostenible FI | 09/03/2009 | 15/06/2007 |
| F4 | BNP Paribas Fondo Solidaridad FI | 09/03/2009 | 01/06/2007 |
| F5 | Caixa Catalunya Europa Valor FI | 21/11/2008 | 14/10/2009 |
| F6 | Foncaixa Coop. Soc. Resp. Europa FI | 09/03/2009 | 01/06/2007 |
| F7 | Foncaixa Priv. Fondo Act. Ético FI | 09/03/2009 | 31/10/2007 |
| F8 | Fondo Solidario ProUnicef FI | 06/03/2009 | 17/07/2007 |
| F9 | Gesbeta Compromiso Fondo Ético FI | 27/10/2008 | 01/06/2007 |
| F10 | Inveractivo Confianza FI | 14/06/2006 | 01/06/2007 |
| F11 | Santander Dividendo Solidario FI | 09/03/2009 | 01/06/2007 |
| F12 | Santander Responsabilidad Coservd FI | 08/06/2006 | 29/12/2009 |
Fulfillment matrix of the characteristics of social responsibility of the funds.
| Group I: Social | Group II: Environmental | Group III: Ethical | |||
|---|---|---|---|---|---|
| 1 | Bribery and corruption | 12 | Environmental management, policy, reporting and performance | 17 | Intensive farming and meat sale |
| 2 | Community involvement | 13 | Climate change and greenhouse gases | 18 | Breast milk substitutes |
| 3 | Equal opportunities | 14 | Nuclear power | 19 | Tobacco marketing |
| 4 | SEE Risk Management | 15 | Pollution | 20 | Military issues |
| 5 | Women on the board | 16 | Genetic engineering | 21 | Alcohol and gambling |
| 6 | Human rights | 22 | Abortion | ||
| 7 | Relationships with customers and suppliers | 23 | Contraception | ||
| 8 | Supply chains | 24 | Pornography and adult entertainment services | ||
| 9 | Trade unions | ||||
| 10 | Training and development | ||||
| 11 | Positive products and services |
Fulfillment matrix of the characteristics of social responsibility of the funds.
| Fund | Criteria | |||||||||||||||||||||||
|---|---|---|---|---|---|---|---|---|---|---|---|---|---|---|---|---|---|---|---|---|---|---|---|---|
| 1 | 2 | 3 | 4 | 5 | 6 | 7 | 8 | 9 | 10 | 11 | 12 | 13 | 14 | 15 | 16 | 17 | 18 | 19 | 20 | 21 | 22 | 23 | 24 | |
| F1 | 0 | 1 | 1 | 1 | 0 | 1 | 1 | 0 | 1 | 1 | 0 | 0 | 1 | 0 | 0 | 0 | 0 | 0 | 0 | 0 | 0 | 0 | 0 | 0 |
| F2 | 0 | 0 | 1 | 1 | 1 | 1 | 0 | 0 | 0 | 0 | 0 | 1 | 1 | 0 | 1 | 0 | 0 | 0 | 1 | 1 | 1 | 0 | 0 | 0 |
| F3 | 0 | 1 | 0 | 1 | 0 | 0 | 1 | 0 | 0 | 1 | 0 | 1 | 0 | 0 | 0 | 0 | 0 | 0 | 0 | 0 | 0 | 0 | 0 | 0 |
| F4 | 0 | 1 | 1 | 0 | 0 | 1 | 0 | 0 | 0 | 1 | 0 | 1 | 0 | 0 | 1 | 0 | 0 | 0 | 1 | 1 | 1 | 0 | 0 | 1 |
| F5 | 0 | 1 | 0 | 1 | 0 | 0 | 1 | 0 | 1 | 1 | 0 | 0 | 0 | 0 | 0 | 0 | 0 | 0 | 1 | 1 | 1 | 0 | 0 | 0 |
| F6 | 1 | 0 | 0 | 0 | 0 | 1 | 1 | 1 | 1 | 1 | 0 | 1 | 0 | 1 | 0 | 0 | 0 | 0 | 1 | 1 | 0 | 0 | 0 | 0 |
| F7 | 0 | 1 | 1 | 1 | 1 | 1 | 1 | 1 | 1 | 1 | 0 | 1 | 0 | 1 | 0 | 0 | 0 | 1 | 1 | 1 | 0 | 0 | 0 | 0 |
| F8 | 0 | 0 | 0 | 0 | 0 | 0 | 0 | 0 | 0 | 0 | 0 | 0 | 0 | 0 | 0 | 0 | 0 | 0 | 1 | 1 | 1 | 0 | 0 | 0 |
| F9 | 1 | 1 | 1 | 1 | 1 | 1 | 1 | 1 | 1 | 1 | 1 | 1 | 1 | 1 | 1 | 1 | 1 | 1 | 1 | 1 | 1 | 1 | 1 | 1 |
| F10 | 0 | 0 | 0 | 0 | 0 | 0 | 0 | 0 | 0 | 0 | 0 | 0 | 0 | 0 | 0 | 0 | 1 | 1 | 1 | 1 | 1 | 1 | 1 | 1 |
| F11 | 0 | 0 | 1 | 0 | 0 | 0 | 0 | 0 | 0 | 1 | 1 | 1 | 1 | 0 | 1 | 0 | 0 | 0 | 0 | 1 | 0 | 1 | 0 | 0 |
| F12 | 1 | 0 | 1 | 0 | 0 | 1 | 0 | 0 | 0 | 0 | 0 | 1 | 1 | 0 | 1 | 1 | 0 | 0 | 0 | 1 | 1 | 1 | 1 | 0 |
VaRα(X) is defined as the maximum expected loss on an investment over a specified horizon at a given confidence level α

www.publicationethics.org.