This study aimed to investigate the association between occupation and depressive/anxiety symptoms, and education levels, among professionals from a Brazilian General Hospital in need of mental health treatment.
Design and settingThis is a cross-sectional study, involving professionals from a teaching hospital in São Paulo.
MethodsSocio-demographic data were collected as well as two standardized scales for depression and anxiety symptoms.
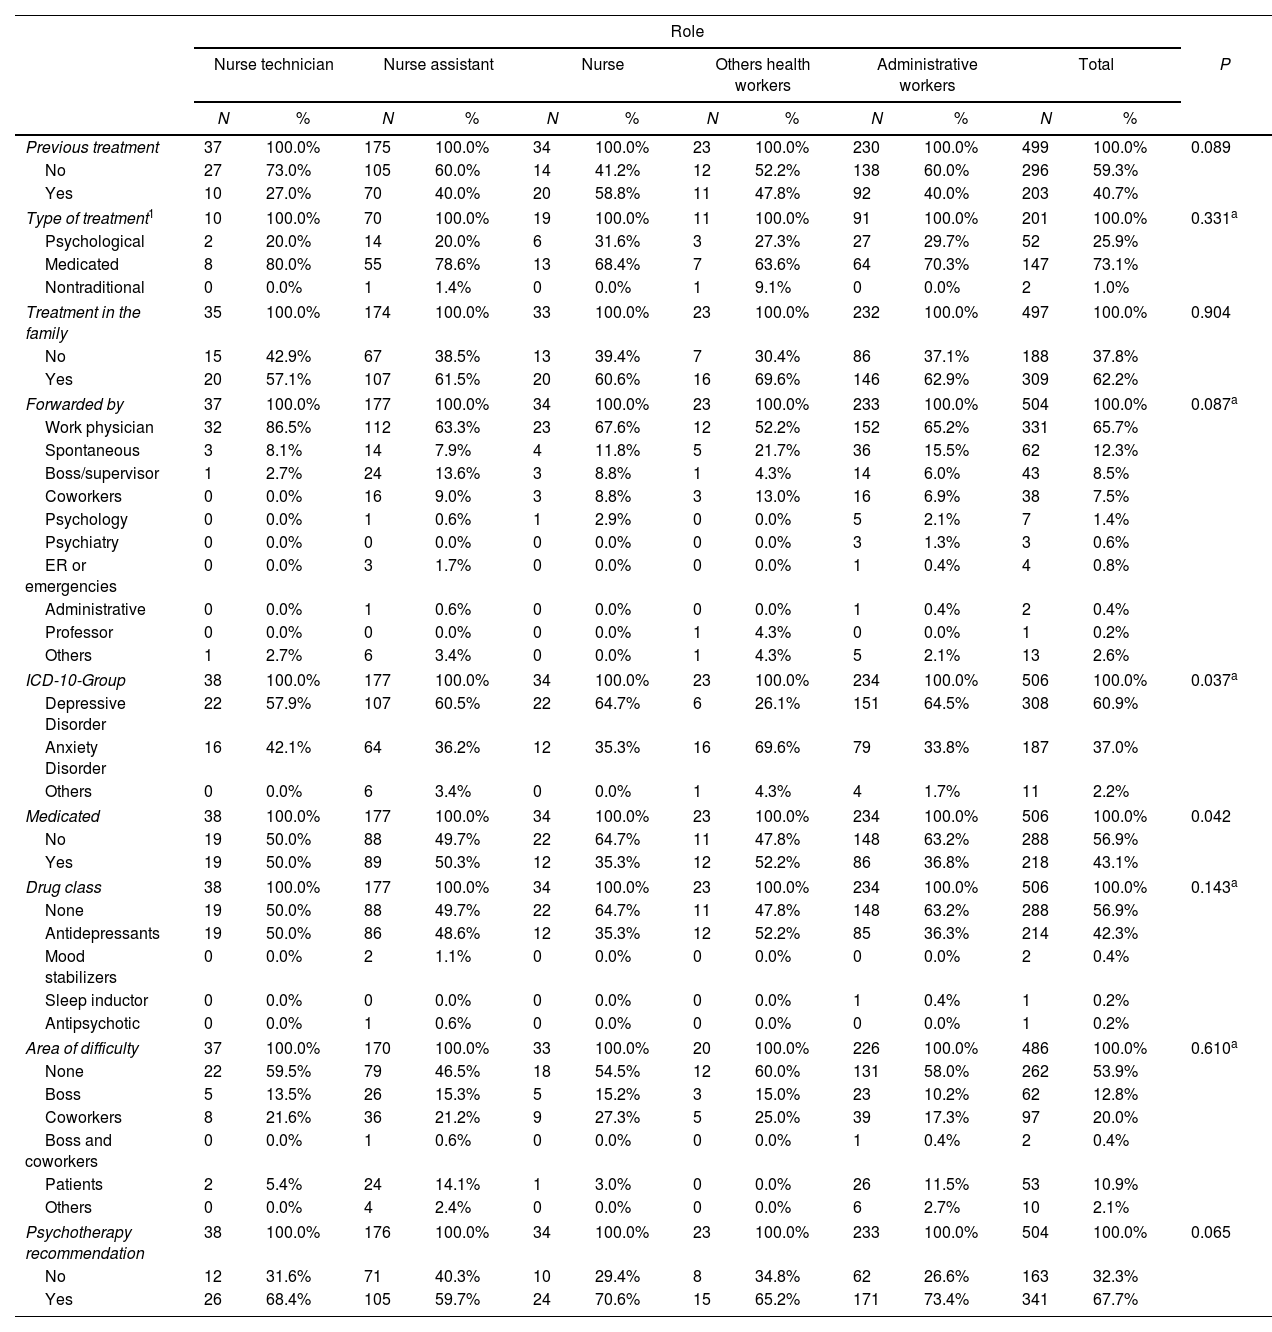
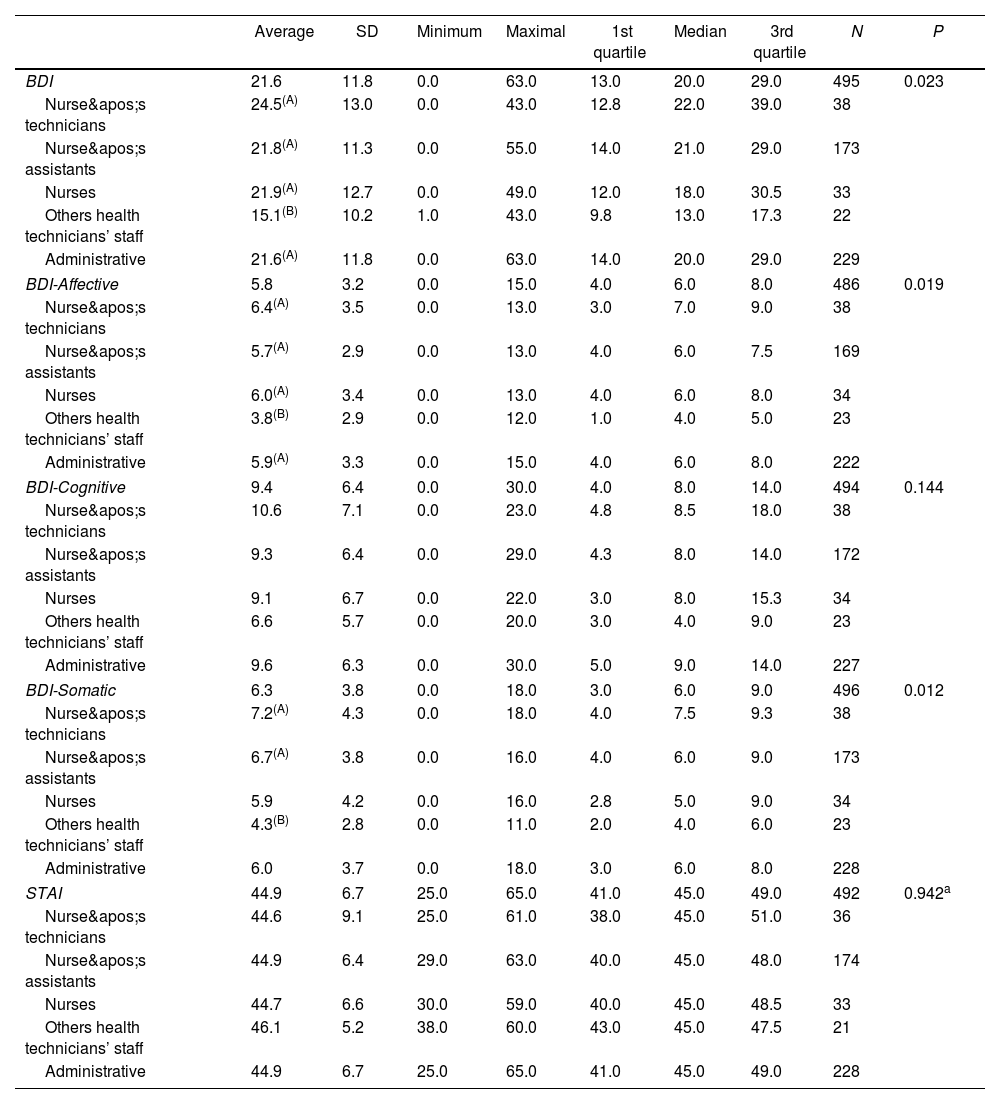
ResultsData from 506 employees seeking mental health assistance have been described: mean age was 34.6 years, 46.2% of them worked in the administrative sector, 35.0% were nursing assistants, 7.5% were nursing technicians, 6.7% were nurses, and 4.5% reported other occupations. According to the International Classification of Diseases-10th edition (ICD-10) criteria, the rates of diagnosis of depressive disorders and anxiety disorders were 60.9% and 37%, respectively. Nursing technicians and nursing assistants reported higher somatic cluster Beck Depression Inventory (BDI) scores (P=0.012) than other professionals of technical staff, but they were less inclined to receive a psychiatric diagnosis.
ConclusionsOur study demonstrated prevalence rates higher than similar studies in university hospitals, fact that associated with difficulties of the studied population as seeing themselves as sick, and the social discrimination suffered by people with mental disorders can make this problem even worse.
Este estudio tuvo como objetivo investigar la asociación entre la ocupación y los síntomas depresivos/ansiosos, los niveles de educación, entre los profesionales de un hospital general brasileño en necesidad de tratamiento de salud mental.
Diseño y escenarioEste es un estudio transversal, involucrando profesionales de un hospital escuela en São Paulo.
MétodosSe recogieron datos sociodemográficos y dos escalas estandarizadas para síntomas de depresión y ansiedad.
ResultadosSe describen datos de 506 empleados que buscaban asistencia en salud mental: la edad media fue de 34,6 años, el 46,2% trabajaba en el sector administrativo, el 35,0% eran auxiliares de enfermería, el 7,5% eran técnicos de enfermería, el 6,7% eran enfermeros y el 4,5% reportaron otras ocupaciones. Según los criterios de la Clasificación Internacional de Enfermedades, 10.ª edición (CIE-10), las tasas de diagnóstico de los trastornos depresivos y los trastornos de ansiedad fueron del 60,9% y del 37%, respectivamente. Los técnicos y auxiliares de enfermería relataron puntajes más altos (P=0,012) del Inventario de Depresión de Beck del clúster somático que otros profesionales del cuerpo técnico, pero se mostraron menos inclinados a recibir un diagnóstico psiquiátrico.
ConclusionesNuestro estudio demostró tasas de prevalencia superiores a estudios similares en hospitales universitarios, hecho que asociado a las dificultades de la población estudiada para verse a sí mismos como enfermos, y la discriminación social que sufren las personas con trastornos mentales puede agravar aún más este problema.
Depression disorders, burnout syndrome, anxiety disorders, and suicides are common worldwide and frequent among health professionals,1–7 especially doctors and nurses, frequently due to their long training, work-related stress, personality characteristics as well as coping with illness and sick people in daily life.8
It is known that work environment (including speed, quantity, complexity, intensity, unpredictability, and social support), absenteeism/presenteeism, sustained stress at the workplace, sexual harassment, and sexual orientation-based discrimination has also been associated with increased risk of depression in health workers.6 Among health workers, nurses and physicians have higher rates of depression compared to other health professionals.6
During the coronavirus disease 2019 (COVID-19) pandemic, a systematic review and meta-analysis including thirteen studies with a combined total of 33,062 healthcare workers found the prevalence of 23.2% and 22.8% for anxiety and depression, respectively.9 In addition, gender and occupational differences were observed in a subgroup analysis, with female nurses exhibiting higher affective symptom rates than male and medical staff.9
In Brazil, a study demonstrated that 95.24% of the nurses working in the emergency department had depressive symptoms, although most nurses did not recognize themselves as ill.10 Also, in a Brazilian university hospital, the prevalence of 27.05% and 29.45% of depressive and anxiety symptoms were observed, respectively.11
In 2005, our team set up a didactic ambulatory in São Paulo, Brazil, supporting hospital employees named Núcleo de Apoio aos Funcionários (NAF). Leaded by a professor of psychiatry of the medical school, it was created to offer psychiatric and psychological medical consultations. Senior medical undergraduate students of the Faculdade de Medicina do ABC (FMABC) are able to follow the psychiatrists and psychologists during the consultations. NAF consultations are standardized, and all patients are asked to respond in advance to the Spielberger State Anxiety Inventory (STAI-S) and Beck Depression Inventory (BDI). These data have been systematically recorded in a database.
Doctors and nurses report a relevant amount of distress. Also, women are two or three times more vulnerable.12
Most studies on depression and anxiety in health workers apply anonymous questionnaires to employees, unlike these studies, our scales were applied to patients who sought treatment for mental health complaints in an outpatient clinic in their workplace.
ObjectiveThis study aimed to investigate the association between occupation and depressive/anxiety symptoms, and education levels, among professionals from a Brazilian General Hospital in need of mental health treatment.
MethodsStudy designThis is a cross-sectional study based on a dataset collecting all psychiatric and psychological consults delivered for hospital employees of a teaching hospital in São Paulo, Brazil with approximately 2000 employees, following the Strengthening the Reporting of Observational Studies in Epidemiology (STROBE).13
In this database, the following data have been collected: name, gender, degree of education, social status, marital status, date of birth, place of birth, place of residence, religion, the pathway to care, professional area (technical or administrative activity), occupation, the main reason for searching help, clinical condition (mild, moderate or severe), years of profession, number of mental health professionals in the family, main areas of distress (bosses, coworkers, patients and none), if psychotherapeutic treatment was indicated, any previous psychiatric or psychological assessment/treatment, history of neuropsychiatric diseases or previous traumatic events during work.
Inclusion criteriaPatients who attended our outpatient clinic for at least two psychiatric or psychological consultations. There were no restrictions on age, area of expertise, occupation, or gender.
InstrumentsBefore the appointment, all patients were informed that their data would be collected for a database which data could be used in the future and filled out: [1] the BDI with 21 items (Gomes-Oliveira, 2012), divided in the affective cluster (BDI items: B1, B4, B10, B11, and B12), cognitive cluster (BDI items: B2, B3, B5, B6, B7, B8, B9, B13, B14, and B20), and somatic clusters (BDI items: B15, B16, B17, B18, B19, and B21) and [2] the State-Trait Anxiety Inventory STAI-S with twenty items.14
The following ranges of depressive symptoms have been considered for BDI: 0–9, minimum or absent; 10–17, mild; 18–29, moderate; 30–63, severe depression. The scoring for the STAI-S has been based on the following cut-offs: <33 – mild, 33–49 – moderate, >49 – high anxiety.
Ethical considerationsThis study was approved by the research ethics committee under the number: 048/2010, on March 30, 2010, from Medical School of Health ABC University Center, Brazil. The ethics committee did not require free and clarified consent terms.
Statistical analysisInitially, data were analyzed descriptively. For the categorical variables, the absolute and relative frequencies were presented and for the continuous variables, summary measures (mean, quartiles, minimum, maximum and standard deviation) were used.
Bivariate analyses were performed with Chi-square test, or alternatively in cases of small samples, Fisher's exact test. In association, the standardized adjusted residue was used to identify local differences – cases with absolute values above 1.96 indicated evidence of (local) associations between the categories related to these cases.
The internal consistencies of BDI's items (total and aspects) and STAI-S scales were evaluated using Cronbach's Alpha (0.886 and 0.605, respectively).
The comparison of means between more than two groups was performed with the Analysis of Variance (ANOVA). To detect differences in means, Duncan's multiple comparisons were used. Once the differences in means in the ANOVA or Kruskal–Wallis test were detected, the differences in location was discovered via multiple comparisons of Duncan or Dunn–Bonferroni, respectively maintaining a global significance level of 5%.
Finally, in order to evaluate the simultaneous effects of sex, age, race, religion, social status, education, occupation, area of difficulty, and family member in mental treatment (explanatory variables) on BDI and STAI-S, multiple linear regression models were adjusted. Initially, all explanatory variables were included in the model and then the non-significant variables at 5% were excluded one by one in order of significance (backward method). Linear regression also presents as one of its assumptions the normality in the data, which was verified via the Kolmogorov–Smirnov's test. For all statistical tests, a significance level of 5% was adopted. Statistical analyses were performed using Statistical Package for the Social Sciences 20.0 (Armonk, New York, United States: IBM Corp).
ResultsIn twelve years from July 10, 2005, to July 02, 2017, 4168 first consultations were performed at the didactic ambulatory in São Paulo for General Hospital employees, including 1734 psychiatric medical appointments and 1632 psychotherapy sessions, with a total of 506 patients and a 12.8% drop-out rate. Patients that attended our ambulatory only once during the studied period were considered drop-outs.
Sample characteristicsData from 506 patients were collected: mean age was 34.6 years (standard deviation, SD=9.2 years), with a minimum age of 17 years old and a maximum age of 66 years old.
A predominance of women (85.8%) and professionals living with family (93.3%) have been recorded. In addition, about half of the professionals declared themselves as being Caucasian (55.0%) and catholic (45.5%).
Of 506 professionals, 234 (46.2%) worked in the administrative sector, 177 (35.0%) were nursing assistants, 38 (7.5%) were nursing technicians, 34 (6.7%) were nurses and 23 (4.5%) worked in other hospital technical staff, such as doctors, biomedicals, dentists, pharmacists, physiotherapists, phono-audiologists, nutritionists and pathologists.
A significant association has been found between occupation and education degree (P<0.001). Thus, it was observed that nurses and other professionals in the health technical staff had the highest percentages of individuals with higher education levels (above 95%) when compared to nursing technicians and those in administrative positions (below 45.0%). The professionals with the highest percentage of higher education level were 33 (97.1%) nurses and 22 (95.7%) among the other technicians
There were no statistically significant differences between the incidence of mental disorders and factors such as social status, marital status, race or religion.
Table 1 shows that, out of 506 studied individuals, 262 (53.9%) did not indicate that the workplace was a source of distress, but 97 (20%) reported difficulties with coworkers, 62 (12.8%) with bosses and 53 (10.9%) with patients. The higher level of difficulties with patients was observed among nursing assistants (14.1%) and the lowest was observed among nurses (3.0%), which represents an observational finding with a non-significant Fisher's exact descriptive test (P=0.610).
Distribution of professionals by clinical characteristics, according to occupation.
| Role | |||||||||||||
|---|---|---|---|---|---|---|---|---|---|---|---|---|---|
| Nurse technician | Nurse assistant | Nurse | Others health workers | Administrative workers | Total | P | |||||||
| N | % | N | % | N | % | N | % | N | % | N | % | ||
| Previous treatment | 37 | 100.0% | 175 | 100.0% | 34 | 100.0% | 23 | 100.0% | 230 | 100.0% | 499 | 100.0% | 0.089 |
| No | 27 | 73.0% | 105 | 60.0% | 14 | 41.2% | 12 | 52.2% | 138 | 60.0% | 296 | 59.3% | |
| Yes | 10 | 27.0% | 70 | 40.0% | 20 | 58.8% | 11 | 47.8% | 92 | 40.0% | 203 | 40.7% | |
| Type of treatment1 | 10 | 100.0% | 70 | 100.0% | 19 | 100.0% | 11 | 100.0% | 91 | 100.0% | 201 | 100.0% | 0.331a |
| Psychological | 2 | 20.0% | 14 | 20.0% | 6 | 31.6% | 3 | 27.3% | 27 | 29.7% | 52 | 25.9% | |
| Medicated | 8 | 80.0% | 55 | 78.6% | 13 | 68.4% | 7 | 63.6% | 64 | 70.3% | 147 | 73.1% | |
| Nontraditional | 0 | 0.0% | 1 | 1.4% | 0 | 0.0% | 1 | 9.1% | 0 | 0.0% | 2 | 1.0% | |
| Treatment in the family | 35 | 100.0% | 174 | 100.0% | 33 | 100.0% | 23 | 100.0% | 232 | 100.0% | 497 | 100.0% | 0.904 |
| No | 15 | 42.9% | 67 | 38.5% | 13 | 39.4% | 7 | 30.4% | 86 | 37.1% | 188 | 37.8% | |
| Yes | 20 | 57.1% | 107 | 61.5% | 20 | 60.6% | 16 | 69.6% | 146 | 62.9% | 309 | 62.2% | |
| Forwarded by | 37 | 100.0% | 177 | 100.0% | 34 | 100.0% | 23 | 100.0% | 233 | 100.0% | 504 | 100.0% | 0.087a |
| Work physician | 32 | 86.5% | 112 | 63.3% | 23 | 67.6% | 12 | 52.2% | 152 | 65.2% | 331 | 65.7% | |
| Spontaneous | 3 | 8.1% | 14 | 7.9% | 4 | 11.8% | 5 | 21.7% | 36 | 15.5% | 62 | 12.3% | |
| Boss/supervisor | 1 | 2.7% | 24 | 13.6% | 3 | 8.8% | 1 | 4.3% | 14 | 6.0% | 43 | 8.5% | |
| Coworkers | 0 | 0.0% | 16 | 9.0% | 3 | 8.8% | 3 | 13.0% | 16 | 6.9% | 38 | 7.5% | |
| Psychology | 0 | 0.0% | 1 | 0.6% | 1 | 2.9% | 0 | 0.0% | 5 | 2.1% | 7 | 1.4% | |
| Psychiatry | 0 | 0.0% | 0 | 0.0% | 0 | 0.0% | 0 | 0.0% | 3 | 1.3% | 3 | 0.6% | |
| ER or emergencies | 0 | 0.0% | 3 | 1.7% | 0 | 0.0% | 0 | 0.0% | 1 | 0.4% | 4 | 0.8% | |
| Administrative | 0 | 0.0% | 1 | 0.6% | 0 | 0.0% | 0 | 0.0% | 1 | 0.4% | 2 | 0.4% | |
| Professor | 0 | 0.0% | 0 | 0.0% | 0 | 0.0% | 1 | 4.3% | 0 | 0.0% | 1 | 0.2% | |
| Others | 1 | 2.7% | 6 | 3.4% | 0 | 0.0% | 1 | 4.3% | 5 | 2.1% | 13 | 2.6% | |
| ICD-10-Group | 38 | 100.0% | 177 | 100.0% | 34 | 100.0% | 23 | 100.0% | 234 | 100.0% | 506 | 100.0% | 0.037a |
| Depressive Disorder | 22 | 57.9% | 107 | 60.5% | 22 | 64.7% | 6 | 26.1% | 151 | 64.5% | 308 | 60.9% | |
| Anxiety Disorder | 16 | 42.1% | 64 | 36.2% | 12 | 35.3% | 16 | 69.6% | 79 | 33.8% | 187 | 37.0% | |
| Others | 0 | 0.0% | 6 | 3.4% | 0 | 0.0% | 1 | 4.3% | 4 | 1.7% | 11 | 2.2% | |
| Medicated | 38 | 100.0% | 177 | 100.0% | 34 | 100.0% | 23 | 100.0% | 234 | 100.0% | 506 | 100.0% | 0.042 |
| No | 19 | 50.0% | 88 | 49.7% | 22 | 64.7% | 11 | 47.8% | 148 | 63.2% | 288 | 56.9% | |
| Yes | 19 | 50.0% | 89 | 50.3% | 12 | 35.3% | 12 | 52.2% | 86 | 36.8% | 218 | 43.1% | |
| Drug class | 38 | 100.0% | 177 | 100.0% | 34 | 100.0% | 23 | 100.0% | 234 | 100.0% | 506 | 100.0% | 0.143a |
| None | 19 | 50.0% | 88 | 49.7% | 22 | 64.7% | 11 | 47.8% | 148 | 63.2% | 288 | 56.9% | |
| Antidepressants | 19 | 50.0% | 86 | 48.6% | 12 | 35.3% | 12 | 52.2% | 85 | 36.3% | 214 | 42.3% | |
| Mood stabilizers | 0 | 0.0% | 2 | 1.1% | 0 | 0.0% | 0 | 0.0% | 0 | 0.0% | 2 | 0.4% | |
| Sleep inductor | 0 | 0.0% | 0 | 0.0% | 0 | 0.0% | 0 | 0.0% | 1 | 0.4% | 1 | 0.2% | |
| Antipsychotic | 0 | 0.0% | 1 | 0.6% | 0 | 0.0% | 0 | 0.0% | 0 | 0.0% | 1 | 0.2% | |
| Area of difficulty | 37 | 100.0% | 170 | 100.0% | 33 | 100.0% | 20 | 100.0% | 226 | 100.0% | 486 | 100.0% | 0.610a |
| None | 22 | 59.5% | 79 | 46.5% | 18 | 54.5% | 12 | 60.0% | 131 | 58.0% | 262 | 53.9% | |
| Boss | 5 | 13.5% | 26 | 15.3% | 5 | 15.2% | 3 | 15.0% | 23 | 10.2% | 62 | 12.8% | |
| Coworkers | 8 | 21.6% | 36 | 21.2% | 9 | 27.3% | 5 | 25.0% | 39 | 17.3% | 97 | 20.0% | |
| Boss and coworkers | 0 | 0.0% | 1 | 0.6% | 0 | 0.0% | 0 | 0.0% | 1 | 0.4% | 2 | 0.4% | |
| Patients | 2 | 5.4% | 24 | 14.1% | 1 | 3.0% | 0 | 0.0% | 26 | 11.5% | 53 | 10.9% | |
| Others | 0 | 0.0% | 4 | 2.4% | 0 | 0.0% | 0 | 0.0% | 6 | 2.7% | 10 | 2.1% | |
| Psychotherapy recommendation | 38 | 100.0% | 176 | 100.0% | 34 | 100.0% | 23 | 100.0% | 233 | 100.0% | 504 | 100.0% | 0.065 |
| No | 12 | 31.6% | 71 | 40.3% | 10 | 29.4% | 8 | 34.8% | 62 | 26.6% | 163 | 32.3% | |
| Yes | 26 | 68.4% | 105 | 59.7% | 24 | 70.6% | 15 | 65.2% | 171 | 73.4% | 341 | 67.7% | |
ICD-10: International Classification of Diseases-10th edition; 1Only for those who underwent treatment – 2 cases without information.
According to the International Classification of Diseases-10th edition (ICD-10) criteria, diagnoses of depressive disorders (60.9%) and anxiety disorders (37%) were highly prevalent. Also, 69.6% of other technical staff professionals have been diagnosed with an anxiety disorder (P=0.037).
Regarding pharmacological treatment, when prescribed, antidepressants were largely employed in 43.1% (P=0.143) of professionals. For 341 of them (67.7%), psychotherapy has been indicated (P=0.065).
Job category and mental health outcomesAs shown in Table 1, an association between professional occupation and ICD-10 (P=0.037) as well as medication use (P=0.042) has been found. Thus, the other professionals of technical staff have shown a higher percentage of anxiety disorders (69.6%) when compared to other professionals which presented higher percentages of depressive disorders.
In general, it was observed that 40.7% received previous treatment (P=0.089), of which 73.1% pharmacological treatment (P=0.331). In addition, 62.2% reported a family history for neuropsychiatric treatments (P=0.904).
As shown in Table 2 and Figures S1 and S2, there were differences between means of total BDI scores (P=0.023), BDI affective cluster (P=0.019), and BDI somatic cluster (P=0.012) among patients with different healthcare-related occupations.
Measures-summary of Beck Depression Inventory (BDI) (total and clusters) and the Spielberger State Anxiety Inventory (STAI-S), according to occupation.
| Average | SD | Minimum | Maximal | 1st quartile | Median | 3rd quartile | N | P | |
|---|---|---|---|---|---|---|---|---|---|
| BDI | 21.6 | 11.8 | 0.0 | 63.0 | 13.0 | 20.0 | 29.0 | 495 | 0.023 |
| Nurse's technicians | 24.5(A) | 13.0 | 0.0 | 43.0 | 12.8 | 22.0 | 39.0 | 38 | |
| Nurse's assistants | 21.8(A) | 11.3 | 0.0 | 55.0 | 14.0 | 21.0 | 29.0 | 173 | |
| Nurses | 21.9(A) | 12.7 | 0.0 | 49.0 | 12.0 | 18.0 | 30.5 | 33 | |
| Others health technicians’ staff | 15.1(B) | 10.2 | 1.0 | 43.0 | 9.8 | 13.0 | 17.3 | 22 | |
| Administrative | 21.6(A) | 11.8 | 0.0 | 63.0 | 14.0 | 20.0 | 29.0 | 229 | |
| BDI-Affective | 5.8 | 3.2 | 0.0 | 15.0 | 4.0 | 6.0 | 8.0 | 486 | 0.019 |
| Nurse's technicians | 6.4(A) | 3.5 | 0.0 | 13.0 | 3.0 | 7.0 | 9.0 | 38 | |
| Nurse's assistants | 5.7(A) | 2.9 | 0.0 | 13.0 | 4.0 | 6.0 | 7.5 | 169 | |
| Nurses | 6.0(A) | 3.4 | 0.0 | 13.0 | 4.0 | 6.0 | 8.0 | 34 | |
| Others health technicians’ staff | 3.8(B) | 2.9 | 0.0 | 12.0 | 1.0 | 4.0 | 5.0 | 23 | |
| Administrative | 5.9(A) | 3.3 | 0.0 | 15.0 | 4.0 | 6.0 | 8.0 | 222 | |
| BDI-Cognitive | 9.4 | 6.4 | 0.0 | 30.0 | 4.0 | 8.0 | 14.0 | 494 | 0.144 |
| Nurse's technicians | 10.6 | 7.1 | 0.0 | 23.0 | 4.8 | 8.5 | 18.0 | 38 | |
| Nurse's assistants | 9.3 | 6.4 | 0.0 | 29.0 | 4.3 | 8.0 | 14.0 | 172 | |
| Nurses | 9.1 | 6.7 | 0.0 | 22.0 | 3.0 | 8.0 | 15.3 | 34 | |
| Others health technicians’ staff | 6.6 | 5.7 | 0.0 | 20.0 | 3.0 | 4.0 | 9.0 | 23 | |
| Administrative | 9.6 | 6.3 | 0.0 | 30.0 | 5.0 | 9.0 | 14.0 | 227 | |
| BDI-Somatic | 6.3 | 3.8 | 0.0 | 18.0 | 3.0 | 6.0 | 9.0 | 496 | 0.012 |
| Nurse's technicians | 7.2(A) | 4.3 | 0.0 | 18.0 | 4.0 | 7.5 | 9.3 | 38 | |
| Nurse's assistants | 6.7(A) | 3.8 | 0.0 | 16.0 | 4.0 | 6.0 | 9.0 | 173 | |
| Nurses | 5.9 | 4.2 | 0.0 | 16.0 | 2.8 | 5.0 | 9.0 | 34 | |
| Others health technicians’ staff | 4.3(B) | 2.8 | 0.0 | 11.0 | 2.0 | 4.0 | 6.0 | 23 | |
| Administrative | 6.0 | 3.7 | 0.0 | 18.0 | 3.0 | 6.0 | 8.0 | 228 | |
| STAI | 44.9 | 6.7 | 25.0 | 65.0 | 41.0 | 45.0 | 49.0 | 492 | 0.942a |
| Nurse's technicians | 44.6 | 9.1 | 25.0 | 61.0 | 38.0 | 45.0 | 51.0 | 36 | |
| Nurse's assistants | 44.9 | 6.4 | 29.0 | 63.0 | 40.0 | 45.0 | 48.0 | 174 | |
| Nurses | 44.7 | 6.6 | 30.0 | 59.0 | 40.0 | 45.0 | 48.5 | 33 | |
| Others health technicians’ staff | 46.1 | 5.2 | 38.0 | 60.0 | 43.0 | 45.0 | 47.5 | 21 | |
| Administrative | 44.9 | 6.7 | 25.0 | 65.0 | 41.0 | 45.0 | 49.0 | 228 | |
SD: standard deviation; P-descriptive level of ANOVA (a) or Kruskal–Wallis test; (A) and (B) present distinct means according to Dunn–Bonferroni comparisons.
Other professionals in the health technical staff presented lower means at total BDI score (P=0.023), BDI somatic cluster (P=0.012), and BDI affective cluster (P=0.019) than nurses, nursing assistants, nursing technicians, and administrative staff, with the latter groups presenting similar means among themselves.
BDI cognitive cluster was not different among professional occupations (P=0.144) even if lower means of a cognitive cluster have been found among administrative employees (not significantly).
Total BDI score (P=0.012), BDI somatic cluster (P=0.005), and STAI-S (P=0.012) were significantly different among professionals reporting areas of distress (Table 3). No associations were observed between STAI-S scores and occupation (P=0.276) and/or area of difficulty (P=0.085).
Beck Depression Inventory (BDI) measures (total and clusters) and Spielberger State Anxiety Inventory (STAI-S) by areas of difficulty.
| Area of difficulty | Average | SD | Minimum | Maximal | 1st quartile | Median | 3rd quartile | N | P |
|---|---|---|---|---|---|---|---|---|---|
| BDI | 0.012 | ||||||||
| None | 20.4(B) | 12.2 | 0.0 | 55.0 | 12.0 | 18.0 | 28.0 | 259 | |
| Boss | 23.7(B) | 10.4 | 0.0 | 49.0 | 18.0 | 22.0 | 31.0 | 60 | |
| Coworkers | 22.5(B) | 11.4 | 0.0 | 63.0 | 13.0 | 22.0 | 29.0 | 95 | |
| Boss and coworkers | 10.5 | 2.1 | 9.0 | 12.0 | – | – | – | 2 | |
| Patients | 22.9(B) | 11.6 | 1.0 | 63.0 | 16.0 | 21.0 | 31.0 | 51 | |
| Others | 29.4(A) | 16.9 | 0.0 | 50.0 | 17.0 | 33.5 | 42.5 | 10 | |
| BDI-Affective | 0.157(a) | ||||||||
| None | 5.6 | 3.3 | 0.0 | 15.0 | 3.0 | 5.0 | 8.0 | 250 | |
| Boss | 6.3 | 2.9 | 0.0 | 13.0 | 5.0 | 6.0 | 8.0 | 61 | |
| Coworkers | 5.9 | 3.1 | 0.0 | 13.0 | 3.3 | 6.0 | 8.0 | 92 | |
| Boss and coworkers | 3.5 | 0.7 | 3.0 | 4.0 | – | – | – | 2 | |
| Patients | 5.8 | 3.0 | 0.0 | 14.0 | 4.0 | 6.0 | 7.8 | 52 | |
| Others | 7.8 | 4.1 | 0.0 | 13.0 | 4.8 | 9.5 | 11.0 | 10 | |
| BDI-Cognitive | 0.063 | ||||||||
| None | 9.1 | 6.6 | 0.0 | 30.0 | 4.0 | 8.0 | 14.0 | 257 | |
| Boss | 10.3 | 5.8 | 0.0 | 24.0 | 6.0 | 10.0 | 15.0 | 60 | |
| Coworkers | 9.8 | 6.5 | 0.0 | 28.0 | 5.0 | 9.0 | 13.0 | 95 | |
| Boss and coworkers | 0.5 | 0.7 | 0.0 | 1.0 | – | – | – | 2 | |
| Patients | 9.1 | 5.8 | 0.0 | 19.0 | 5.0 | 8.0 | 15.0 | 51 | |
| Others s | 12.5 | 8.6 | 0.0 | 25.0 | 5.3 | 12.0 | 19.8 | 10 | |
| BDI-Somatic | 0.005 | ||||||||
| None | 5.7(B) | 3.8 | 0.0 | 18.0 | 3.0 | 5.0 | 8.5 | 257 | |
| Boss | 7.1(B) | 3.4 | 0.0 | 16.0 | 5.0 | 7.0 | 9.0 | 60 | |
| Coworkers | 6.6(B) | 3.7 | 0.0 | 16.0 | 4.0 | 7.0 | 9.8 | 96 | |
| Boss and coworkers | 6.5 | 2.1 | 5.0 | 8.0 | – | – | – | 2 | |
| Patients | 6.6(B) | 4.0 | 0.0 | 18.0 | 4.0 | 6.0 | 9.0 | 52 | |
| Others | 9.3(A) | 5.3 | 0.0 | 14.0 | 5.5 | 12.0 | 14.0 | 10 | |
| STAI | 0.012(a) | ||||||||
| None | 44.0(A′) | 6.7 | 25.0 | 65.0 | 40.0 | 44.0 | 48.0 | 254 | |
| Boss | 46.8(B′) | 6.4 | 34.0 | 63.0 | 42.0 | 47.0 | 52.0 | 61 | |
| Coworkers | 45.5 | 6.6 | 29.0 | 61.0 | 41.3 | 45.0 | 50.0 | 96 | |
| Boss and coworkers | 43.0 | 5.7 | 39.0 | 47.0 | – | – | – | 2 | |
| Patients | 46.6 | 6.5 | 31.0 | 62.0 | 41.0 | 46.0 | 50.0 | 51 | |
| Others | 47.6 | 9.5 | 32.0 | 60.0 | 40.0 | 47.0 | 56.5 | 9 | |
SD: standard deviation; P-descriptive level of Analysis of Variance (ANOVA); (a)or Kruskal–Wallis test; (A) and (B) present distinct means according to Dunn–Bonferroni comparisons; (A′) and (B′) present distinct means according to Duncan comparisons.
After the application of a multiple linear regression model to total BDI (Table 4), we found that professionals of technical staff recorded, on average, 7.04 points of depression symptoms less than the professionals working in the administrative area, although nursing technicians, nursing assistants, and nurses presented similar levels to those in the administrative area (P=0.006). In addition, all professionals without a family history of neuropsychiatric treatments recorded, on average, 3.64 points less in total BDI than those without this characteristic (P=0.001). Also, regarding the STAI-S (Table 5), we found that professionals reporting difficulties with bosses (P=0.018) or patients (P=0.039) registered, on average, 2.09 points of anxiety symptoms more than those who did not report any difficulty.
Multiple linear regression model's estimates for total Beck Depression Inventory (BDI).
| Coefficient (95% CI) | P | |
|---|---|---|
| Occupation (ref.=administrative staff) | ||
| Nursing technicians | – | ns |
| Nursing assistants | – | ns |
| Nurses | – | ns |
| Others form health's technical staff | −7.04 (−12.01; −2.06) | 0.006 |
| No mental health disorders’ family history | −3.64 (−5.77; −1.51) | 0.001 |
| Constant | 23.29 (21.95; 24.62) | <0.001 |
CI: confidence interval; n=488. Kolmogorov–Smirnov's test for normality (P=0.065).
Multiple linear regression model's estimates for Spielberger State Anxiety Inventory (STAI-S).
| Coefficient (95% CI) | P | |
|---|---|---|
| Area of difficulty (ref.=none) | ||
| Bosses | 2.18 (0.38; 3.99) | 0.018 |
| Coworkers | – | ns |
| Patients | 2.09 (0.11; 4.06) | 0.039 |
| Others | – | ns |
| Constant | 44.48 (43.78; 45.18) | <0.001 |
CI: confidence interval; n=473. Kolmogorov–Smirnov's test for normality (P=0.226).
Analysis of internal consistency of BDI and STAI-S inventories showed a good internal consistency for BDI (total Cronbach's Alpha=0.886), and a moderated internal consistency for STAI-S (n=423), with a total Cronbach's Alpha=0.605.
DiscussionOur study demonstrated prevalence rates of 64.70% and 35.30% of depressive and anxiety symptoms in nurses. These prevalences were higher than 27.05% and 29.45% found by Freire et al.12 and similar studies.6,15,16 Despite similar studies in university hospitals, one major difference among these studies is that ours demonstrated the prevalence in professionals admitted in the ambulatory. Since our sample was attending a mental health ambulatory, it is expected that our rates could be higher. Still, as evidenced by Fernandes et al.,17 nurses, despite having difficulties seeing themselves as sick, are afraid of social discrimination suffered by people with mental disorders, so there is a possibility that our rates are underestimated.
In this study, 46.2% of the patients came from the administrative area and presented high prevalence rates of depressive and anxiety symptoms 64.5% and 33.8%, respectively. This data corroborates the findings from Pala et al.,2 Resende et al.,18 Marijanović et al.,19 Oliveira et al.,20 and d’Ussel et al.21 where admirative workers in health institutions present similar rates of psychological symptoms. They might benefit from specific interventions by their managers.
Nursing technicians (35% of our sample), presented a higher prevalence of anxiety symptoms than nurses, nurses assistants, and administrative workers, we found difficulties when comparing this data with similar articles since most of them did not separate the nurse's professions.2 Regarding depression symptoms, this category does not present higher prevalences, similar to the data presented by Fond et al.6
Lower levels of education might benefit from working resilience and social skills programs or, indirectly, from stimulating their bosses into changing their habits and routines in their administrative or technical approaches.22 Thus, fostering resilience includes the optimal provision of education and training, resilience training, and interventions to create a feeling of being prepared.23,24
Although most of the studied individuals (53.9%) did not mention any kind of areas of difficulty in the workplace, 32.8% reported difficulties with coworkers or bosses, which could be a risk factor since the ineffective relationship with the boss is harmful, resulting in demotivation, and difficulty in communication generating frustration, dissatisfaction and the culmination of a disharmonious relationship, as demonstrated by Jengs et al.25
It is of interest that professionals with a long time of contact with patients, such as nurses, nursing technicians, and nursing assistants, are frequently referred (49.2%) to the support service. This may be due to exposure to a higher level of stress, and strategies aimed to improve their life quality may be developed.26 Among these professionals, we found lower education levels, more females, and nursing technicians. Unfortunately, we did not investigate workplace violence, a known risk factor for mental health disorders. Still, these results are in line with the findings of female healthcare workers being the most affected group.27
Administrative staff employees also represented an important part (46.2%) of the patients, but their characteristics and sources of difficulties are shown to be different. Total BDI scores (P=0.023) ranged as moderate depression (18–29 points in BDI), and along with BDI affective cluster (P=0.019) are higher among nurses, nursing technicians, nursing assistants, and administrative staff than among other professionals of technical staff, reporting less contact with patients. These results are similar to Pala et al., who encountered an increased risk for clinically significant depressive symptoms among administrative workers when compared with physicians.2
Nursing technicians and nursing assistants reported higher somatic cluster BDI scores (P=0.012) than other professionals of technical staff, but as reported by Ross et al. these professionals were less inclined to receive a psychiatric diagnosis.28 In the linear regression model, nursing technicians scored 4.93 (0.58; 9.27, P=0.026) more points for depression at the total BDI. The excessive workload was a trigger for depressive symptoms evidencing the correlation of physical and mental overload in Taiwanese nurse assistants.8 Interventions aimed to improve physical and mental health among these professionals are recommended since they report exhausting job duties, more socioeconomic deficits, lower education, and receive lower professional training. They reported lower depressive levels than professionals from the administrative staff, as similarly described by Foster et al.12 Also, they were more likely to be diagnosed with anxiety disorders, while other professionals reported a higher rate of depressive diagnosis.
Study limitationsLimitations may include the involvement of one center only, even if data were systematically collected for twelve years and patients have been followed by the same professionals and with semi-structured academic standards. Since the database was constructed with data from professionals that were being admitted in our ambulatory, it cannot be generalized.
ConclusionThe high prevalence rate of depression and anxiety is higher among health professionals associated with difficulties seeing themselves as sick, and the social discrimination suffered by people with mental disorders can make this problem even worse. Thus, programs based on resilience, delivering, and promoting health education to support the General Hospital employees could be a great asset to detect and assist mental health disorders.
FundingNone declared.
Conflict of interestsNone declared.


