


To evaluate the correlations between body adiposity index and other adiposity indexes such as body mass index, hip and waist circumference, waist-to-hip ratio, Σ6 skinfold-thickness and percentage body fat in Colombian elite athletes.
MethodsA cross-sectional study was conducted in 149 elite athletes from Colombia (mean age: 26.3±6.5 years; height: 169.2±10.1cm; body mass: 66.1±12.8kg; body mass index 22.9±3.0kgm−1). body adiposity index, body mass index, waist-to-hip ratio, percentage body fat, Σ6 skinfold-thickness and waist circumference were also measured.
ResultsTo select an optimal surrogate for adiposity, we examined the correlation between body adiposity percentage as measured by BIA and several variables, including body adiposity index, body mass index, Σ6 skinfold-thickness, percentage body fat and waist-to-hip ratio. The regression procedure showed that there was a significant relationship between the body adiposity index and BF% (R2=0.407, p<0.01). Bland–Altman plot showed that the limits of agreement (95% confidence intervals) between the BF% and body adiposity index ranged between 15.53 and 2.26%, and there was a significant positive association between the difference and mean of the 2 methods (rho=0.607, p<0.01).
ConclusionThe adiposity indexes that include the percentage body fat and body adiposity index could be used as indicators to evaluate the corporal composition in both sport practice and research.
Evaluar la correlación entre el índice de adiposidad corporal y otros índices de adiposidad como el índice de masa corporal, la circunferencia de cintura, la circunferencia de cadera, la relación cintura-cadera, la sumatoria de pliegues cutáneos (Σ6) y el porcentaje de grasa corporal en atletas de élite colombianos.
MétodosEstudio descriptivo y transversal en 149 atletas de élite de Colombia (edad 26,3±6,5 años; estatura: 169,2±10,1cm; peso corporal: 66,1±12,8kg; índice de masa corporal 22,9±3,0 kg•m−1). El índice de adiposidad corporal, circunferencia de cintura, circunferencia de cadera, porcentaje de grasa corporal y laΣ6 pliegues cutáneos, se midieron como indicadores de adiposidad.
ResultadosLos resultados de la regresión muestran una relación significativa entre el índice de adiposidad corporal con el porcentaje de grasa corporal (R2=0,407; p<0,01). La gráfica de Bland-Altman mostró que los límites de acuerdo (intervalos de confianza del 95%) entre el índice de adiposidad corporal y el porcentaje de grasa corporal oscilaron entre 15,53 y 2,26%. Una asociación positiva y significativa fue observada entre la diferencia y la media de los 2 métodos (rho spearman=0,607; p<0,01).
ConclusiónLos índices de adiposidad que incluyen el índice de adiposidad corporal y el porcentaje de grasa corporal podrían ser indicadores para evaluar la composición corporal, tanto en la práctica del deporte como en la investigación.
The assessment of body fat percentage (BF%) in athletic populations is important in numerous circumstances, such as determining the outcomes of strength and conditioning programs and evaluating overall physical fitness and health status.1 Numerous tools and methodologies have been developed to measure body composition including laboratory methods and field methods. Four commonly used laboratory methods include hydrodensitometry (underwater weighing), air displacement plethysmography (Bod Pod, Life Measurement Instruments, Concord, CA), isotope dilution, and dual-energy X-ray absorptiometry (DXA). Field methods include bioelectrical impedance analysis (BIA), near-infrared interactance (NIR), skinfolds, and anthropometric circumference measurement.2 Although highly accurate, these methods are often too costly, time consuming, and not readily available to practitioners. Fortunately, there are other techniques that predict adiposity in field settings, such as skinfold techniques, body mass index (BMI), PB%, waist circumference (WC), waist-to-hip ratio (W/H) and bioelectrical impedance analysis.1–5 However, applied prediction methods have the risk of providing inaccurate individual estimations and are often impractical because of issues with intra- and interrater reliability, technician error, and the inability to evaluate a large group in a short time.1
Recently, the body adiposity index (BAI) was created as a clinical alternative to BMI, with all the associated benefits, i.e., reliability and rapid calculation.6 The BAI index showed a high correlation with body fat measurements performed with DXA (the dual-energy X-ray absorptiometry).6 The DXA is the gold-standard method to measure PB% in clinical methods. However, there are no studies exploring the use of the BAI specifically in Latin American athletes. This is an important area of research because negative body image and eating disorders are prevalent in this group.1
The aim of this study was to evaluate the correlation between BAI, and other adiposity indexes such as BMI, WC, W/H and PB% in Colombian elite athletes.
Methods and subjectsSubjects and procedureA cross-sectional study in 149 Colombian elite athletes from the Indervalle (Instituto Nacional de Deportes, Educación Física y Recreación del Valle del Cauca) that competed between 2008 and 2012 was performed. The subjects in the study group were 22–35 years old with a mean age±SD of 26.3±6.5, and had at least 3 years of active participation in elite sports (karate, wrestling, atheism, swimming, rowing, fencing, skating, shot put, and soccer). The study followed the guidelines and regulations governing research on humans (Resolución 008430 de 1993 del Ministerio de Salud de Colombia). Thus, after being clarified the purpose of the research and the procedures to which athletes would be submitted, all of them signed an informed consent form approved by the research ethics committee of the School of Sport Sciences of USTA and INDERVALLE. Exclusion criteria were diagnosed inflammatory or metabolic diseases (diabetes, thyroid gland disease, any other endocrine disorders, autoimmune diseases, any chronic inflammation and neoplastic disease). All variables were measured by a Level 2 anthropometrist certified by the International Society for the Advancement of Kinanthropometry (ISAK), in accordance with the ISAK guidelines7 in the morning, after an overnight fast, at the same time (9a.m.).
ProceduresHeight was measured (to the nearest 0.1cm) with a wall-mounted stadiometer (SECA 220; Seca, Ltd, Hamburg, Germany) with the subjects standing erect, without shoes. Body weight was measured (to the nearest 0.1kg) with a calibrated digital weighing scale (Tanita BWB-800A; Tanita, Corp., Tokyo, Japan) in light clothing without shoes. Body mass index was calculated as weight in kilograms divided by height in meters squared and rounded to the nearest 0.1kg−2. Hip circumference was measured over nonrestrictive lightweight shorts horizontally at the maximal extension of the gluteus maximus with the subjects standing erect and legs slightly apart. The mean of 3 measurements was recorded. Waist circumference (defined as narrowest diameter between xiphoid process and iliac crest) was measured to an accuracy of 0.1cm (British Indicators Ltd., Luton). W/H was calculated as waist circumference divided by hip circumference. Skinfold-thickness sites included triceps, subscapular, abdominal, suprailiac, anterior thigh, and medial calf (Σ6 skinfolds). These measurements were taken on the right side of the body with the Lange skinfold caliper (Holtain Ltd., Crymych, Dyfed) and were used in the assessment of PB% from the nomogram proposed by Jackson and Pollock.8 Predicted BF% was calculated by the BAI method via the following equation: BAI=hip circumference/height1.5−18.6
Data analysisAll the data were tested for their normal distribution (Kolmogorov–Smirnov test). Results are expressed as means and standard deviations (SD). The regression procedure was used to ascertain the correlation coefficient (rho spearman), shared variance (R2) and standard deviation (SD) of the BAI compared with the BMI, PB%, WC and W/H. The Bland–Altman method was used to identify the 95% limits of agreement values. Statistical analysis was carried out using IBM SPSS Statistics 20.0 software (SPSS/IBM, Chicago, IL, USA). A priori statistical significance was set at p<0.05.
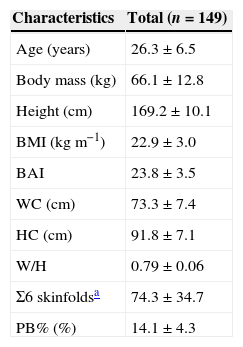
ResultsAnthropometrical characteristics of the 149 participants are summarized in Table 1.
Anthropometric characteristics of participants in the study (mean±SD).
| Characteristics | Total (n=149) |
|---|---|
| Age (years) | 26.3±6.5 |
| Body mass (kg) | 66.1±12.8 |
| Height (cm) | 169.2±10.1 |
| BMI (kgm−1) | 22.9±3.0 |
| BAI | 23.8±3.5 |
| WC (cm) | 73.3±7.4 |
| HC (cm) | 91.8±7.1 |
| W/H | 0.79±0.06 |
| Σ6 skinfoldsa | 74.3±34.7 |
| PB% (%) | 14.1±4.3 |
BMI: body mass index; BAI: body adiposity index; WC: waist circumference; HC: hip circumference; W/H: waist-to-hip ratio; PB%: percentage body fat.
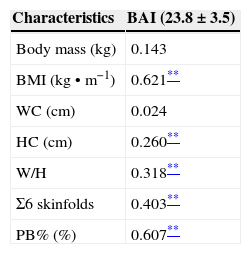
To select an optimal surrogate for adiposity, the correlation between body adiposity measured by BAI and several easily measured variables was examined: BAI, PB%, BMI and W/H (Table 2). To select an optimal surrogate for adiposity, we examined the correlation between body adiposity percentage as measured by BIA and several variables, including BAI, BMI, skinfold-thickness, PB% and W/H. The correlation between BAI and BMI (rho=0.621, p<0.01); BAI and PB% (rho=0.607, p<0.01), BAI and Σ6 skinfold-thickness (rho=0.403, p<0.01); BAI and hip circumference (rho=0.260, p<0.01), BAI and W/H (rho=0.318, p<0.01) for W/H.
Corporal correlation matrix among BAI from body mass, BMI, waist and hip circumference, W/H, skinfolds and PB%.
| Characteristics | BAI (23.8±3.5) |
|---|---|
| Body mass (kg) | 0.143 |
| BMI (kg•m−1) | 0.621** |
| WC (cm) | 0.024 |
| HC (cm) | 0.260** |
| W/H | 0.318** |
| Σ6 skinfolds | 0.403** |
| PB% (%) | 0.607** |
BMI: body mass index; BAI: body adiposity index; WC: waist circumference; HC: hip circumference; W/H: waist-to-hip ratio; PB%: Percentage body fat.
The regression procedure showed that there was a significant relationship between the BAI and BF% (R2=0.407, p<0.01, Fig. 1A). Bland–Altman plot of the difference in BF% between the BAI and body fat percentage (BF%) determined via-nomogram proposed by Jackson and Pollock is represented in Fig. 1B. The limits of agreement (95% confidence intervals) between the BF% and BAI ranged between 15.53 and 2.26%.
 Scatterplot representing the significant relationship (R2=0.407, p<0.01) between body fat percentage estimated by the body adiposity index (BAI) and body fat percentage (BF%) determined via-nomogram proposed by Jackson and Pollock. The middle line represents the regression slope. (B) Bland–Altman plot comparing body fat estimated by the BAI with the criterion of BF%. The solid line represents the CE or mean bias. The 2 outside dashed lines represent the upper and lower limits of agreement (9.901 SD). The dashed-dotted regression line represents the significant positive association (2.879, p<0.01) between the difference of methods and the mean of both methods. BAI=body adiposity index; BF%=body fat percentage; CE=constant error.")
(A) Scatterplot representing the significant relationship (R2=0.407, p<0.01) between body fat percentage estimated by the body adiposity index (BAI) and body fat percentage (BF%) determined via-nomogram proposed by Jackson and Pollock. The middle line represents the regression slope. (B) Bland–Altman plot comparing body fat estimated by the BAI with the criterion of BF%. The solid line represents the CE or mean bias. The 2 outside dashed lines represent the upper and lower limits of agreement (9.901 SD). The dashed-dotted regression line represents the significant positive association (2.879, p<0.01) between the difference of methods and the mean of both methods. BAI=body adiposity index; BF%=body fat percentage; CE=constant error.
Fig. 2A shows the scatterplot representing the significant relationship (R2=0.170, p<0.01) between body fat percentage estimated by the BAI and BMI. Fig. 2B, shows the Bland–Altman plot comparing body fat estimated by the BAI and BMI. The limits of agreement (95% confidence intervals) between the BF% and BMI ranged between −8.19 and 10.11%.
 Scatterplot representing the significant relationship (R2=0.170, p<0.01) between body fat percentage estimated by the body adiposity index (BAI) and body mass index (BMI). The middle line represents the regression slope. (B) Bland–Altman plot comparing body fat estimated by the BAI and BMI. The solid line represents the CE or mean bias. The 2 outside dashed lines represent the upper and lower limits of agreement (0.957 SD). The dashed-dotted regression line represents the significant positive association (4.668, p<0.01) between the difference of methods and the mean of both methods. BAI=body adiposity index; BMI=body mass index; CE=constant error.")
(A) Scatterplot representing the significant relationship (R2=0.170, p<0.01) between body fat percentage estimated by the body adiposity index (BAI) and body mass index (BMI). The middle line represents the regression slope. (B) Bland–Altman plot comparing body fat estimated by the BAI and BMI. The solid line represents the CE or mean bias. The 2 outside dashed lines represent the upper and lower limits of agreement (0.957 SD). The dashed-dotted regression line represents the significant positive association (4.668, p<0.01) between the difference of methods and the mean of both methods. BAI=body adiposity index; BMI=body mass index; CE=constant error.
The BAI was introduced in 2011 as a new method of estimating BF%.6 It was primarily developed as a possible replacement to BMI for classifying individual adiposity. To the best of our knowledge this is one of the first studies focused on Colombian elite athlete that evaluates the applicability of BAI as a method to determine adiposity in this population.6 The important result was the mean difference between BAI, BP% and BMI was not different with the sample of Colombian athletes.
In contrast to BMI, BAI calculation uses an anthropometric parameter (measurement of hip circumference) that is influenced by sex. Perhaps the most essential problem encountered in the present study is that the BAI does not address the difference in body fat allocation risk. Previous studies had shown that BMI was not a good indicator of cardiovascular risk, particularly when it was used as the only indicator, mainly because it is not able to differentiate between adipose and muscle tissue.9,10
Furthermore, BMI is not useful to differentiate between fat compartments, an essential issue because visceral adipose tissue has been shown to be more associated with cardiovascular risk than subcutaneous adipose tissue.10 Lopez et al. (2011)11 indicated that the measurement of body fat mass by BAI method is not accurate enough. Very close correlation between BAI and PB% rho=0.607, p<0.01 was shown (even closer than the correlation between BMI rho=0.621, p<0.01 and Σ6 skinfolds rho=0.403, p<0.01), the applicability of the BAI has been demonstrated only in two different sedentary populations (Mexican Americans and African Americans),6,11 but not in elite athletes. Nevertheless it has been shown that BAI is not applicable to Caucasian women11 because there was no statistically significant difference between the correlations registered for percentage body fat and BMI, or hip circumference. On the other hand, it has been shown that skinfolds, the best indicator of visceral adipose tissue, is the best predictor of adiposity.2,12 Another important result of this study was that W/H, HC or WC are not adequate for estimation of adiposity in athletes. This finding is probably because of individual differences in the cross-sectional area of the lean skeletal muscles that reside in the hip region (e.g., gluteus maximus). These muscles are highly activated with lower-body resistance exercises,1,13,14 which athletes commonly perform. Thus, the leaner athletes in the study may have had greater hip circumferences because of larger hip musculatures even though BF% was low. In this regard, the use of BAI for pre- and post-assessment of an athlete would show an increased BF% after training when the only possible change that occurred was increased hip girth because of muscular hypertrophy. In consideration of the findings, the BAI is not recommended for predicting individual BF% in Colombian athletes.
ConclusionThe present study results described that correlation between BAI and BMI (rho=0.607, p<0.01) and PB% (rho=0.607, p<0.01). Based on these results and those of other studies, it is concluded that the adiposity indexes that include the PB%, and BMI may be more adequate to measure corporal composition in both sport practice and research. Because of the results of this investigation, practitioners could use BAI for predicting individual BF% for Latin American athletes.
Conflict of interestThe authors declare that they have no conflict of interest.