


Objetivo. Correlacionar el método tradicional y el sistema informatizado de análisis dermatográfico.
Método. Muestra de n = 15 individuos, siendo dos evaluadores vs dos métodos vs la muestra. Se utilizó el protocolo de Cummins y Midlo por los métodos: informatizados (M1) y tradicional (M2). Para observar la correlación entre los dos métodos, computarizado y tradicional, se utilizó la correlación de Pearson. Con el fin de evaluar la reproducibilidad de los dos métodos, se utilizó el test t de Student pareado para comparar las variaciones internas de los dos métodos, basado en las dos medidas obtenidas por los mismos dos evaluadores observados.
Resultados. Se observó que el M1 presenta una capacidad mayor de identificación cuantitativa del número de líneas. M1 es más eficiente, potencializando el nivel de positividad. No hubo diferencia significativa entre las observaciones de los evaluadores intra (M1 vs M2) e inter (evaluador 1 vs evaluador 2), demostrando la capacidad de reproducibilidad y confiabilidad de M1. En la comparación de las variaciones internas de los dos métodos, existen diferencias significativas entre los valores medios de los cuadrados de las diferencias interevaluadores, y M2 presenta una amplitud 4 veces mayor.
Conclusión. Los resultados sugieren que M1 es un instrumento eficaz en la captura, estructuración del diseño y análisis de las huellas digitales por el método dermatográfico, condición sine qua non para la aceptación y reconocimiento científico de los nuevos instrumentos.
Objective. To correlate the traditional method and a computerized system of dermatoglyphic analysis.
Methods. Sample of 15 individuals, with two investigators using two methods for each sample. The protocol by Cummins and Midlo was used with the following methods: computerized (M1) and traditional (M2). Pearson's correlation was used to observe the correlation between a computerized system and the traditional system. Student's paired t-test was used to evaluate the reproducibility of both methods, with the aim to compare the internal variations based on two measurements obtained by two investigators for the same observation.
Results. M1 had a greater quantitative capacity for identifying the number of lines. M1 was more efficient, with a higher level of positivity. There was no significant difference between the intra- (M1 and M2) and inter-investigator (investigator 1 versus investigator 2) observations, demonstrating the reproducibility and reliability capacity of M1. There were significant differences between the mean values of the squares of the inter-investigator differences (the amplitude of M2 was 4 times greater).
Conclusion. These results significantly correlate the computerized and traditional methods, which qualifies M1 as the instrument for the capture, structuration of the design and analysis of the digital fingerprints through a dermatoglyphic method using the digital fingerprint marker, which is the essential condition to acceptance and scientific recognition of new instruments.
INTRODUCTION
Dermatoglyphics is a growing research área1-6 because fingerprints are recognized as dermal representations of genetic characteristics7, and thus, they are a genetic marker2,3,8,9. The observation of these markers represents a powerful tool for analyzing the recognition of dermatoglyphic patterns in different kinanthropometric characteristics10-17.
The dermatoglyphic analysis presented by Cummins and Midlo7 should be performed to observe fingerprints as a genetic marker. However, the traditional method is time consuming, not very agile and depends on skilled individuals. According to reports from researchers, the expertise in quantitative interpretation is not different because finding specific indicators, such as cores, deltas and line counts, based on the collected print, is quite complex and requires extensive training and experience. Because the process of data collection, qualification and quantification is slow, studies have small samples.
The magnifying power of the magnifying glass is a limiting factor for image magnification of the image produced by the traditional method, i.e., the prints made by pressing the epidermal ridges on paper using ink. The lack of adequate definition of the printed image, the difficulty in finding and managing specific information on an individual when collecting numerous samples and the changes resulting from typing errors when transferring data to a spreadsheet raise doubts about the results, which may lead to an inaccurate assessment.
The feasibility of the computerized dermatoglyphic method7 can effectively optimize the analysis process, allowing an increase in studies with numerous populations and, as a consequence, the expansion of the possible observations.
The present study aimed to correlate the traditional method and the computerized system of dermatoglyphic analysis.
METHOD
Participants
The non-probability sample consisted of 15 individuals. They were volunteers and police officers from the Bureau of Identification of the state of Pará Civil Police (Diretoria de Identificação da Polícia Civil do Estado do Pará) in Brazil. Seven women and eight men with an average age of 39.8 ± 5.4 years old were intentionally chosen, and individuals with fingerprints characterized as anomalies by the dactyloscopy division of the Identification Board of the state of Pará Civil Police in Brazil were excluded from the sample. The project was approved by the Research Ethics Committee of the University of Western Santa Catarina (Universidade do Oeste de Santa Catarina - Unoesc), Joaçaba Campus, Brazil (Protocol number 067/2006) and was in accordance with the Helsinki Declaration and Resolution No. 196/96.
Procedures
The dermatoglyphic protocol proposed by Cummins and Midlo7 was chosen for the fingerprint analysis using two different methods, namely: a computerized method for the processing and analysis of fingerprints by the dermatoglyphic method (M1) and the traditional method for dermatoglyphic characteristics identification (M2). For M1, a Smiths Heimann Biometrics LSCAN 100R scanner was used to capture the fingerprint images, with algorithms for noise reduction and image enhancement and a software program for user interaction with the row count, design type determination, storing of images collected and statistical reporting. The image interpretation was performed by the VeriFinger SDK, which removes noise from the image, using pre-processing to improve it. Then, the Leitor Dermatoglífico (Dermatoglyphic Fingerprint Reader) software performed a treatment on the image. After all the images were collected, the user of the Leitor Dermatoglífico (Dermatoglyphic Fingerprint Reader) selected the images one by one to define the points (core and delta) and automatically trace Galton's Line so that the software, using specific algorithms, can make the intersection of the line drawn with the lines of the fingerprint, thus providing the number of lines in each finger and the design type of each fingerprint. The Leitor Dermatoglífico (Dermatoglyphic Fingerprint Reader) software was developed in the Object Pascal, Delphi 7 programming environment and Firebird database management system (DBMS), allowing for the security of the information collected and a reliable performance for the user. The actions occurred in the following order: LSCAN 100R scanning, image processing in VeriFinger SDK, image processing and production, and the creation and management of statistical reports by the Leitor Dermatoglífico (Dermatoglyphic Fingerprint Reader) software program.
For M2, the traditional materials and processes were used for the data collection, observation and transcription. A paper with an average density and roughness (A4 bond paper) and a pad to collect fingerprints (Impress, Model: 250, 2001) were used, and the pulp of the distal phalanx was covered with ink. After the collection, the investigator performed a qualitative identification of images and a quantitative identification of the lines by using a magnifying glass and recorded the results observed on the collection sheet. Then, the data were entered in a spreadsheet.
Both methods of data collection were performed by two investigators who were dactyloscopy experts and were also police officers of the Identification Bureau of the state of Pará Civil Police in Brazil and researchers in dermatoglyphics. These professionals were chosen to minimize the intra and inter-investigator errors and to qualify the collected and analyzed results.
The use of two investigators using two methods to record 15 observations resulted in a sample size of 30 for each intersection.
Statistical analysis
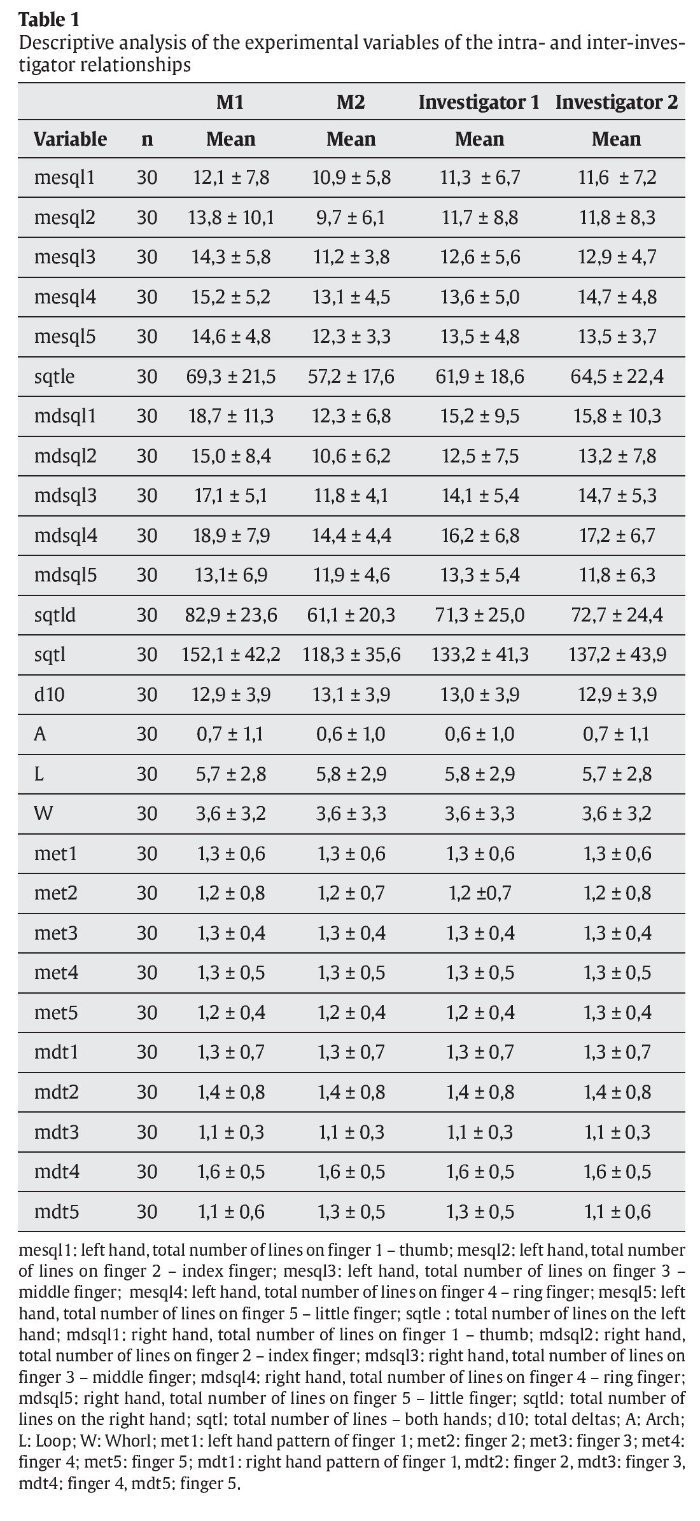
For the statistical analysis, the data are presented as the mean and standard deviation. For the inferential analysis, the Kolmogorov-Smirnov test was initially used to verify the normality of the sample in the set of observations. When the normality of the sample was confirmed, a parametric statistical test and an analysis of variance (ANOVA) were performed, which were followed by Tukey's post-hoc test to identify the possible differences between the variables, as follows: left hand, total number of lines on finger 1 - thumb (mesql1); left hand, total number of lines on finger 2 - index finger (mesql2); left hand, total number of lines on finger 3 - middle finger (mesql3); left hand, total number of lines on finger 4 - ring finger (mesql4); left hand, total number of lines on finger 5 - little finger (mesql5); total number of lines on the left hand (sqtle); right hand, total number of lines on finger 1 - thumb (mdsql1); right hand, total number of lines on finger 2 - index finger (mdsql2), right hand, total number of lines on finger 3 - middle finger (mdsql3); right hand, total number of lines on finger 4 - ring finger (mdsql4); right hand, total number of lines on finger 5 - little finger (mdsql5); total number of lines on the right hand (sqtld); total number of lines - both hands (sqtl); and total deltas (d10). The non-parametric Wilcoxon test for paired samples was used for images of the following fingerprints because they did not show a normal distribution: Arch (A); Loop (L); Whorl (W); left hand pattern of finger 1 (met1), finger 2 (met2), finger 3, (met3), finger 4 (met4) and finger 5 (met5); and right hand pattern of finger 1 (mdt1), finger 2 (mdt2), finger 3 (mdt3), finger 4 (mdt4) and finger 5 (mdt5). To observe the correlation between the computerized and the traditional system, Pearson's correlation was used. Student's paired t-test was used to evaluate the reproducibility of both methods, with the aim to compare the internal variation based on the two measurements obtained by two investigators for the same observation. For this purpose, the squared difference was considered as the analytical value according to the following mathematical model:
Squared differenceObservedi & Methodi= (observer1i - observer2j)2
A significance level of p < 0.05 was adopted for rejecting the null hypothesis. The data were treated using the SPSS 14.0 software.
RESULTS
The first observations of the statistical treatment used are shown in table 1. This table shows the descriptive values, mean and standard deviation of the experimental variables collected in the two possible segmentations, i.e., method and investigator.

Table 2 shows the test of the null hypotheses obtained in each of the comparative processes observed (intra-group and inter-group), according to each independent variable.

A factorial ANOVA test (method and investigator) with a significance level of p < 0.05 was performed on the group of variables defined as parametric. Then, if the models were different, a one-way ANOVA test combined with Tukey's test was performed for the dependent variable that differed while always observing the paired variables. Additionally, Bartlett's test for homogeneity of variance was used to compare the variances of the segmented groups according to the dependent variables.
The differences regarding parametric variables, whose frequency distributions were not significantly different from a normal distribution, occurred according to the segmentation of the independent variable method (9 in 14). Thus, all differences expressed had mean values of M1 that were significantly higher than the mean values of M2. No significant differences were found in the final result of the factorial ANOVA for repeated measures (AB). This result indicates that the variances are compensatory relationships between the mean values.
The differences between the mean values according to the method indicate that M1 > M2, thus showing that M1 has a greater ability to quantitatively identify the number of lines when compared to M2. This result supports the hypothesis that M1 is more efficient than M2, which has been the method used until now, because M1 is an electronic magnifier that magnifies the image collected, increasing the visual acuity and, consequently, increasing the level of assertiveness in the process of counting the observed lines.
The absence of significant differences between the observations of the intra- (M1 versus M2) and inter-investigations (investigator 1 versus investigator 2) is an important finding of this treatment. This result adds reproducibility and reliability to M1. These data are displayed in the correlation matrix of the observations of the two discretionary variables, as shown in table 3.

According to the correlation matrix of coefficients, there is a significant correlation between the respective means of the different methods and the different investigators.
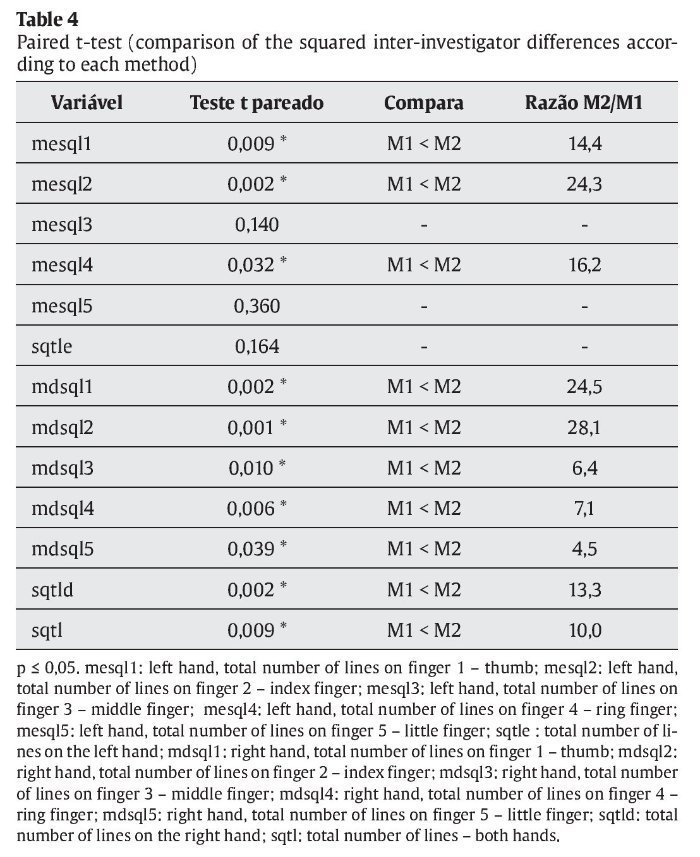
Aiming to compare the internal variation of the two methods based on the two measures obtained by the two investigators for the same observation, the squared differences were considered to be the analytical values.
The squared differences were chosen to evaluate only the differences between the measurements obtained by the investigators according to each method (j) for each observation (i). The results displayed in table 4 show that there are significant differences between the mean values of the inter-investigator squared differences in the two methods. Among the significant and clear differences, the M1 differences are significantly lower than the ones observed in M2. Therefore, M2 has an amplitude that is approximately 4 times (14.9 = 3.86 ~ 4 times) higher than that observed in M1. Thus, M1 has a greater convergence in the inter-investigator evaluations and, hence, greater reproducibility.

For the non-parametric variables, the Wilcoxon non-parametric test was applied using a significance level of p < 0.05, by taking into consideration the method and investigator. The results are shown in table 5.
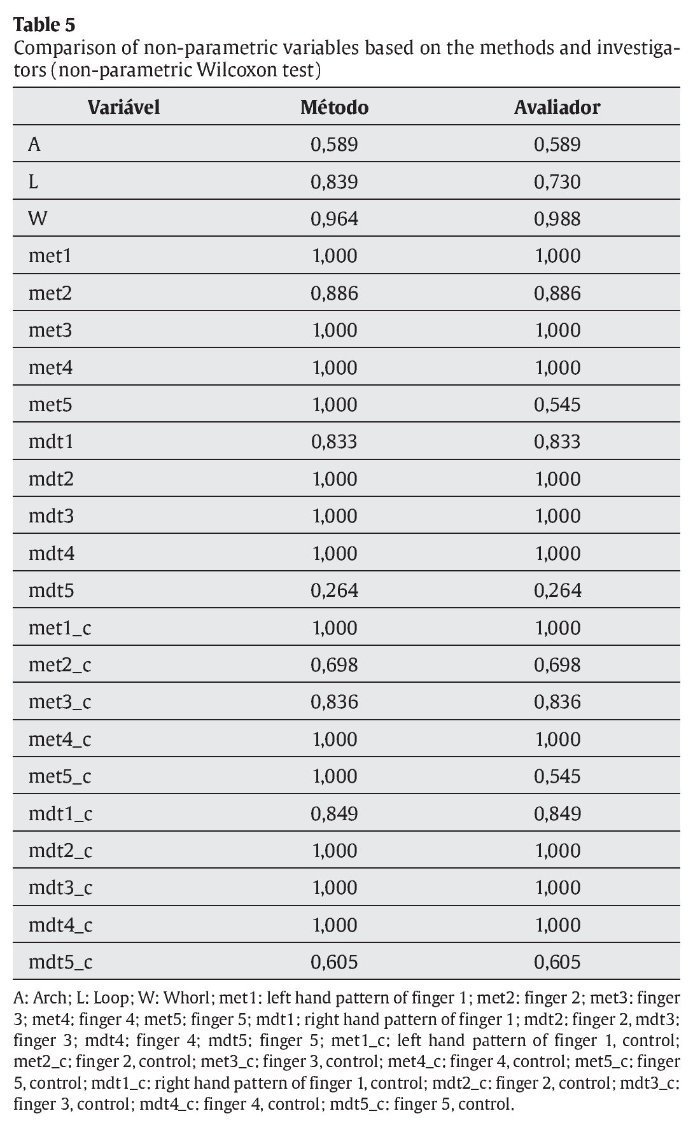
Table 5 shows that for both discretionary variables, i.e., model and investigator, there are no significant differences between the distributions of the groups. This result suggests that the two methods have a parallelism and that their evaluations are superposed. Thus, they are not significantly different, except for the amplitudes of the differences, which were significantly greater in M2.
DISCUSSION
New technology is a real tool of great importance for the investigation and qualification of scientific research. Additionally, in this case, the new instruments contribute to the formulation of new concepts for the observations and anthropometric analyses.
When observing the process of anthropometric evaluations of individuals, the promotion of human health can be increased because this is one of the factors that lead to the desired accuracy in prescriptions and referrals of physical activity and, consequently, to the quality of life15.
In the proposed statistical observation, the correlation between the methods is evident, which qualifies the computerized method as a valid instrument for dermatoglyphic research. In this case, the correlation is crucial for affirming the development of new technologies and applications for this method, which met the criteria of adequate knowledge, perceived applicability and scientific support.
Dermatoglyphics, which starts with an observation of the genetic potential, has the computerized method as a possible quantifying and qualifying tool for analyzing the marker, allowing for a technological evolution in the collection, processing, storage and mathematical treatment of the marker. The potential of statistical analysis of data that can be observed on fingerprints creates possibilities for pattern recognition for the different dermal representations, with the ability to process information intersections that are still unachievable by the traditional method.
The collection of fingerprints by the traditional method provides a unique method of storing images, i.e., the physical storage of sheets on files, which hinders the recovery of information on the data reported and their location. With the computerized method, all images and data collected are stored virtually, using 4.7 megabytes per individual. Retrieving the image or information depends exclusively on a programmable command, allowing access to data on individuals, groups or even a combination of any of the registered items at any time.
In the present study, when observing the time spent by the experts for collecting fingerprints, determining the points (core and delta), counting lines, identifying images, recording data and transferring them to the spreadsheet, the following values were found (in minutes per individual): 3.48 ± 0.8 for the computerized method and 36.02 ± 2.06 for the traditional method. The average time spent by the investigators when performing the computerized method represented 9.6 % of the average time spent performing the traditional method. This could allow increased sample sizes in future studies because delays in the collection, description and analysis of data are one of the factors reported by researchers as a barrier to studies with large groups.
The qualitative and the quantitative intersection of information on genotypic characteristics resulting from the use of the computerized method will allow a mathematical treatment when searching for pattern recognition, which will enable the investigation of new characteristics implemented from the fingerprint marker. This process is directly linked to the identification of the complex possibilities of dermatoglyphics.
Scientific studies correlating the computerized systems of the dermatoglyphic method with the traditional method were not found in the known scientific literature. Similar computerized systems were developed in other countries for use in health care18,19. However, the authors did not correlate them with the traditional method proposed by Cummins and Midlo7, thus not allowing for a comparative analysis between other results.
In conclusion, the results show the computerized method (M1) is an effective tool for capturing, structuring the design of and analyzing the fingerprints by the dermatoglyphic6 method, a sine qua non condition for the acceptance and recognition of new scientific instruments.
Conflict of interest
The authors declare that they have no conflict of interest.
RESUMO
Objetivo. Correlacionar o método tradicional e o sistema informatizado de análise dermatoglífica.
Métodos. Amostra de n = 15 indivíduos, sendo dois avaliadores versus dois métodos versus amostra. Utilizou-se o protocolo de Cummins e Midlo pelos métodos: informatizado (M1) e tradicional (M2). Para observar a correlação entre o sistema informatizado e o tradicional, utilizou-se a correlação de
Pearson. Com o intuito de avaliar a reprodutibilidade dos dois métodos, utilizou-se o teste t de Student pareado, a fim de comparar as variações internas dos dois métodos, tendo como base as duas medidas derivadas dos dois avaliadores para um mesmo observado.
Resultados. Observou-se que o M1 apresenta uma capacidade maior de identificação quantitativa do número de linhas. M1 é mais eficiente, potencializando o nível de assertividade. Não houve diferença significativa entre as observações dos avaliadores intra (M1 versus M2) e inter (avaliador 1 versus avaliador 2), demonstrando a capacidade de reprodutibilidade e confiabilidade do M1. Na comparação das variações internas dos dois métodos, existem diferenças significativas entre os valores médios dos quadrados das diferenças interavaliadores, e M2 apresenta amplitude 4 vezes maior.
Conclusões. Os resultados sugerem o que M1 é um instrumento eficaz na captura, estruturação do desenho e a análise das impressões digitais pelo método dermatoglífico6, condição sine qua non para a aceitação e o reconhecimento científico de novos instrumentos.
Palavras-chave: Dermatoglifia. Software. Antropometria.
History of the article:
Received February 20, 2013
Accepted July 17, 2013
Correspondence:
R. J. Nodari Júnior.
Rua Rui Barbosa 411, apto 401.
CEP: 89.610-000 Herval d'Oeste Santa Catarina. Brasil
E-mail: rudynodari.junior@unoesc.edu.br
