


Objectives. This study investigated the cardiac autonomic profile and cardiopulmonary responses at rest and after maximal treadmill exercise testing with or without pre-exercise stretching.
Methods. Eight men (age = 24.6 ±mm 5.5 years; height = 179 ±mm 4.1 cm; mass = 78.1 ±mm 3.4 kg; body mass index = 24 ±mm 2.5 kg/m-2; body fat = 18.9 #mm 4.3%) completed a maximal treadmill exercise test under two randomly ordered conditions: pre-exercise stretching (PES) and no stretching (CONTROL). Electrocardiogram (ECG) and respired gas analysis were continuously recorded at rest, during, and for 5 min following exercise testing. The stretching exercises for the PES condition consisted of six passive stretches comprising upper and lower body muscle groups performed three times each for 30 sec with 10 sec passive rest between repetitions.
Results. The results indicated that the rMSSD was significantly (p < 0.01) faster for the CONTROL versus the PES condition during the 5 min following exercise testing. Additionally, significantly lower low-frequency power (PES = 3.20 ±mm 1.14 ms2; CONTROL= 24.65 ±mm 7.57 ms2; p < 0.001) and total power (PES = 23.57 ±mm 7.41 ms2; CONTROL = 195.90 ±mm 46.37 ms2; p < 0.001) responses were visually detected for the PES versus CONTROL condition following exercise testing. Anaerobic threshold was decrease in PES when compared to CONTROL conditions.
Conclusion. These data indicate that PES promotes dysfunction in the tonic cardiac autonomic regulation as evidenced by delayed parasympathetic reactivation, during the initial 5 minutes of recovery following maximal exercise testing.
Objetivos. Este trabajo investiga el perfil autonómico cardiaco y las respuestas cardiopulmonares en reposo y después de las pruebas de esfuerzo máximo con o sin estiramiento antes del ejercicio.
Métodos. Ocho varones (edad = 24,6 ±mm 5,5 años; talla = 179 ±mm 4,1 cm; peso = 78,1 ±mm 3,4 kg; índice de masa corporal = 24 ±mm 2,5 kg/m2; grasa corporal = 18,9 ±mm 4,3%) completaron una prueba de esfuerzo máximo en cinta bajo dos condiciones: estiramiento antes del esfuerzo (EAE) y ningún estiramiento (CONTROL). ECG y análisis de gas inspirado se registraron continuamente en reposo, durante y 5 minutos después de la prueba de esfuerzo. Los ejercicios de estiramiento constaban de seis estiramientos pasivos que comprenden los grupos de músculos superiores e inferiores del cuerpo.
Resultados. rMSSD fue significativamente (p < 0,01) más rápida para la condición CONTROL frente a la condición EAE durante los 5 minutos después de las pruebas de esfuerzo. Respuestas de energía de baja frecuencia (EAE = 3,20 ±mm 1,14 ms2; CONTROL = 24,65 ±mm 7,57 ms2; p < 0,001) y de energía total (EAE = 23,57 ±mm 7,41 ms2; CONTROL = 195,90 ±mm 46,37 ms2; p < 0,001) fueron significativamente más bajas en la condición EAE después de las pruebas de esfuerzo. El umbral anaeróbico se disminuyó en la condición EAE frente a la condición CONTROL.
Conclusión. El presente estudio sugieren que el EAE promueve la disfunción en la regulación tónica autonómica cardiaca durante los primeros 5 minutos de recuperación después de las pruebas de esfuerzo máximo.
Introduction
Cardiopulmonary exercise testing is commonly conducted in clinical practice and provides substantial diagnostic and prognostic information1,2. Furthermore, cardiopulmonary exercise testing incorporates breath-to-breath ventilatory analysis from which maximal oxygen consumption (VO2 max.) is determined3. Moreover, cardiopulmonary exercise testing can be a predictor of cardiac dysfunction and can serve as an effective modality to monitor physiological responses following pre-exercise interventions. The analysis of heart rate variability (HRV) in time and frequency domains provides a noninvasive method to establish the autonomic regulation of the heart rate (HR), identifying inherent rhythmic fluctuations in neural activity direct to the sinus node, and also allows the determination of the parasympathetic and sympathetic frequency oscillations to the heart4. Thus, the HRV assessment is considered as potential predictor of the risk for cardiovascular disease.
Static stretching is used to lengthen muscles and associated tendons, thus acutely reducing the elasticity of musculotendinous complexes. Static stretching that is repeated with sufficient frequency and intensity will enhance joint range of motion5,6. However, the utilization of static stretching as a warm-up modality has been questioned due to potential decreases in musculotendinous stiffness, and associated reductions in force and power production7.
Some studies suggest that stretch-induced decreases in force and power are neurologically related to the decreased sensitivity of muscle spindles and peripheral slackening of the musculotendinous unit8,9. With relevance to aerobic exercise, the activation of muscle spindles may signal the initial cardiac acceleration10 to meet greater coronary blood flow and metabolic requirements11. This response seems to be evoked by stimulation of groups III (mechanosensitive) and IV (metabosensitive) muscle afferents (according to the temperature, chemical and the mechanical environment) being favorable to a reflex increase in sympathetic nerve activity that promote a greater heart rate and arterial blood pressure12,13.
However, limited studies have examined the decrease in musculotendinous stiffness induced through pre-exercise stretching and the potential effect on cardiac responses during and following maximal cardiopulmonary exercise testing10,14. Therefore, the purpose of this study was to investigate the cardiac autonomic profile and cardiopulmonary responses to maximal treadmill exercise testing when preceded by pre-exercise stretching versus non-stretching conditions.
Methods
Subjects
Eight men [age = 24.6 ± 5.5 years; ± 4.1 cm; weight = 78.1 ± 3.4 kg; body index mass (BMI) = 24 ± 2.5 kg/m-2; body fat = 18.9 ± 4.3%] with at least five years of consistent participation in aerobic exercise (4 times a week) were asked to participate in the current study. All subjects passed the Physical Activity Readiness Questionnaire - PAR-Q15 -, IPAQ16 and signed an informed consent according to the Declaration of Helsinki. All subjects were considered healthy on the basis of history, physical examination, and normal resting electrocardiogram (ECG). The experimental procedures were approved by the Ethics Committee of the Federal University of Rio de Janeiro. The following additional exclusion criteria were adopted: a) use of drugs that could affect the cardio-respiratory responses; b) bone, joint or muscle diagnosed problems that could limit the execution of the resistance exercises; c) systemic hypertension (≥ 140/90 mm Hg or use of antihypertensive medication); d) metabolic disease; e) no achieving the target heart rate of 85% of maximal age-predicted heart rate.
Body weight was measured to the nearest 0.1 kg using a calibrated physician's beam scale (model 31, Filizola, São Paulo, Brazil). Height was determined without shoes to the nearest 0.1 cm using a stadiometer (model 31, Filizola) after a voluntary deep inspiration. Body-mass index (BMI) was calculated as body weight divided by height squared (kg/m-2). Body fat percentage (%) was estimated using the seven-site skinfold procedures according to Jackson AS and Pollock ML17.
Treadmill maximal exercise testing
All testing was performed between 1:00 and 3:00 PM. Subjects received a light lunch 2 h before the test. Coffee, tea and alcohol intake was prohibited for 12 h and subjects avoided formal and strenuous exercise for 48 h before testing. Tests were performed on a motor-driven treadmill (Inbramed 10200, Brazil) using a ramp protocol, wherein the rate of increment in speed and inclination was determined individually by the subjects with the goal of reaching volitional exhaustion in approximately 8 to 12 min. The test was preceded by a 3-min warm-up followed by incremental increases in speed and incline at every 1-minute stage. The test was terminated when the subject stopped because of exhaustion. However, subjects were verbally encouraged to continue as long as possible. Subjects were allowed sufficient practice during preliminary testing to become familiar with the treadmill. Ambient air temperature was 22ºC to 24°C.
Testing was symptom limited and was terminated if subjects reported dyspnea, chest pain, or for medical reasons including horizontal or down-sloping ST-segment depression of ≥ 1 mm, ST segment elevation > 1 mm in non-Q wave lead, atrial fibrillation or supra ventricular tachycardia (suggestive of the left bundle branch block), abnormally elevated blood pressure response (blood pressure ≥ 220 × 120 mm Hg), fall in systolic blood pressure (> 20 mm Hg), variation in diastolic pressure under stress greater than 15 mm Hg, presyncope, severe arrhythmias, presence of extrasystoles, ataxia or ventricular ectopy (presence of 6 or more premature ventricular beats per minute in recovery) and development of bundle-branch block or Intraventricular Conduction Delay (IVCD) that cannot be distinguished from ventricular tachycardia3.
Passive stretching exercises
Pre-exercise stretching (PES) condition consisted of six passive stretches comprising upper and lower body muscle groups performed three repetitions each for 30 sec with 10 sec passive rest between repetitions. The passive stretching condition included:
1) Hamstring stretch each leg (supine position).
2) Standing pectoral stretch.
3) Quadriceps stretch each leg (supine position).
4) Standing levator scapulae arm stretch.
5) Calf stretch each leg (supine position).
6) Standing posterior shoulder capsule stretch each arm.
During each stretch, the range of motion was increased until the person subjectively perceived mild discomfort. After the stretching regime was completed, the subjects immediately began treadmill maximal exercise testing. All subjects completed a maximal treadmill exercise test under two randomly ordered conditions: PES and no stretching (CONTROL). The second maximal treadmill exercise test occurred 72 hours following the first exercise test.
Heart rate variability
ECG was continuously recorded at a sampling rate of 1 kHz and amplitude resolution of 12 bits using a 12-lead ECG monitor system (CONTEC, model 8000D, USA). A standard resting 12-lead ECG was recorded digitally using the same equipment (response frequency 25 mm/s and 10 mm/mV amplitude); all data were stored and analyzed off-line. Heart rate and the RR time series were extracted from 5-min pre and post treadmill maximal exercise testing. The HRV variables (time-domain and frequency-domain) were calculated using system specific algorithms from analysis of the V5-lead recording (version Matlab 7.0, The MathWorks, Inc, Natick, MA).
The following time-domain of HRV variables were analyzed: the mean of all normal RR intervals during the 5-min. recording (RR); the standard deviation of normal R-R intervals (SDNN); the number of interval differences of successive NN intervals greater than 50 ms (NN50); the percentage of normal RR intervals that differ by > 50 ms (pNN50); and the square root of the mean of the mean squared differences of successive RR intervals (rMSSD)4.
For frequency-domain analysis, RR intervals time series were resampled to equal intervals by spline cubic interpolation method at 2 Hz, and data were detrended by removing the mean value and the linear trend. The method for calculating the power spectrum was by Fast Fourier Transformation (Welch's periodogram was employed to assess the 1024-point spectral with a Hanning window and 50% overlap). Spectral power was obtained by integrating the power spectrum density (PSD) function in the very low-frequency component (VLF: 0.0033 and 0.04 Hz.); the low-frequency component (LF: 0.04-0.15 Hz); and, the high-frequency component (HF: 0.15 - 0.40 Hz). Total power was estimated as the area under the spectrum within these frequency ranges. Normalized HF [HFnu = HF/(total power - VLF) X 100], normalized LF [LFnu = LF/(total power - VLF) X100], and LF/HF index were calculated4.
Respired gas analysis
The oxygen consumption (VO2) mask and equipment were fastened to subjects after being positioned on the motor-driven treadmill. A face mask (Hans Rudolph V MaskTM) covered the mouth and nose and was attached to a bi-directional digital flowmeter and fastened to the subjects with a mesh hairnet and Velcro straps. The respired gas analysis began by assessing the subjects at rest for five minutes with the Fit-Mate-ProTM (Cosmed, Rome - Italy). To establish a resting state, the following variables were considered: resting VO2 at 3.5 mL/kg/min-1 and minute ventilation (VE) between 8 and 15L/min3. Heart rate was continuously monitored using a V5-lead ECG monitor system (CONTEC, model 8000D, USA) and measurements of VO2, VE, and respiratory rates were assessed every three complete respiratory cycles at rest, during, and after treadmill maximal exercise testing. The FitMate-ProTM system was calibrated prior to each individual test according to the manufacturer's guidelines.
The visual detection method was employed for anaerobic threshold (AT) determination at treadmill exercise testing. The visual analysis was performed by two observers with proven experience. The criterion for AT quantification was VE curve rising at an increasing rate relative to the increase in VO2 on the ergospirometer monitor18. The AT value was considered as the mean of the data obtained from the analysis by two observers.
Statistical analysis
Data were expressed as the mean ± standard deviation (Mean ± SD). A two-way ANOVA was used to assess differences in HRV, VO2, VE, and respiratory rates between the PES and CONTROL conditions. Bonferroni's post hoc were used to partition significant main effects. A Student's t-test was used to assess differences within conditions (rest vs following maximal exercise testing). The anaerobic threshold in the PES and CONTROL conditions was analyzed by unpaired student's t-test. The significance level was set at p < 0.05. All statistical analyses were performed using Graphpad Prism, version 5.0 (Graphpad Software Inc., San Diego, USA).
Results
Within conditions (e.g. PES and CONTROL), the RR interval, rMSSD, SDNN, NN50, pNN50, LF power, HF power, LF/HF index, total power, VO2, VE, and respiratory rates increased significantly from pre-exercise values. Between conditions, figure 1A shows the time course of rMSSD during the post exercise recovery. The rMSSD was significantly faster for the CONTROL versus the PES condition during the 5 min following exercise testing. However, at pre-exercise no significant difference in the rMSSD was detected in between conditions (CONTROL = 52.07 ± 26.05 ms2; PES = 51.82 ± 26.37 ms2). Additionally, the mean values of the RR interval were not significantly different at pre-exercise between the CONTROL (1002 ± 82.78 ms) and PES (989.8 ± 85.94 ms) conditions, respectively (fig. 1B). However, the RR interval was significantly lower (p < 0.01) following maximal exercise testing in the PES (367.9 ± 10.20 ms) versus the CONTROL (433.2 ± 29.32 ms) condition (fig. 1B). The others variables of time-domain of the HRV (SDNN, NN50, pNN50) were not significantly different between conditions.
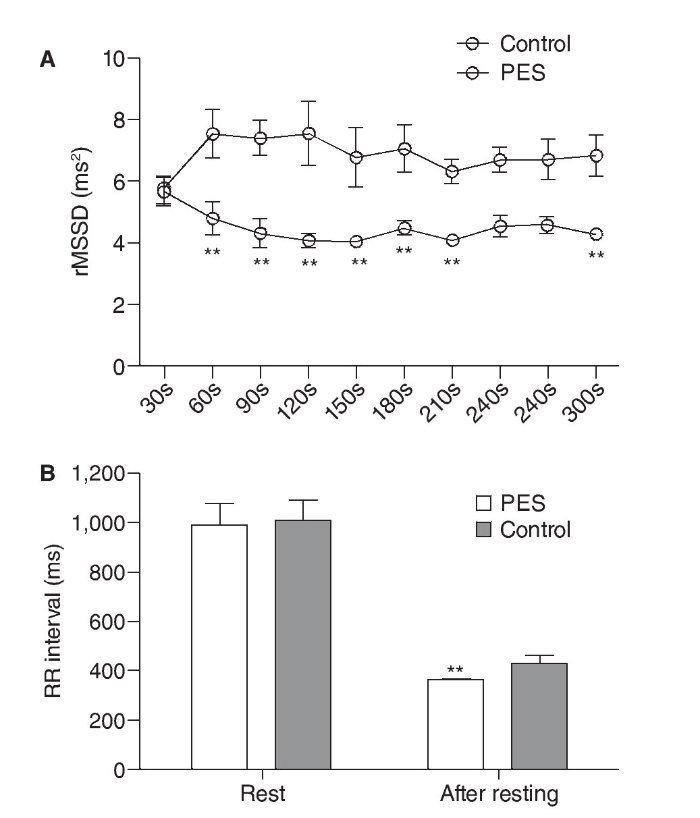
Fig. 1. A. Time-domain of HRV data for 5-min following maximal exercise testing. B. Comparison RR interval at rest and following exercise testing between conditions. Data are presented as mean ± mean of the mean squared differences of successive RR intervals. CONTROL: no passive stretching prior to exercise; PES: passive stretching prior to exercise. **p < 0.01 when compared to CONTROL.
Figure 2 shows the LF/HF index, LF, HF, and total power for the CONTROL and PSE conditions at rest and following maximal exercise testing. Significantly lower LF power (PES = 3.20 ± 1.14 ms2; CONTROL= 24.65 ± 7.57 ms2; p < 0.001) and total power (PES = 23.57 ± 7.41 ms2; CONTROL = 195.90 ± 46.37 ms2; p < 0.001) responses were visually detected for the PSE versus CONTROL condition following exercise testing (fig. 2 B and D). In contrast, the HF power and LF/HF index were not significantly different between the PES versus CONTROL condition at rest and following exercise testing (fig. 2 A and C).

Fig. 2. Frequency-domain of HRV at rest and following maximal exercise testing. Data are presented as mean ± SD. A: Index Low frequency power/High Frequency power (LF/HF); B: Low frequency power (LF); C :High Frequency power (HF);D : Total power. LF: low frequency spectral power; HF: high frequency spectral power; LF/HF: the ratio of low to high frequency spectral power. CONTROL: no passive stretching prior to exercise; PES: passive stretching prior to exercise. ** p < 0.001 when compared to CONTROL.
There were no significant differences between the PSE and CONTROL conditions for any of the other cardiopulmonary variables assessed (figs. 3 A, B, and C). Figure 3 summarizes VO2 max (PES = 55.37 ± 3.54 ml/ kg/min-1; CONTROL= 57.70 ± 3.94 ml/kg/min-1), VE max (PES = 126.9 ± 19.85 L/ min-1; CONTROL = 136.3 ± 19.60 L/ min-1), and respiratory rates (RR) maximum (PES = 49.08 ± 8.45 Breaths/ min-1; CONTROL= 49.30 ± 8.84 Breaths/ min-1). However, during PES condition (25.7 ± 1.1 ml/kg/ min-1) was observed decrease of the anaerobic threshold (p<0.05) when compared to CONTROL conditions (28.8 ± 0.8 ml/kg/min-1).
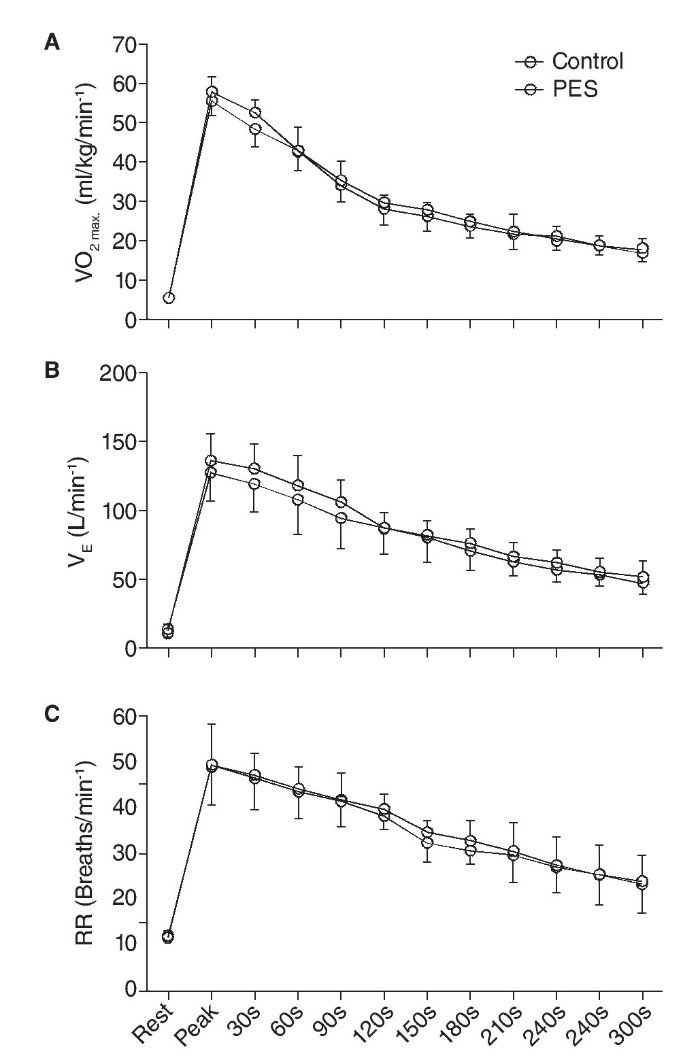
Fig. 3. Mean respired gas analysis at rest, during, and for 5 min. following maximal exercise testing. Data are presented as mean ± SD. A,B,C : maximum oxygen consumption, minute ventilation, respiratory rates, respectively five minutes post effort. VO2max.: maximum oxygen consumption; VE: minute ventilation; RR: respiratory rates; CONTROL: no passive stretching prior to exercise; PES: passive stretching prior to exercise.
Discussion
The purpose of the current study was to examine the effect of PES on the physiological responses to treadmill maximal exercise testing. The key finding was that VO2max, VE, and respiratory rates were not significantly different at rest, during, and following exercise testing irrespective of whether PES was performed. In agreement, some studies have demonstrated no significant increases in maximal oxygen consumption with PES19,20. In contrast, another study that utilized more extensive PES and proprioceptive neuromuscular facilitation stretching only for the lower body muscle groups (7 exercises; 3 repetitions each for 30 sec) demonstrated an increase in VO2max14. Therefore, it appears that differences in the intensity, repetitions, and duration of stretching determine the effect on VO2 max during maximal exercise testing.
The concept of anaerobic threshold (AT) has been associated at a given work rate which an oxygen supply to the muscle does not meet the oxygen requirements and increases the dependence on anaerobic glycolysis for energy output18. With compensatory factor happen an increase in VE for eliminate the excess CO2 produced, consequently promote an elevation of VO2. In ours study, the AT was faster in PES when compared to no stretching condition. This response can be associated to sensibility of the group IV muscle afferents by changes in skeletal muscle metabolism, such as increase of lactic acid, promoted with stretching exercise12.
Limited studies have examined the profile of HRV with maximal treadmill exercise testing and pre-exercise static stretching. However, some studies commented that assessment of autonomic outflows has revealed that passive muscle stretch increases cardiac sympathetic nerve activities and decreases cardiac parasympathetic nerve activity10. Hence, the decrease in the RR interval following maximal exercise testing with PES may reflect alterations in parasympathetic activity. In the present study, the rMSSD was significantly faster for the CONTROL versus PES condition (fig. 4) during the 5 min following exercise testing. The rMSSD has better statistical properties for assessment of parasympathetic activity, uncontaminated by sympathetically mediated heart rate variability4,21. This way, the rMSSD during the first 5-min of recovery, measured over successive 30-sec segments following exercise has been used as an index of parasympathetic activity22. The results of the current study suggest that PES promotes a delay in parasympathetic reactivation following exercise testing22,23. These results might be accounted for the stretch-induced decreases in the sensitivity of muscle spindles and the associated decreases in musculotendinous stiffness that may inhibit parasympathetic vagal outflow, whereas occur the adjustment of cardiac function via reflex sympathetic autonomic activity10. Thus, the vagal activity decrease seems to be dependent of the muscle length and tension in response to successive static muscle contractions, but irrespective of arterial baroreceptor input24.
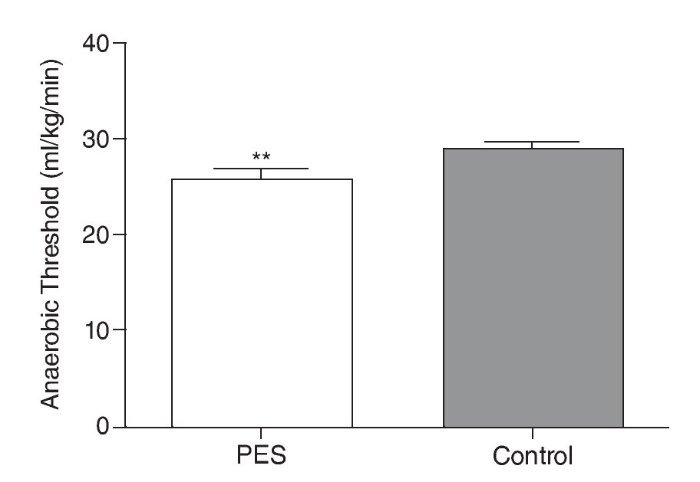
Fig. 4. Profile of the anaerobic threshold between PES e CONTROL conditions. Data are presented as mean ± SD. ** p<0.05
The LF power is induced by both sympathetic and vagal cardiovascular control4, but some studies suggest that sympathetic spectral power is 15% greater than vagal spectral power25,26. Additionally, this frequency-domain variable seems to be quite stable, around 0.1 Hz, and its change may be related to specific modifications in sympathovagal balance4. Total power consists in the sum of frequency bands ranging from 0 to 0.5 Hz and has also been found to indicate mainly vagal activity fluctuations at rest4,25. In the current study, significantly lower LF power and total power responses were visually detected for the PSE versus CONTROL condition following exercise testing. In relation to LF power, some authors consider that changes of frequency band can be a consequence of alterations of the vagal-cardiac activity causing fluctuations in the LF band and/or indirectly by changes of baroreflex sensitivity26. However, in present study, it seems that the decrease of LF power in PES following maximal exercise testing corroborated with the TP response, mainly with overall changes in the autonomic modulation rather than changes in the vagal modulation4,25,27,28. Our study is limited by the small sample size and gender, so further research should be extended to a larger population and both genders.
In conclusion, the results of the current study suggest that PES promotes dysfunction in the tonic cardiac autonomic regulation as evidenced by delayed parasympathetic reactivation, during the initial 5 minutes of recovery following maximal exercise testing. However, the PES protocol utilized in the current study (i.e. 3 stretches upper body, 3 stretches lower body, 3 repetitions each for 30 sec) does not promote significant changes in the maximum oxygen consumption. The delayed reactivation of the parasympathetic nervous system should be examined in future research to determine potential positive or negative implications following maximal exercise testing.
Conflict of interest
The authors declare that they have no conflict of interest.
History of the article:
Received: June 8, 2012 Accepted: September 10, 2012
Correspondence:
A. Souto Maior.
Department of Exercise Physiology. Universidade Castelo Branco
Avenida Santa Cruz, 1631
- Realengo - Rio de Janeiro/RJ - Brasil.
E-mail:alex.bioengenharia@gmail.com
