


In this paper, we analyze the relevance of innovation concerning the emergence of important changes in the society. In order to verify which are the most relevant factors when it comes to the allocation of countries in an innovation ranking (Global Innovation Index), we accomplished a quantitative study, in which the procedure of multiple linear regression was used. The sample of our study comprised 33 countries and the analysis of the theoretical framework was carried out conducive to the creation of six independent variables. As a result, the variables “GDP per capita”, “Public expenditures on R&D”, “Exports of high-tech goods”, “Public expenditures on education”, “Number of large companies” and “Number of patents” are in descending order the ones most related to the innovation level reached by some countries. The only variable negatively correlated to innovation is the number of patents registered in a determined country; in other words, one may conclude that patents are not the most relevant indicator linked with the development of innovation. We also emphasize the role played by the government when providing a favorable institutional environment in order to encourage and support innovation.
When analyzing the historical events that took place in past centuries, one can notice that the revolutions that occurred in humanity were predominantly followed – or preceded – by changes and, consequently, by improvements in the way to manufacture new products, to process activities and to administrate them. These changes arose, therefore, due to technological advances, whose emergence caused transformations capable of changing the livelihoods of the population, who started not only to adapt to the new technological paradigm, but also to demand for new products and services that could provide improvements in the life quality.
It is not hard to mention examples related to such technological changes. When thinking about, for instance, the emergence of telephony and electricity and the revolution regarding mass production, one can deduce that such events were responsible for the social and economic transformations that marked the society in several moments – from the discovery of penicillin as a powerful antibiotic in the beginning of the last century to the technology used in war artilleries during the two world wars.
It is known, however, that the discoveries made by isolated inventors, e.g. Graham Bell in telephony and the Wright Brothers in aviation, do not happen presently in the same way. Due to the complexity that technology has reached over the past years, innovative projects start being developed and structured by specific teams focused on the development of new products, services and business models. The appreciation attached to the figure of the inventor no longer exists in the current society – there are no strong evidences of inventors that, alone, create technologies that lead to breakthrough innovations.
In the same way that inventors were subject to innovative ideas in the past that became the starting point for original discoveries, current innovators are subject to (and/or aligned with) companies, which have the capacity to supply all the necessary facilities to stimulate the development of innovation. Such facilities involve the provision of proper infrastructure, research laboratories and development centers, while providing the necessary financial support, which is indispensable to finance the development of projects.
There are certainly internal factors within a company that may facilitate or hinder the emergence of innovation. A culture for innovation, for example, is considered nowadays an essential factor to foster innovation in companies – without such culture of innovation and technology development, a company may turn into a business that only imitates technologies developed by its competitors; that way, it tends to remain in the market only to survive, not to compete and prosper. As mentioned earlier, the establishment of a proper infrastructure and management to spread technology is the key factor to develop innovation within a company.
It is, however, common to forget that there are external factors that can also boost and/or hinder the emergence of innovation. Such factors can be attributed to specific institutional characteristics of the countries in which innovative companies originate from. These characteristics can be identified by incentives for innovation (e.g. tax incentives) and also by public expenditures on Research & Development (R&D), which is an aspect strongly related to innovation.
We intend to, therefore, point out in this study, based on comparative observations, the main differences there are between Brazil, not a very innovative country according to international rankings that allocate nations according to the different levels of innovation, and other countries. Through the selection of variables related to innovation, we intend to demonstrate herein which are the factors that influence innovation more significantly and which of them demand for more investments in order to boost technology and innovation.
Research issue and objectivesAs mentioned earlier, several authors (Davila, Epstein, & Shelton, 2007; Dyer, Gregersen, & Christensen, 2012; Kelley & Littman, 2007; Maital & Seshadri, 2013; Midgley, 2009), when exploring the universe designed by and for innovation, tend to emphasize internal issues – within the company – related to innovation, neglecting many times the strong external influence, which seems to be at times more relevant than internal issues. We believe, therefore, that external factors related to national policies, economic development and incentive to innovation deserve some attention. That way, we will not deal with issues regarding companies, nor within companies, because we consider that external issues can be the main drivers for the development of innovation in countries.
When talking only about Brazil, it is possible to find information that justify the delay (and/or the lack) of innovation. There is in the country no effective industrial policy that boosts the development of national technologies. In fact, import substitution policies implemented during the military regime were not as successful as the ones in East Asian countries. In Brazil, there was no policy preserving the development of proper human resources to continue the technological and scientific progress. Besides, the end of the market reserve did not provide a proper time period so that Brazilian entrepreneurs could adapt to the new market conditions.
When analyzing indexes provided by the World Bank1 and OECD,2 one realizes that Brazil is in a worse position than other developed countries when analyzing data related to the number of patents and scientific publication and the number of students graduated in sciences, technology and engineering. We discuss, however, the relevance of such aspects for the development of innovation, as well as the most relevant ones to predict the level of innovation of countries.
The Brazilian technological delay does not seem to be isolated in Latin America; the delay of Latin American countries occurs due to geographic and microeconomic aspects (Feldmann, 2009). It is important to emphasize the need to make comparisons between countries to evaluate the performance regarding innovation; when compared to other Latin American countries, Brazil has a superior performance in terms of public expenditures on R&D.3 The country invests 1.16% of its GDP in activities related to research and development; Argentine invests 0.62%; Mexico, 0.46%, Chile, 0.42%; and Uruguay, 0.40%. Not by chance, in the ranking published by the Financial Times,4 from the 500 largest companies in the world, only three Latin American countries are represented: Brazil, Chile and Mexico. When comparing Brazil and the United States, for example, the investment of the USA in R&D is 41.9% larger than the investments in Brazil.
Some findings justify the delay of Latin America in technological and innovation areas that go beyond the investment of GDP on R&D. The companies of these countries are not very active in high-tech sectors, the governments do not foster a proper institutional environment for the emergence of innovation and there is still a predominance of imported technologies, which limits the articulation between scientific and technology activities in Latin American regions. Another circumstance that justifies the delay and underdevelopment of technology is the abundance of natural resources aligned with cheap workforce (Feldmann, 2009). The focus on natural resources becomes very clear when analyzing the most internationalized Brazilian companies; from the ten largest multinationals, four of them are directly related to the exploitation of natural resources (FDC, 2013).5
It is also important to mention the absence of effective support to small- and medium-sized Brazilian companies; regular expenditures on R&D are feasible only in large companies due to the lack of government incentives directed to smaller companies (Prochnik & Araújo, 2005). Even though there is one specific legislation in Brazil that aims to promote tax incentives to innovative companies (Law 11.196/05), such incentives only approach joint-stock companies – in other words, large companies that are usually subsidiaries of large multinational corporations. Such law also presents a certain contradiction regarding the normative ruling that forbids the outsourcing of R&D activities. It means that, in order to get tax incentives, the company has to develop the whole innovation process within its facilities – the paradox is that innovation demands interaction with other companies, laboratories, universities, and so on (Moreira Filho, 2015).
One can conclude, based on the information presented in this section, that the main objective of this research is to demonstrate, by means of a quantitative study, the factors (variables) that are the most relevant ones regarding the development of innovation in countries, especially in Brazil. With the results, it will be possible to analyze and discuss the factors that should be getting more investments and attention in order to boost innovation in Brazil.
Theoretical frameworkThere are several definitions regarding the implications restrained in the term “innovation”. Since the aim of this paper is not to discuss the different definitions there, we consider innovation the practical refining and the development of an original invention to a technique or usable product, or as a process in which creativity is applied in all processes of the value chain in order to develop new and better ways to create value for costumers (Maital & Seshadri, 2013). It is important to remember that classic competitive advantages, such as low salaries and abundant natural resources, are no longer the most relevant ones toward global competition, which affects the economy by consolidating technological advances and innovation (Feldmann, 2015).
It is possible to relate several factors to the development of innovation in a certain country. In the Brazilian case, for instance, one may mention the lack of qualified workforce, a low register of patents and a low educational level (Feldmann, 2015). There are, however, other authors considering different variables as the most relevant ones regarding the emergence of innovation, who use different methodologies to justify the technological development. In this study, however, we selected some authors that point out variables related to the development of innovation whose measurement could be accomplished by using secondary data. The variables that will be analyzed in this study are: (i) number of large companies, (ii) GDP per capita, (iii) public expenditures on education, (iv) public expenditures on R&D, (v) performance of students evaluated by PISA, (vi) exports of high-tech products, (vii) number of patents and (viii) number of graduated students in science and technology.
Innovation and large companiesAccording to statements approached in the previous section, large companies are the ones that innovate the most, not due to a superior efficiency of human resources, but due to the availability of financial resources and the possibility to take risks without going bankrupt.
Porter and Stern (2002) emphasize that a proper indicator used to verify the performance of the innovative ability of a country is the analysis of business clusters. The authors assert that companies need to be grouped in clusters, since the intercompany cooperation influences the emergence of technology and innovation.
Botelho, Maia, and Pires (2012) point out the relevance of small companies in innovative activities – and still support the assumption that small companies tend to invest more in innovation (proportionally) than large companies. They do not neglect, however, the fact that the innovation rate tends to increase according to the size of companies. Stiglitz (2003) remembers that banks hardly finance R&D projects of small and/or new companies.
Data related to the number of business clusters could not be collected in this research. Therefore, we chose to use data provided by the Financial Times when classifying and identifying the 500 largest companies in the world. This ranking identified companies derived from 33 countries. Ten companies represent Brazil: Ambev, Petrobras, Vale, Itaú Unibanco, Bradesco, Banco do Brasil, Itausa, Telef Brasil, Santander Brasil and Souza Cruz. These companies demonstrate the strength of the Brazilian banking sector and its importance in the world economy.
Innovation and GDP per capitaWhen elaborating this study, we analyzed some scientific papers that affirmed the existence of a relationship between innovation and GDP per capita. In an interview conducted with the director of Sebrae6, a Brazilian support service for micro- and small-sized companies, it was possible to perceive a strong relationship between increases in the GDP and the consequent increase of innovation in micro- and small-sized companies. Stiglitz (2003) emphasizes the strong connection between technology and GDP when affirming that for all economic growth processes the technological progress is crucial – that way, every change in today's living standards occurs due to technology.
The relationship between innovation and GDP per capita can be noticed in different ways. The analysis of the most innovative countries, expressed by the Global Innovation Index, elaborated by the Cornell University, INSEAD and the World Intellectual Property Organization (WIPO), points out that the countries that are on the top of the list are also the ones that present the highest GDP per capita in the world (Switzerland, Sweden, United Kingdom, the Netherlands, the United States, Finland, Hong Kong, Singapore, Denmark and Ireland). Based on the assumption that the higher and the more developed the economy of a country, more capital the country shall have to invest in innovation, we considered that the relationship between GDP per capita and innovation is valid; this is the reason why this relationship will be explored in the quantitative analysis.
Innovation and public expenditures on educationThe relationship between innovation and technology and public expenditures on education was explored by some authors, but it is important to emphasize the relevance of this theme. Porter and Stern (2002) and Feldmann (2009) emphasize the relevance of such an issue when emphasizing the need to invest in the educational system, since this is one of the former stages of skilled human resources.
It is possible to identify a coherence in the assumption made by these authors; once that there are no public investments in the educational system, especially in elementary stages, it is possible to infer that such a system shall not be satisfactory for students, which carries out the emergence of not skilled professionals for the work market and, therefore, for activities related to science and technology. It is important to remember herein that the variable approached in this section measures only public expenditures on education, not taking into consideration countries in which the educational investment is made by private institutions. In Brazil, around two-thirds of all enrollments in higher education belong to private schools (Durham & Sampaio, 1995). That way, countries in which education is subsidized by the government may present a different performance when compared to countries in which private institutions play the most important role.
Innovation and public expenditures on R&DTechnology is essential to measure innovation, but it is usually very hard to measure it, specially taking into account the development level of countries. Therefore, it is common to adopt the percentage of expenditures on R&D of the GDP as one of the methods to identify how much a country is willing to invest in innovation. Porter and Stern (2002) point out that the investments and political decisions of a country are responsible for the creation of an environment for innovation.
The strong competition among companies carries out the development of new products, and also new ways to manufacture existing products – this is the reason why it is necessary that there are more and more investments in research and development, especially in industries in which technological changes are very relevant for their survival (e.g. computer science and pharmaceutical industries). Such innovative activities can be encouraged by the government, especially when it comes to supporting basic research (Stiglitz, 2003).
Innovation and PISA performanceThe economist Paul Romer, when interviewed in 2012 by a Brazilian magazine, affirmed that there is a strong relationship between the performance of students participating in the PISA exam, which is applied by the OECD, and the economic development of countries. According to him, education has the primary responsibility for the high rates of the development of countries. In other words, due to the performance achieved by students evaluated by PISA, it is possible to predict the level of development of the countries they live in. That way, considering that technological innovation and knowledge are relevant for every economy, governments can and should stimulate growth in a more efficient way by investing in education (Feldmann, 2015).
Since this study aims to approach issues related to innovation, we intend to verify if there is a relationship between the performance of students in the areas of science and mathematics and innovation. Since we hope there is a positive relationship between innovation and GDP per capita, we consider PISA as a pertinent variable for the study, despite the exploratory experience.
Innovation and exports of high-tech productsThere are studies that relate directly to innovation and exports of high-tech products. This is the reason why we considered this relationship relevant to be explored in this research.
Porter and Stern (2002) affirm that the capacity of national innovation is the potential of a country (as a political and economic entity) to generate commercially relevant innovation. That being the case, it is possible to infer that the need to trade products is an activity directly related to the economic development of a country. Brazil, for example, can be considered an exporter of commodities since it is a producer of primary goods (low added value goods), which allows the country to export the surplus production for other countries. Therefore, the country that innovates and produces high added value products tends to trade such manufactured products to other countries, which strengthens the national economy while pushing the development of innovation. One can believe, therefore, that this can be a relevant indicator to evaluate the performance of a country regarding innovation.
Innovation and number of patentsThe analysis of the number of patents is controversial in the academia. One of the reasons is that a patent does not always indicate something scientific and technologically relevant; the other reason is that patents concede their creators the exclusive right to the discovery, but for a limited period of time (Stiglitz, 2003). That way, many inventors choose not to patent their discoveries in order to preserve them from copies and mimicry after the protection period is over.
Despite the criticisms, the number of patents registered by countries is still one of the most used indicators to evaluate the development of innovation in determined locations. It is important to mention that the patent itself is not capable to measure innovation; the patent provides subsidies to analyze the internal and external institutional environments that antecede its own emergence.
Innovation and number of engineersPorter and Stern (2002) affirm that one of the ways to measure the level of innovation of a country is to analyze the number of engineers per 10,000 inhabitants.
Such an indicator could not be used in this study, since there is no international ranking providing the information about the countries analyzed herein. We could only find isolated information about the subject, which were not used in this study because they were controversial or incomplete. That way, we chose another indicator provided by UNDP, which analyzes similarly the number of graduate students in science, technology and engineering.
MethodologyThis study can be considered predominantly quantitative and descriptive, since we are going to use measurable data to test the validity of certain variables and because this study intends to describe a research problem based on indicators obtained from other studies. We do not reject, however, its qualitative and exploratory characteristics, since we also intend to report observations in order to better comprehend them; the exploratory characteristic is due to the accomplishment and analysis of correlations still little explored in the specific case.
We will use the procedure of multiple linear regression to analyze the relationship between the innovation index and other variables that may influence the allocation of countries in the index. It is important to point out that all variables have been previously standardized, considering that they were in different measurement scales.
The universe of the research corresponds to 142 countries ranked by the Global Innovation Index. The sample, however, corresponds to 33 countries, since the other indicators used herein did not encompass the 142 countries analyzed by the Global Innovation Index. The number 33 is the number of countries identified by the Financial Times when selecting the 500 largest companies in the world and, consequently, their country of origin. The multiple linear regression procedure is applicable in this study, since the number of observations is higher than 30 (Hair et al., 2006).
The dependent variable, entitled herein as innovation index, was chosen because it represents a list elaborated by the Cornell University, INSEAD and WIPO, worldwide known institutions due to their researches related to innovation, which considers more than 80 indicators when dealing with innovation. In this list, scores have been attributed to countries: the higher the score, the better the position in the ranking, in other words, the higher the grade, the more innovative the country.
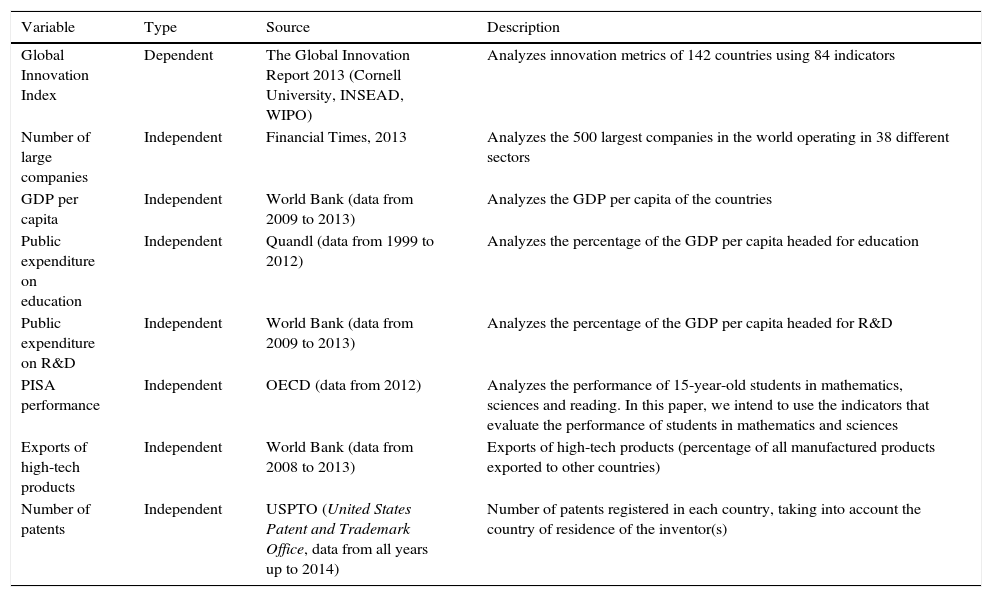
The dependent variables have been obtained by other institutions, given the difficulty to find one only institution that provides all the necessary indicators to elaborate this study (see Table 1 for more detailed information). We also tried to include one variable that could measure the financial environment of the countries; since this indicator – provided by the World Bank – did not contemplate the 33 countries of the sample, this variable had to be ignored. The same happened with the number of graduate students in sciences and technology; the UNDP provides the number of graduates in several countries, but since more than five countries of the sample were not included in the ranking, we had to ignore this variable. The variable selected to evaluate the performance of students in mathematics and sciences (PISA) was also ignored, since it did not include South Africa, Saudi Arabia and India.
Variables.
| Variable | Type | Source | Description |
|---|---|---|---|
| Global Innovation Index | Dependent | The Global Innovation Report 2013 (Cornell University, INSEAD, WIPO) | Analyzes innovation metrics of 142 countries using 84 indicators |
| Number of large companies | Independent | Financial Times, 2013 | Analyzes the 500 largest companies in the world operating in 38 different sectors |
| GDP per capita | Independent | World Bank (data from 2009 to 2013) | Analyzes the GDP per capita of the countries |
| Public expenditure on education | Independent | Quandl (data from 1999 to 2012) | Analyzes the percentage of the GDP per capita headed for education |
| Public expenditure on R&D | Independent | World Bank (data from 2009 to 2013) | Analyzes the percentage of the GDP per capita headed for R&D |
| PISA performance | Independent | OECD (data from 2012) | Analyzes the performance of 15-year-old students in mathematics, sciences and reading. In this paper, we intend to use the indicators that evaluate the performance of students in mathematics and sciences |
| Exports of high-tech products | Independent | World Bank (data from 2008 to 2013) | Exports of high-tech products (percentage of all manufactured products exported to other countries) |
| Number of patents | Independent | USPTO (United States Patent and Trademark Office, data from all years up to 2014) | Number of patents registered in each country, taking into account the country of residence of the inventor(s) |
It is important to point out that the innovation index provided by the Global Innovation Report already measures most of the independent variables studied herein; the search for indicators provided by other institutions, however, avoids biases in the study. That way, we intend to demonstrate that there is a correlation between the dependent variable and the independent ones, even when obtained from different sources.
Another aspect that deserves attention before presenting the analysis of the results refers to the insertion of China in the study. Due to political, economic and social differences, the Chinese territory can be divided into four distinctive parts: China, Hong Kong, Macau and Taiwan. Some research institutions, on the other hand, only divide it into China and Hong Kong; others make no division at all and handle the whole territory only as China. In this study, we only considered China in the analysis; we did not include Hong Kong, Macau or Taiwan separately, because some indexes are not clear regarding this segregation. We recognize this limitation of the study and suggest the inclusion of all Chinese territories in further researches.
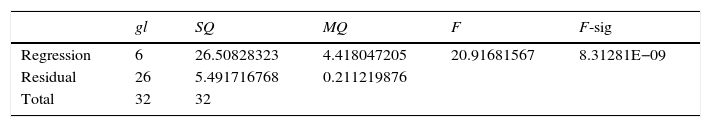
ResultsOne of the most relevant premises of the multiple linear regression refers to the linearity of the independent variables. For such, it is desirable that the F-significance is lower than 0.10 corresponding to a significance level of 90%. In this study, the F-significance value was 8.31281E−09, which indicates a linear relationship between the dependent and the independent variables (Scatter Plot 1)

Since the F-significance was satisfactory in our analysis, we will proceed the study by demonstrating the regression statistics that we obtained in this research (Table 2).
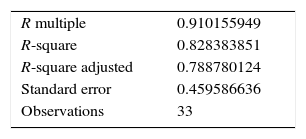
The linear correlation coefficient (R multiple=0.91) is above 0.7, which indicates a strong linear correlation among the variables, which is expected in multiple regression models. The coefficient of determination, represented by R-square, indicates that almost 83% of the variability of the innovation index can be explained by the variability of the independent variables. The explanation power of the model, represented by R-square adjusted, was approximately 79%, which can be considered satisfactory (Table 3).
Another indication that there is a linear correlation among the variables is the descriptive level (P-value). We considered herein, due to the size of the sample, a level of trust of 90%. The P-value of the intersection is higher than 0.10 (which is expected when the level of trust is 90%), and the P-value of the independent variables is smaller than 0.10 (which is also expected). The only variable that presents a P-value discretely above 0.10 refers to the number of patents (P-value=0.108). This variable will be kept in the study, since its P-value is very close to what is normally expected. It is, however, important to emphasize that this variable is the one that less explains the innovation level of the countries of our sample. Besides, this variable is the only one negatively correlated to the dependent variable, which means that the higher the level of innovation of a country, the smaller the number of patented innovations (Table 4).
P-value analysis.
| Coefficients | Standard error | Stat t | P-value | |
|---|---|---|---|---|
| Intersection | −1.43691E−15 | 0.080003764 | −1,79605E−14 | 1 |
| Number of large companies | 0.701278226 | 0.353918739 | 1.981466788 | 0.058205766 |
| GDP per capita | 0.362230174 | 0.100998807 | 3.586479726 | 0.001360785 |
| Public expenditure on education | 0.222653545 | 0.087510002 | 2.544321117 | 0.017232291 |
| Public expenditure on R&D | 0.381289318 | 0.106759762 | 3.571470279 | 0.001413958 |
| Exports of high-tech products | 0.267607967 | 0.085807449 | 3.118703229 | 0.004403577 |
| Number of patents | −0.588976101 | 0.354037288 | −1.663599066 | 0.108201529 |
By the scores indicated by the P-value, it is possible to establish a raking of the most correlated variables with the level of innovation of the countries. Therefore, the descending ranking of the variables is as follows: GDP per capita, public expenditure on R&D, exports of high-tech products, public expenditure on education, number of large companies and number of patents.
Based on the information explored in the theoretical framework, it is possible to comprehend the results obtained by the linear multiple regression. GDP per capita, as well as public expenditure on R&D, indicate that the more economically developed a country, the greater the willingness to invest in R&D, which increases the innovative potential of a country.
The exports of high-tech goods follow the same logical principle: the more innovative, the larger the production of high-tech products, which will be exported to countries that demand for such products in determined sectors. The public expenditure on education ranks fourth is our analysis. Such observation can be associated with the fact that many countries – especially developing ones – have unsatisfactory public educational systems and, therefore, private institutions end up playing an important role to provide students with proper education.
The number of large companies influences the development of innovation in the countries of the sample as expected, but it is important to emphasize the outcomes of the study accomplished by Porter and Stern (2002) regarding innovation and countries: business clusters are responsible for the development and emergence of innovation – not large companies isolated. It is possible to observe nowadays an expressive number of large companies that innovate, but, according to what the authors propose, they all were – or still are – inserted in clusters, in which innovation occurs in the early stages.
The number of patents is the variable less related with innovation and negatively correlated to it, which is the opposite of what is usually brought up when analyzing the innovation level of a country. One possible explanation can be that many innovations are not patented; in the patenting process, it is necessary to reveal certain descriptions, which can put in risk the competitiveness of an industry once the patent protection expires.
It is possible to accomplish herein a descriptive analysis of the data obtained to compare Brazil and the other countries of the sample. The innovation index, whose largest score was achieved by Switzerland (66.59), indicates that Brazil has approximately 50% of the score obtained by the most innovative country (36.33), being ahead of India (by a difference of only 0.16), Indonesia and Turkey. Regarding large companies, Brazil is a little below the average, being represented by 10 companies; in Latin America, Brazil is well represented, since Chile has only one company and Mexico, five (Table 5).
When analyzing this table, it is possible to notice a strong divergence regarding the number of patents. According to the assumption that this variable is negatively correlated to innovation, we will not deepen this analysis in this research.
The public expenditure on education in Brazil is above the average of the countries analyzed in the study; the country is 14.8% above the average, which can be considered satisfactory. The variable that presents the worst performance is GDP per capita, which represents only 30.4% of the average of the countries of the sample; in other words, the Brazilian GDP per capita is 69.6% smaller than the average of these countries. Regarding the other variables, the difference is very similar; regarding large companies, the number of Brazilian companies corresponds to 68.9% of the average of the countries (31.1% smaller than the average); regarding public expenditure on R&D, it is 68.4% (31.6% smaller than the average); and, finally, regarding the exports of high-tech products, it is 67.7% (32.3% smaller than the average).
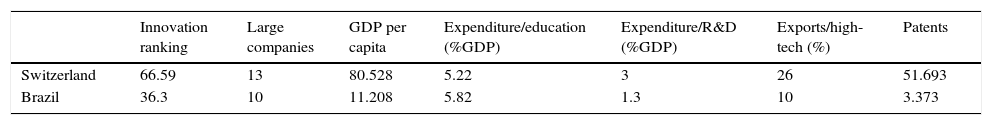
When analyzing the former table, it is possible to realize that Brazil's performance is not unfavorable, since there are countries presenting an inferior performance. When comparing Brazil and Switzerland, which is the most innovative country according to the global ranking, one can verify stronger differences (Table 6).
In this perspective, we realize that the most relevant factors that influence innovation are not public expenditures on education nor the number of large companies, whose results are similar in both countries, but GDP per capita, public investments in R&D and exports of high-tech products. Export of high-tech products is a relevant indicator to analyze how a country produces technology through innovation, which can be identified in products and services.
When analyzing Brazil taking into account the BRICs, the results are a bit different (Table 7).
The BRICS.
| Innovation ranking | Large companies | GDP per capita | Expenditure/education (%GDP) | Expenditure/R&D (%GDP) | Exports/high-tech (%) | Patents | |
|---|---|---|---|---|---|---|---|
| Brazil | 36.3 | 10 | 11.208 | 5.82 | 1.3 | 10 | 3.373 |
| Russia | 37.2 | 8 | 14.612 | 4.1 | 1.48 | 8 | 4.025 |
| India | 36.17 | 12 | 1.499 | 3.17 | 0.9 | 7 | 11.406 |
| China | 44.66 | 23 | 6.807 | 1.91 | 1.65 | 22 | 28.519 |
Even though Brazil has the second largest GDP per capita and despite being the largest investor in education, Brazil hast the second worst performance regarding innovation. The performance of Brazil, Russia and India is very similar; the only country that stands out is China, despite having the second worst GDP per capita and the smallest public investments in education. The fact that China is better positioned in the innovation ranking can be subject to other variables, which were not encompassed by this study. It is important to emphasize that the investments in R&D in China are superior to the investments in other countries, as well as the number of exports of high-tech products.
ConclusionIt is possible to conclude that there is a positive relationship between technological development and innovation, and, that way, it is possible to determine that great world revolutions had, directly or indirectly, some sort of relationship with innovation and technology. The emergence of the steam engine and informatics, for example, changed the way that companies and society functioned, marking the beginning of new economic ages and entrepreneurial and international competitiveness. Therefore, exploring this theme contributes to the existing literature on innovation, while enabling the comprehension of current aspects regarding this issue.
The importance of innovation for the welfare of countries is well known. When it comes to Brazil, more specifically, it is possible to mention the lack of public investments in issues that are relevant for innovation, the lack of commitment of companies in innovating, the bad integration between companies and universities and research centers, among others. To comprehend the most relevant factors regarding the development of innovation in a country, a quantitative study was accomplished herein by using the procedure of multiple linear regression, which analyzed some variables related to innovation based on assumptions presented in the theoretical framework. In order to measure innovation, we used the ranking presented by the Global Innovation Index provided by the Cornell University, INSEAD and WIPO, which presented data from 2013.
As a result of our analysis, we could present a descending ranking regarding the relevance of the variables associated with innovation: GDP per capita, public expenditure on R&D, exports of high-tech products, public expenditure on education, number of large companies and number of patents. According to the assumptions presented in the theoretical framework, some variables are in accordance with the theory; other ones indicate different outcomes.
The positive relationship between GDP per capita, public expenditure on R&D, exports of high-tech products, public expenditures on education and innovation is in accordance with the assumptions demonstrated in the theoretical framework. Therefore, a higher GDP per capita can indicate a higher willingness to invest in innovation – the exception is brought up by China. Such paradox can be related to the fact that, in this specific case, other variables are more related to innovation than GDP per capita. The results related to public expenditure on R&D are also in accordance with the theoretical framework; R&D is a relevant sector when one takes into consideration the development of innovation in a determined country and, therefore, innovative countries tend to invest more in R&D.
In the same way, the exports of high-tech products are also positively related with innovation; according to Porter and Stern (2002), if the innovative ability of a country is related to the production of commercially relevant innovative products, one can infer that the higher the ability to innovate, the more innovative the products will be. Consequently, a higher number of exports of high-tech products is expected. The public expenditure on education is also positively related with innovation, but to a lesser extent. Such fact relates to one of the limitations of this study, since such investments in education take into account only the public expenditures, neglecting the private sector that can play an important role in the education of a county, especially in Brazil.
The number of large companies is a relevant variable from the statistical point of view. It is possible to affirm that innovation occurs, usually, in large companies, but one cannot ignore the affirmations made by Porter and Stern (2002) when asserting that innovation occurs, frequently and initially, in clusters.
The only variable that showed a negative correlation with innovation relates to the number of patents registered in the countries of the sample. In contrast to the common sense, there is no positive relationship between innovation and patents, which can be explained by the fact that many innovations end up not being patented in order to preserve, for example, industrial secrets of certain products. Therefore, according to the quantitative analysis accomplished herein, the number of patents may not be the best indicator to measure innovation of a determined country.
As a result, one can relate the first four factors (GDP per capita, public expenditure on R&D, exports of high-tech products, and public expenditure on education) to the government. In other words, the government has, in these cases, the power to foster an economic environment that is proper to the development of innovation. The emergence of large companies is also relevant when it comes to innovation, since they are the ones hat have better financial resources to invest in innovation and technology – such reality can also be regulated by government institutions.
It is therefore possible to conclude that, in the Brazilian case, a broader government commitment is necessary to enhance the GDP per capita and, consequently, the public expenditures on R&D in order to increase the production of innovative and high-tech products. Such arrangement entails an increase in the number of exports of high-tech products. Such measures can strengthen the involvement and interactions between companies, research centers and universities, which are institutions positively related with innovation.
We suggest, for further studies, to reapply this analysis encompassing a larger number of countries, as well as a larger number of variables (including the ones that had to be ignored in this research)
Conflict of interestThe authors certify that they have no affiliations with or involvement in any organization or entity with any financial interest (such as honoraria; educational grants; participation in speakers’ bureaus; membership, employment, consultancies, stock ownership, or other equity interest; and expert testimony or patent-licensing arrangements), or non-financial interest (such as personal or professional relationships, affiliations, knowledge or beliefs) in the subject matter or materials discussed in this paper.
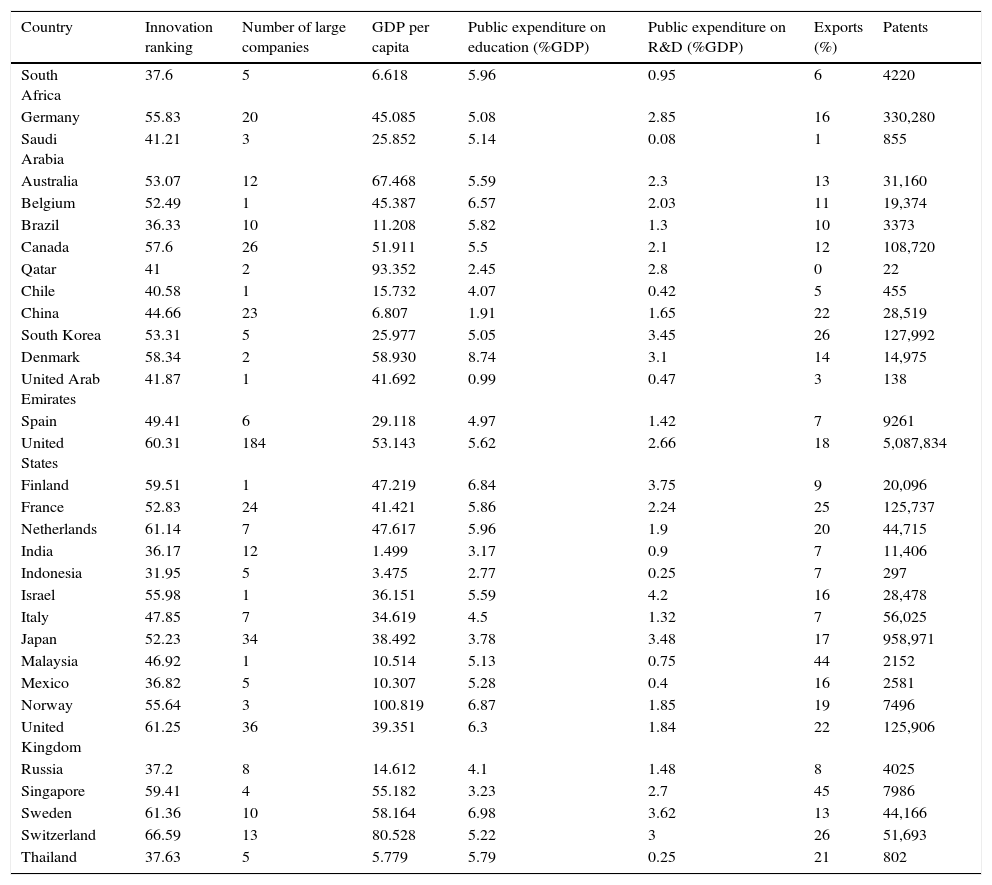
| Country | Innovation ranking | Number of large companies | GDP per capita | Public expenditure on education (%GDP) | Public expenditure on R&D (%GDP) | Exports (%) | Patents |
|---|---|---|---|---|---|---|---|
| South Africa | 37.6 | 5 | 6.618 | 5.96 | 0.95 | 6 | 4220 |
| Germany | 55.83 | 20 | 45.085 | 5.08 | 2.85 | 16 | 330,280 |
| Saudi Arabia | 41.21 | 3 | 25.852 | 5.14 | 0.08 | 1 | 855 |
| Australia | 53.07 | 12 | 67.468 | 5.59 | 2.3 | 13 | 31,160 |
| Belgium | 52.49 | 1 | 45.387 | 6.57 | 2.03 | 11 | 19,374 |
| Brazil | 36.33 | 10 | 11.208 | 5.82 | 1.3 | 10 | 3373 |
| Canada | 57.6 | 26 | 51.911 | 5.5 | 2.1 | 12 | 108,720 |
| Qatar | 41 | 2 | 93.352 | 2.45 | 2.8 | 0 | 22 |
| Chile | 40.58 | 1 | 15.732 | 4.07 | 0.42 | 5 | 455 |
| China | 44.66 | 23 | 6.807 | 1.91 | 1.65 | 22 | 28,519 |
| South Korea | 53.31 | 5 | 25.977 | 5.05 | 3.45 | 26 | 127,992 |
| Denmark | 58.34 | 2 | 58.930 | 8.74 | 3.1 | 14 | 14,975 |
| United Arab Emirates | 41.87 | 1 | 41.692 | 0.99 | 0.47 | 3 | 138 |
| Spain | 49.41 | 6 | 29.118 | 4.97 | 1.42 | 7 | 9261 |
| United States | 60.31 | 184 | 53.143 | 5.62 | 2.66 | 18 | 5,087,834 |
| Finland | 59.51 | 1 | 47.219 | 6.84 | 3.75 | 9 | 20,096 |
| France | 52.83 | 24 | 41.421 | 5.86 | 2.24 | 25 | 125,737 |
| Netherlands | 61.14 | 7 | 47.617 | 5.96 | 1.9 | 20 | 44,715 |
| India | 36.17 | 12 | 1.499 | 3.17 | 0.9 | 7 | 11,406 |
| Indonesia | 31.95 | 5 | 3.475 | 2.77 | 0.25 | 7 | 297 |
| Israel | 55.98 | 1 | 36.151 | 5.59 | 4.2 | 16 | 28,478 |
| Italy | 47.85 | 7 | 34.619 | 4.5 | 1.32 | 7 | 56,025 |
| Japan | 52.23 | 34 | 38.492 | 3.78 | 3.48 | 17 | 958,971 |
| Malaysia | 46.92 | 1 | 10.514 | 5.13 | 0.75 | 44 | 2152 |
| Mexico | 36.82 | 5 | 10.307 | 5.28 | 0.4 | 16 | 2581 |
| Norway | 55.64 | 3 | 100.819 | 6.87 | 1.85 | 19 | 7496 |
| United Kingdom | 61.25 | 36 | 39.351 | 6.3 | 1.84 | 22 | 125,906 |
| Russia | 37.2 | 8 | 14.612 | 4.1 | 1.48 | 8 | 4025 |
| Singapore | 59.41 | 4 | 55.182 | 3.23 | 2.7 | 45 | 7986 |
| Sweden | 61.36 | 10 | 58.164 | 6.98 | 3.62 | 13 | 44,166 |
| Switzerland | 66.59 | 13 | 80.528 | 5.22 | 3 | 26 | 51,693 |
| Thailand | 37.63 | 5 | 5.779 | 5.79 | 0.25 | 21 | 802 |
Peer Review under the responsibility of Departamento de Administração, Faculdade de Economia, Administração e Contabilidade da Universidade de São Paulo – FEA/USP.