


Assuming a fixed total R&D budget, the product pipeline management (PPM) problem has two parts: (1) Which and how many projects should be initiated? (2) Which projects should continue to be invested in or terminated? We use a dynamic model calibrated to a pharmaceutical company to study PPM, focusing on three types of heuristics — gradual increase or decrease, random-normal choice, and target-based search — to evaluate the impact of the introduction of innovation projects in the pipeline on the performance in R&D. We find that a gradual decrease of project introduction rates results in convergence, but the size of the adjustments and delays in the pipeline can limit the precision of the results. A random choice is detrimental to performance even when the average value is the optimal. A target-based search results in oscillation. The results of our analysis show that the specific problem of choosing the project introduction rate can be significantly improved by using an adequate rule of thumb or heuristic.
It is clear to most companies that “today's new products will decide tomorrow's company profile” as innovation is diffused (Bhushan, 2012, 2013). Previous studies in the innovation and product pipeline management (PPM) literature have examined factors that influence the various dimensions of R&D performance, such as quality, cost, lead time, and value created (Clark & Wheelwright, 1993; Cooper, Edgett, & Kleinschmidt, 1998; Griffin, 1997). However, much is still unknown about how managerial decisions affect performance in a dynamic setting and across the New Product Development (NPD) pipeline (Azar, 2012). Assuming a fixed total R&D budget, the PPM problem has two parts: (1) deciding on which projects to start, and (2) deciding which projects to continue and which to terminate at various stages of development, as well as and deciding how much to invest on each project at each phase and how to allocate people across the different stages of the process. The total amount of resources available for allocation across the stages is determined by a budgeting exercise (Chao, Kavadias, & Gaimon, 2009). In making these decisions, managers face a set of tradeoffs between the risks, returns, and time horizons for payoffs (Gino & Pisano, 2006). As was noted by Gino and Pisano (2005b):
“In theory, such tradeoffs are optimization problems that can be tackled with a technique such as dynamic programming. In reality, the sheer complexity, ambiguity, and uncertainty of most companies’ R&D portfolios make this an essentially impossible optimization problem to solve.”
These problems are not solvable, at least in a closed form — i.e., it is an NP-hard problem (Anderson & Morrice, 2006; Anderson, Morrice, & Lundeen, 2005; Browning & Yassine, 2008). A few studies have focused on behaviour (heuristics) in the scheduling of projects at a specific stage (Gino & Pisano, 2005a; Loch & Kavadias, 2002; Kavadias & Loch, 2004; Varma, Uzsoy, Pekny, & Blau, 2007; Yan & Wu, 2001). However, these studies did not focus on project introduction policies across the product development pipeline at the portfolio level. The various methods and tools most commonly used for management training are insufficient for dealing with the complexity of organizational processes such as product pipeline management. It seems clear that the system dynamics (SD) approach would allow the treatment of complexity in a more realistic way (Azar, 2012).
Some empirical studies have explored the patterns, best practices or benchmarks in the managerial decisions concerning PPM (Figueiredo & Loiola, 2012; Schmidt, Sarangee, & Montoya-weiss, 2009). The theoretic models proposed in the literature have not become a tool that is commonly used in management practice due to their highly complexity. Due to the complexity of portfolio selection and individuals’ bounded rationality (Simon, 1956), companies commonly utilize heuristics for managing their R&D portfolios rather than trying to optimize them. This decision-making behaviour is very well accepted but research on the impact of specific heuristics on R&D performance is still limited (Gino & Pisano, 2005b).
It is important to note that large companies, such as pharmaceutical and chemical companies, generate new patents regularly and have structured product development processes, as illustrated in Loiola and Mascarenhas (2013).
The existence of optimal levels in the product pipeline is not obvious because the problem cannot be solved in closed form — i.e., it is an NP-hard problem that requires severe simplifications in order to be solvable (Anderson & Morrice, 2006; Browning & Yassine, 2008). This is a clear indicator that a simulation study is particularly useful for the problem under scrutiny.
Rudi and Drake (2009) recognize that behavioural aspects in operational settings have received increasing attention, including areas such as the consumer estimation of household inventories (Chandon & Wansink, 2004), revenue management (Bearden, Murphy, & Rapoport, 2008), the bullwhip effect (Bloomfield, Gino, & Kulp, 2007; Croson & Donohue, 2006; Croson, Katok, Donohue, & Sterman, 2005), and the effect of social preferences (Loch & Wu, 2007) and service-level agreements (Katok, Thomas, & Davis, 2008) for the supply chain coordination. Many papers focus on portfolio management (managing one stage of a pipeline), but fewer papers focus on managing the pipeline as a whole. One exception is the study by Gino and Pisano (2005b), which generated resource allocation insights for product portfolio management. These insights adopted a behavioural viewpoint in terms of the heuristics for resource allocation at one stage of the pharmaceutical R&D process.
Organizations often commit to more product development projects than they can handle. The over-commitment of development resources (i.e., when too many projects are introduced into the pipeline) is a common phenomenon, as evidenced by case studies. The evidence suggests that many organizations have far more product development projects in progress than their capacity allows (Gino & Pisano, 2006). For instance, Wheelwright and Clark (1992) mentioned that organizations tend to pursue a larger number of projects than they have the resources to fund and suggested that companies often operate their development organizations at 200–300% capacity utilization. Ash (2009) finds that loading a resource pool to 300% or 400% of capacity while allowing preemption may be good for the engineering talent utilization rate; however, this procedure is detrimental for completing individual projects on their due dates. Ash, however, did not focus on the relationship between capacity utilization and the quality of the development activities.
For most firms that operate with high capacity utilization rates, the simplest form of heuristics would be to gradually decrease the project introduction rates (also referred to here as starts) from the high levels to lower levels, aiming to balance the pipeline and increase value creation.
Yu, Figueiredo, and De Souza Nascimento (2010) developed a simple, static model of the product development pipeline that establishes the upper limits for the capacity to develop and launch new product families. This ideal number of projects may function as a warning for firms that are trying to develop and launch too many product families. Figueiredo and Loiola (2012), Figueiredo and Loiola (2014a, 2014b, 2016), and Figueiredo, Travassos, and Loiola (2015) reached similar conclusions with a dynamic model that established a concave relationship between the number of projects started and the total value created in the pipeline. Based on another dynamic model, Repenning (2001) showed how a surge of resource demand can cause havoc in the NPD process in the phenomenon known as firefighting.
The traditional approach to the problem of over-commitment is to develop better models for project management and more sophisticated in-process management tools (such as real time scheduling) and to undertake more planning activities. Gino and Pisano (2006) suggest that these models would be more useful if they rest on cognitively and behaviorally compatible assumptions, i.e., incorporating elements into the models that will reduce common cognitive biases that people incur in their decision making processes.
In this paper, we use a dynamic simulation model adapted and modified from Figueiredo and Loiola (2012), Figueiredo and Loiola (2014a, 2014b, 2016), and Figueiredo et al. (2015) to explore such phenomena in the pharmaceutical industry, with a specific focus on the impact of project introduction heuristics on NPD performance. The use of heuristics is a way of searching for a better policy and/or making necessary adjustments whenever there are changes in the shape and performance of the pipeline. It important to point out that the working problem at hand is not actually solved by the use of heuristics. Heuristics are a tool to deal with complex, dynamic problems in a limited, simplified manner, aiming tentatively to achieve better results. As was explained previously, heuristics are a very common tool and reflect managerial behaviour. It is not argued that the tool should be adopted as the best one, but it is perhaps the most practical. It is arguable that the working problem is significantly large and the planning horizon is also large, demanding severe, drastic simplifications in case a solution in closed form is needed (Anderson & Morrice, 2006; Browning & Yassine, 2008).
The model was rebuilt and adapted to reflect the use of such heuristics. In particular, we focus on three types of heuristics: (1) gradual decrease or increase, (2) random normal choice and (3) target-based adjustment. The impact of these heuristics on performance and their efficiency in improving the PPM process are discussed. We argue that the over-commitment of resources distances managers from making better decisions. However, the under-commitment of resources is also detrimental to performance. A search for a better number of projects to be introduced into the pipeline, based on a gradual increase (or decrease) of project introduction rates, results in convergence, but the size of the periodic adjustment and the delays in the pipeline can limit the precision of the process. A small periodic adjustment is more precise; however, it slows down the search process. A random normal choice is detrimental to performance when the average value is optimal. A target-based adjustment has poor performance due to the long delays in the pipeline, which can cause oscillation in the chain. This type of effect, referred to as the bullwhip effect, was detected in other chains such as supply chains (Goodwin & Franklin, 1994; Sterman, 1995).
The research question of the study is, therefore, the following: is it possible to study the financial impact of the use of basic and simple project introduction heuristics on the financial performance of a product development pipeline such as the one being studied? Which of these “rules of thumb” yield a better result for the company being studied?
The modelBefore presenting the model used in this study, it is important to single out the differences between this study and the other studies based on the model. The studies based on the model use it in a way that is markedly different from the way it is used here. In Figueiredo and Loiola (2012), the optimal policies for the main decision variables are defined, except for the variable “starts” or number of projects started. In Figueiredo and Loiola (2014a), the way of screening projects in dynamically is presented, as this paper is a conceptual study. In Figueiredo and Loiola (2014b) a behavioural study with business administration students as subjects is performed to study the effect of the complexity of the product pipeline management decisions on the performance of the system. In Figueiredo et al. (2015), a new sector is added to the model to study the impact of longer development lead times on the performance of the pipeline, taking into account the short lifespan of the patents. In Figueiredo and Loiola (2016), the dynamic behaviour of the model is analyzed and policies for mitigating the bullwhip effect on the chain are evaluated.
In the model adapted for this study, we steer away from analyzing the conventional phase-gate processes that do not screen out or select products and instead focus on the innovation pipelines, especially their uncertain front ends (Figueiredo & Loiola, 2012; Jugend & Silva, 2012; Khurana & Rosenthal, 1997; Zapata & Cantú, 2008). The model has been presented five times in different publications and virtually all the equations have been listed and explained in the aforementioned papers. Figueiredo and Loiola (2012) list and explain the most important equations and Figueiredo and Loiola (2014b) present complete model documentation.
The basic structure and logic of the model are simple, and can be found in Figueiredo and Loiola (2012). Before being released into marketplace, projects that are started and introduced into the pipeline are developed and screened, in sequence. Value creation occurs while projects are developed at each stage, and depends on how intensively the teams are working. The average value created per project in terms of net present value increases through the process of screening because only higher value projects will be approved for the next stage. Based on the net present values (NPVs) of the population of projects that are tracked, managers decide which fraction of projects will be terminated at each stage (Krishnan & Ulrich, 2001; Terwiesch & Ulrich, 2009).
Aside from deciding on which projects will be terminated (i.e., defining a threshold or minimum NPV for a project to be approved), managers also decide on three variables: capacity adjustment (a given tendency between two extremes: working fast to reduce the backlogs of projects or working at the rate that maximizes value creation), resource allocation (people) across stages, and the average complexity of the projects (measured by the proxy man-hours per project at each stage) (Figueiredo & Loiola, 2012). It is assumed that the total amount of resources (people) is fixed. Each of these variables affects capacity utilization, i.e. how intensively the teams are working and, therefore, value creation, since there is a concave relationship between work intensity and value added (Clark & Wheelwright, 1993).
For the purposes of this study, we assume that managers adapt the work intensity of the development teams as needed and work faster/slower depending on the number of projects at hand. As was previously explained, this adjustment of work intensity has an impact on the value creation rates at each stage (Figueiredo & Loiola, 2012). In a product development pipeline, the available capacity of the development teams is adjusted locally (at each stage) to either adapt to the work demand or keep the utilization level around its nominal value. Therefore, the capacity utilization bias is defined as the managerial tendency to work between these two extremes. Teams will work more or less intensively depending on the capacity adjustment choice. If more importance is given to the objective of obtaining the fastest rate to reduce backlogs instead of working at the nominal utilization level, the increase in the value of projects as they go through the gates should be proportionally smaller because the capacity utilization will be above or below its nominal levels (Clark & Wheelwright, 1993; Figueiredo & Loiola, 2012; Girotra, Terwisch, & Ulrich, 2005). This trade-off is represented in Fig. 1.
. *The nominal value of capacity utilization is set to be at unity.")
Relationship between the resource utilization and the NPV creation multiplier (adapted from Clark & Wheelwright, 1993). *The nominal value of capacity utilization is set to be at unity.
As was explained by Figueiredo and Loiola (2012): “The resource allocation bias reflects managers’ tendencies to allocate more people to work on the initial, middle, or final stages of the pipeline. Managers also have a bias towards the allocation of complexity, i.e., they can have a tendency to increase/decrease the complexity of the projects at any stage of the process”. The complexity of projects can be measured in many ways depending on what type of product is being developed (lines of code for software, number of parts for a car, etc.) but in this study, the average size of the projects (in terms of investments) is adopted as a measure and proxy for complexity, meaning that a more complex project would require that more design and development activities need to be performed. This proxy was also adopted by Yu et al. (2010).
As defined in Figueiredo and Loiola (2012), the performance variables in the model are total value created (NPV) at the end of the pipeline during a given time; value creation rates (monetary value per unit of time) at each stage and the respective flows of projects. The adoption of NPV as the sole performance criterion for project screening is a necessary simplification; in most companies, however, more than one factor can be used in order to decide whether to terminate a project, and different factors may be used depending on the stage of development of the project. For example, a biotech company may be more focused on the safety of a substance at the early stages and on manufacturability at later stages.
The model structure is comprised of three processes: capacity management, value creation, and screening at any stage of the pipeline. Fig. 2.1 shows a stylized representation of the model, in order to display the main flow of projects and the key decision variables. See in Fig. 2.2 the stock and flow structure of a typical stage. These processes are briefly described below. More details, including all of the model's equations, can be found in Figueiredo and Loiola (2012, 2014b). The backlogs of projects are stocks where projects accumulate before being screened, at each stage. The average NPV at these stocks is the key variable that enables the screening of projects, based on the Gumbel filter.


Fig. 2.2 demonstrates just one stage of the model. It is actually comprised of three stages. The upper part of the figure displays the flow of projects. The aforementioned decision variables are shown in black boxes. “Stage 1 WIP” represents the stock of projects accumulating as they are developed (work in process). Projects are then reviewed at the “Stage 1 in Review” and are either approved for the next stage or eliminated. The screening process is performed by means of a Gumbel filter, i.e. it is assumed that the population of projects follows a Gumbel probability distribution function (Figueiredo & Loiola, 2012). If a given project has an NPV that is lower than a predetermined threshold, it is automatically terminated.
The lower part of Fig. 2.2 displays the flow of NPV, in a configuration called a co-flow (Sterman, 2000). Value is created at the beginning of each stage and depends on capacity utilization. The stock of value accumulates at the “Value in Stage 1 Review” stock and such value is used to calculate the Average NPV at a given stage. Such variable is key in the model because it allows the screening (or selection) of projects at each stage, using the aforementioned Gumbel filter. It is important to point out that as projects are terminated, their respective NPVs are also discarded from the stock of value, simultaneously (V Terminate 1). The flow of NPVs continues to the next stage, i.e., to the “Value in Next Stage WIP” stock and all the process starts once again until projects and their NPVs go through all three stages or are terminated.
Model structureThis section presents the three basic processes in the PPM model.
Capacity management processA key concept and structure in the model is the utilization of capacity. Wheelwright and Clark (1992, p. 91) demonstrate that employee productivity (the fraction of time spent on value-adding tasks) initially increases and then decreases as the number of development activities given simultaneously to each engineer increases. This effect is captured in a function that links utilization and the value created.
As was explained by Figueiredo and Loiola (2012):
“At each stage, managers have a fixed amount of resources (employees). Assuming that the allocation of resources is fixed, an increase in capacity — measured by man-hours per month — is only possible by using the existing resources more intensively, thereby increasing their utilization. In the event of overcapacity, the utilization equals the demanded capacity based on the backlog. The capacity is adjusted continuously, depending on the value of the target capacity and on the time to adjust capacity. The target capacity is defined as the demanded rate of development at each gate based on the backlog. If the backlog is filled with projects, the target capacity will be higher, resulting in higher work intensity or capacity utilization by the teams.”
Value creation processThe available capacity is used within each stage, as shown in Fig. 2.2, during the process of value creation. A certain number of projects enter the stage 1 backlog. The value of the projects is tracked by the model, along with their number. The NPV value of the projects is multiplied by a factor, depending on the capacity utilization, as the projects that were in the backlog are developed and proceed to the next phase to be reviewed. The rate stage to review is equal to the available capacity, unless there is overcapacity. The projects then reach gate 1 or stage 1 in review. In this phase, projects are reviewed, and depending on the average NPV, some of them will be discarded and the rest will follow the flow to the next stage, i.e. the backlog of the next stage. Projects that are approved in the final phase are released in the marketplace.
Project screening processAs was explained by Figueiredo and Loiola (2012):
“The average NPV of the projects feeds into the screening process: the decision to proceed or terminate a fraction of projects is made depending on the average NPV and a predetermined threshold. The population of NPVs of projects after a review is assumed to follow a Gumbel distribution because project screening is a search process that selects NPV extreme values (Dahan & Mendelson, 2001; Galambos, 1978; Gumbel, 1958). The Gumbel distribution is the probability distribution for the maximum multiple draws from exponential-tailed distributions. It applies to NPD problems especially well when there are no specific limits on the potential NPV of a project (Dahan and Mendelson, 2001).”
CalibrationThe model was calibrated to the Novartis Innovation Pipeline (Reyck, Degraeve, & Crama, 2004). This case study has all of the data needed for the calibration. The Novartis innovation funnel has four stages, but the initial stage of basic research was discarded and only the rest of the chain was modelled. The pipeline was calibrated for a “steady state condition”, where value creation is optimal and there is a bias towards working more intensely in order to reduce backlogs (Figueiredo & Loiola, 2012). In the calibration procedure, the following parameters were kept constant, with the exact same values as in the data set: average project complexity, starts, termination rates and resource allocation fractions. The calibration had a goodness of fit of ±5% for all variables, except for nominal development times (Figueiredo & Loiola, 2012).
Project introduction heuristicsWe focus on three types of heuristics for the project introduction; these heuristics are simplified ways of trying to balance the pipeline and searching for the right level of project introductions. First, we examine how gradual, monotonic adjustments of the project introduction rates affect performance and if such adjustments are effective in reaching the optimal level of starts. Because most development teams operate at a high level of work intensity or capacity utilization, it is interesting to check if a gradual decrease from a high level of starts can be effective in the search for the right policy. The impact of a gradual increase, from an initially low level of starts, is also studied.
Second, we investigate whether a random choice for project introduction rates can be effective once the average value of the random choices is close to the optimal choice. It is assumed that the managers have a benchmark for the project introduction rate, but there is uncertainty in the process such that the number of starts varies around the benchmark. A normally distributed choice for starts is used.
Third, we discuss the impact of target-based adjustments on performance. This heuristic takes into account the present and previous performances, changing the direction of the adjustments whenever performance decreases. We describe how the PPM heuristics were modelled in the next section.
Gradual monotonic decreaseThis simple heuristics adjusts the number of starts gradually, reducing their number by a constant value (delta adjustment) every period. The number of starts has a high initial value of 60 projects per year and is gradually reduced. The performance of the previous period, in terms of the value creation rate at the end of the pipeline, is compared to the present performance, and the adjustment stops whenever the value creation rate at the end of the pipeline ceases to increase.
Gradual monotonic increaseThis heuristics adjusts the number of starts by increasing their number by a constant value (delta adjustment) every period. The number of starts has a low initial value (20 projects per year) and is gradually increased. Once again, the performance of the previous period, in terms of the value creation rate at the end of the pipeline, is compared to the present performance, and the adjustment stops whenever the value creation rate at the end of the pipeline ceases to increase.
Random normal choicesEven though managers may make an intuitive judgments and educated guesses while deciding on a project introduction policy, uncertainty plays an important role in PPM. Once a benchmark is chosen, it is expected that the uncertainty inherent in the innovation process will affect their decisions. Although Novartis introduces 40 new projects every year on average, this number is not always kept constant (Reyck et al., 2004). It is therefore interesting to determine how different levels of uncertainty in the rate of starts affect performance. For such a purpose, a random normal distribution was applied to the decision on project introduction, and different levels of variation were added to the optimal value.
Target-based heuristicsThe most obvious choice for a decision rule that searches for the optimal choice of starts is one that takes into account the effects of the previous choices, changing the direction of the adjustment (increase/decrease) if the previous adjustment resulted in poorer performance. This is represented by Eqs. (1) and (2). Such an optimization effort would be based on a target for performance (value approval rate), and the search would stop once the performance is equal or above the target level (Target VALUE Outflow). This heuristics is based on (a) a rule to determine the direction of the next adjustment, taking into account the effect of a previous decision on the present performance (Eq. (2)), and (b) an equation to calculate the new value for starts using a pre-determined magnitude for the periodic adjustments (delta starts). The direction of adjustment is calculated by comparing the present value creation rate with the previous one. If the difference is positive, then the direction of the adjustment should be kept the same. Otherwise, the direction is changed. See further details below.
Analysis of results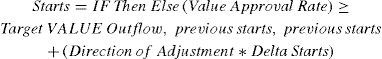

The model used in this study was calibrated to the Novartis innovation pipeline (Reyck et al., 2004). The Novartis pipeline has four stages, but the first stage (basic research) was excluded and only three stages were considered. For the purposes of the study, all variables except the project introduction rate (starts) were kept constant at base case values, which were taken directly from the data. Base case values are optimal decisions, meaning that value creation at the end of the pipeline is maximal and teams operate at a nominal capacity (100%), the point where the value added to the tasks is maximal.
The initial values for the stocks were obtained by running simulations so that the steady-state (equilibrium) values were determined. For example, when studying the random normal heuristics, one of the initial values for the starts is 40. A simulation was run using a constant value of starts at 40. The model reaches equilibrium after a certain period, and these values are used as the initial values for the stocks in the study.
The calibrated model has an optimal level of starts set at 40 projects per year, which is the base case value for the variable. If more or fewer projects are initiated, the total value created decreases.
Gradual monotonic decreaseWhile gradually reducing the number of starts, managers have to decide on the size of periodic adjustment; if the size is too large, the number of starts may increase to a value beyond the optimal level of the concave curve because the adjustment is large and stops whenever the value creation rate ceases to improve. The delays in the pipeline also contribute to the distance between the final choice of starts and the optimal value. This happens because some time is required between making a change in starts and noticing the results of such a change. However, there is a trade-off in this decision process; even though a small periodic adjustment is more precise, it also takes longer to find the right value for the decision variable. This process indicates that a mixed policy could result in better performance; managers could initiate larger adjustments and reduce them as the performance approaches a benchmark.
Figs. 3.1 and 3.2 below show the adjustment process and the impact of the heuristic on performance for different values of delta adjustment.
Gradual monotonic increase
A gradual monotonic increase of starts exhibits similar behaviour to a gradual decrease, as shown in Figs. 3.3 and 3.4. Smaller adjustments are more precise in attaining a value near the optimal level of 40 projects per year, but they slow down the search for the right policy.
Random normal choices
To determine the effect of uncertainty in project introduction policies, we compare a fixed, stable introduction of projects with a normal random introduction. In both conditions, the average project introduction rate is set at the optimal level. The figures below show how performance is affected by the different values of the standard deviation (σ) of the normal distribution. As the standard deviation of the random normal distribution increases, the performance level decreases. This phenomenon is shown in Figs. 3.5 and 3.6.
Target-based heuristics
The long delays in the NPD process make an ideal target-based search quite complex; there is no simple rule of thumb to tackle the problem efficiently. The average lead time of a pharmaceutical project in the Novartis innovation chain is approximately 11 years. Because of such large delays, it becomes extremely difficult to determine the correct direction of adjustments. The present decision will have an effect on the final performance after a long period, and the combined effect of policies from different periods is unknown. A heuristics that takes into account the change in performance and the direction of the adjustment made in the previous period will have very limited efficiency and will create oscillations in the choice of starts. However, this phenomenon is not unexpected. The presence of the oscillation caused by delays has been well-documented in other processes that are modelled as ageing chains, such as the Beer Game (Croson & Donohue, 2006; Goodwin & Franklin, 1994; Sterman, 1995; Steckel, Gupta, & Banerji, 2004).
The results of this heuristic are shown below. The target value creation rate is set at the maximum possible value (28.066 US$M per month), and the search process is set to stop whenever the value creation is between the ±10% interval relative to the target. However, the search process does not converge and the decision on starts exhibits oscillation and amplification of variance. This phenomenon, called the bullwhip effect, is observed in chains or distribution channels and refers to a trend of increasingly larger swings (oscillation and amplification) in the inventory or backlog. This trend is in response to changes in the upper part of the chain as one looks at stages further back in the chain. The concept first appeared in Jay Forrester's Industrial Dynamics (Forrester, 1961) and, thus, it is also known as the Forrester effect. As stated earlier, the bullwhip effect is an observed phenomenon in chains, such as supply chains or NPD pipelines (Forrester, 1961) (Figs. 3.7 and 3.8).
Conclusions and implications
In the pharmaceutical industry, value can be destroyed through longer product development times. This can be easily demonstrated: it usually takes around 12 years to launch a new product, a much longer period than the one that was common approximately a decade or so ago (Cook, 2006; Paich, Peck, & Valant, 2004). Given that patent lives are (normally) fixed at 20 years, the impact of increasing time to market is clear, i.e., higher research and development costs and less time in the market before generic products are able to enter the marketplace.
The problem of time to market is especially complex for pharmaceutical companies, since there are regulations regarding testing and pre-testing, both nationally and abroad, and ethical, moral and legal implications concerning the use of their products. These factors have to be taken into account in any effort to reduce time to market. There are limitations to how much improvement can be made in this dimension, since financial returns might be compromised, in the long run, if all necessary activities and safety tests are not followed accordingly. For example, litigation costs or losses due to a tarnished reputation might arise.
Pharmaceutical and biotech companies have been dealing with this issue by steering away from internal research and development, and instead performing acquisitions, licensing deals and partnerships with innovative, and many times younger biotechnology companies (Figueiredo et al., 2015). Agreements are being made between pharmaceutical companies that have empty innovation funnels but possess a larger infrastructure to market new drugs, and newer companies that have technology but not enough infra-structure (Wilson, 2010). A key problem with such policies is determining the right amount of projects to acquire or create internally. An overly small number of projects may compromise the future sales revenue of the company, as there would not be enough products in the company's portfolio. An excessively high number of projects can reduce efficiency and create bottlenecks in the process, delaying the release of new products and reducing their net patent life. This condition would also compromise future revenues. The main contribution of this study is to show one example of how managerial behaviour — more specifically, the use of heuristics while determining the correct amount of projects to introduce into the pipeline — has an impact on the financial performance of the pipeline.
Although a stylized model was used and our analysis was focused on a narrow set of management heuristics, it does have some potentially interesting implications for the product pipeline structure and project introduction strategies and can contribute to the theory and practices in the pharmaceutical industry in different ways.
The model and the procedures created for studying the financial impact of project introduction heuristics could be an accessory tool to help managers create strategies for project introduction through external acquisition and/or in-house development and avoid the problem of coping with an excessively large number of projects. As we have shown, a calibrated model can show signs that a given heuristic yields better results. On the present study, it was found that a simpler heuristic of a gradual decrease or increase of project introduction rates from a high/low work intensity condition was better than a target-based heuristics in which the direction of the adjustment can be changed. It was also found that having a target for value creation adds considerable complexity to the problem because the delays in the process create difficulties in deciding on the right direction of the adjustments, which indicates that, in the absence of a more sophisticated model to determine optimal policies, managers of the Novartis pipeline should adjust project introduction rates gradually. It was also found that the size of periodic adjustments was the key driver of precision in such a decision process at the company; a smaller adjustment is more precise but takes longer to converge. A larger adjustment converges faster but with less precision. Furthermore, a consistent, stable project introduction policies yield better results than policies that vary in terms of the optimal introduction rate.
The pharmaceutical industry is faced with complex problems, which are NP-hard or NP-complete (Anderson & Morrice, 2006; Anderson et al., 2005; Browning & Yassine, 2008). The results of our analysis show that the specific problem of choosing the project introduction rate can be improved by using an adequate rule of thumb or heuristic. The results presented here are not fully generalizable. Therefore, the stylized model presented here should be calibrated and adapted to specific conditions found at other companies, and results might change.
In terms of theoretical contribution, this paper presents a formal and original model of a pharmaceutical product pipeline that is calibrated to the conditions found in a specific company. Developing formal models of the economics of screening in the presence of complexity and resource tradeoffs, either at a single stage or in a cascade of stages, and accounting for behaviour bias (Gino & Pisano, 2005a,b) offers opportunities for follow-up work. We present this model as a valuable tool for the analysis of the dynamics of the product development pipeline and hope that this model will serve as a basis for future analysis. This paper uses the data presented in Reyck et al. (2004), which is a simple case study, to serve as a data source for the calibration of the model.
The limits of the present paper suggest several lines of future research. First, in terms of future simulation work, it would be helpful to explore a broader range of R&D contexts apart from pharmaceutical pipelines. Second, even though simple rules can be effective in finding a better policy for starts (under certain conditions), the PPM problem is a complex one. In a real company, updates would have to be made periodically to the policies or adopted guidelines because of the changes in the pipeline configuration. It was assumed that all other decision variables and parameters in the model were kept constant; however, other parameters could change over time and add considerable complexity to the task, as there are many significant interactions between the key decision variables (Figueiredo & Loiola, 2012).
While simulation is useful for exploring the specific effects in a controlled manner, some of the richness of an empirical setting was lost. For instance, it would be interesting to capture managerial behaviour by means of an experimental, game-based study. We leave that for a follow-up study. We hope that this paper has highlighted some fruitful avenues for further empirical validation and exploration.
Conflicts of interestThe authors declare no conflicts of interest.
Peer Review under the responsibility of Departamento de Administração, Faculdade de Economia, Administração e Contabilidade da Universidade de São Paulo – FEA/USP.